Journal of Chemical and Pharmaceutical Research, 2016, 8(2):505-512
Research Article
CODEN(USA) : JCPRC5
ISSN : 0975-7384
Quantitative evaluation of phosphorus dissolved in the water of Bounamoussa
River (North Eastern Algeria)
Soumaya Boussaha and Aziz Laifa
Soil Research and Development Laboratory, Biology Department, Faculty of Sciences, Badji Mokhtar, University- Annaba, Algeria
_____________________________________________________________________________________________
ABSTRACT
Phosphorus is an element responsible for the eutrophication of inland and marine aquatic environments. This global environmental phenomenon represents a current problem causing the decrease in the quality of aquatic environments. Within the frame of resolving this problem, we conducted analyzes of physicochemical parameters (T °, pH, EC, COD, PO4-3, Pt) on water taken from Oued Bounamoussa (northeastern Algeria) in an attempt to
diagnose the eutrophication state of surface water of this watercourse. For this purpose, samples were taken on a seasonal basis during the periods of October 2013, January 2014, April 2014 and July 2014 from ten selected stations. The analysis results show that the temperature values are high in summer with an average of around 30 ° C and low in winter to about 09 ° C. The pH varies between 6.14 and 8.14, with an electrical conductivity content ranging between 266 µs/cm and 4006 µs/cm. An increase in the COD of up to 910 mg/l during July 2014 is witnessed. The eutrophication situation of the environment can be observed by the high values of orthophosphate and total phosphorus that exceed the standards of the surface water’s quality. In general terms, water quality of Oued Bounamoussa that was affected by this phenomenon, is bad which causes an ecosystem disturbance.
Key words: physico-chemical analysis, Oued Bounamoussa, phosphorus, eutrophication.
_____________________________________________________________________________________________
INTRODUCTION
The renewable fresh water is a crucial resource for life. It deserves special attention, since it is highly altered and seriously threatened by human activities [01]. In Algeria, the exploitation of water resources is great. This is mainly due to the growing needs associated with the population growth, accelerated development of economic activities, including irrigated agriculture, industry and the lack of awareness of the population about environmental protection. All these factors lead to an imbalance of the ecosystem and generate pollutants that can affect the physicochemical and biological quality of aquatic receptors [02].
The eutrophication of lakes and reservoirs is amongst the most widespread water pollution parameters [3]. Eutrophication is a natural very slow process by which water bodies receives large amounts of nutrients including phosphorous, which stimulates the growth of algae and aquatic plants. However, human activities have accelerated, in many streams, the amount of phosphate components that reach them, which causes changes in the balance of these aquatic ecosystems. Through the increased use of chemical fertilizers in agriculture and the development of intensive farming, industrial effluents and domestic sewage also promote the phenomenon in urban and industrial areas [4].
EXPERIMENTAL SECTION
Presentation of the study sites Sampling Stations
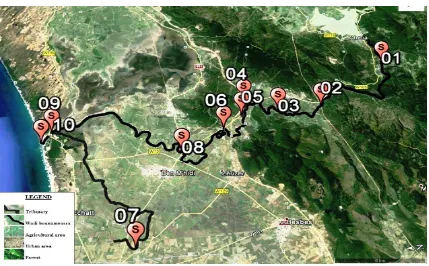
In this study, we have chosen ten water sampling stations located along Oued Bounamoussa based on some criteria mainly related to the field of the study area:
-The conditions must be favorable. -Relationship with homes and farmland. -Accessibility to the station.
[image:2.595.96.525.382.648.2]The water samples were taken on October 2013, January 2014, April 2014 and July 2014.
Table 01: location of the studied stations at Oued Bounamoussa
Station Lambert Contact Region Latitude Longitude
S 01 N36° 36’ 9,83’’ E008° 24’ 72’’ Tofaha
S 02 N36° 39’ 23,16’’ E007° 57’ 42,50’’ Bouzitouna
S 03 N36°41’ 11,82’’ E007° 57’ 36,12’’ Skoufi
S 04 N36° 42’ 30,92’’ N36° 42’ 30,92’’ Nchayma1(la ferme)
S 05 N36° 42’ 44,31’’ E007° 57’ 29,93’’ Nchaima2(cimetière)
S 06 N36° 43’ 35,13’’ E007° 56’ 39,63’’ Pont de Zerizer
S 07 N36° 47’ 37,96’’ E007° 50’ 12,27’’ Bordj Semar
S 08 N36° 45’ 25,12’’ E007° 55’ 23,69’’ Ben-M’hidi
S 09 N36° 50’ 28,10’’ E007° 57’ 19,58’’ Griâte
S 10 N36° 50’ 54,2’’ E007° 56’ 40,69’’ Battah
Water samples were collected and filled into polyethylene bottles, previously rinsed with water from the station. They were then stored at 4 ° C during transportation to the laboratory and were analyzed within 24 hours.
Physicochemical Analysis Methods
Table 02: Parameters conducted in this study with their methods and measurement units:
Parametres Mesures in situ
Analysis Methods Measurement units Temperature
pH
Electrical conductivity
A multiparameter (HANNA instruments HI 9828) A multiparameter (HANNA instruments HI 9828) A multiparameter (HANNA instruments HI 9828)
°C
µs/cm Measurements carried out in the laboratory
COD
Orthophosphate Total phosphorus
AFNOR Method(T90-101) [6] Spectrophotometric methods [07] Spectrophotometric methods [08]
mg/l mg PO4-3/l
mg PO4-3/l
Materials and methods Overview of Study area
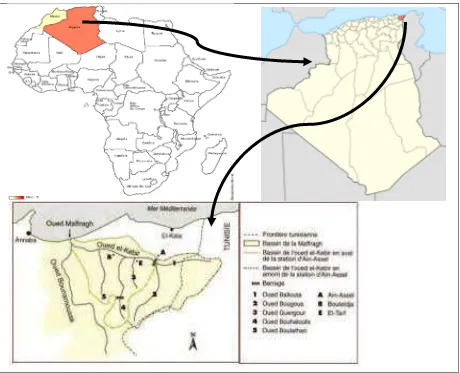
El-Tarf province is located in the extreme north-east of Algeria, between latitude of 36° 75'00"and longitude of 08°16'66".Crossed by the highway El Kala - Annaba (Figure 1), the province Covers an area of approximately 2891 km2.It is limited on the north by the Mediterranean Sea, on the South and South-West by Souk-Ahras and Guelma respectively, on the West by Annaba and on the East by the Algerian-Tunisian borders. In the agricultural sector, this region includes ten small agro-industrial units. Its Mediterranean climate makes it one of the wettest regions of Algeria. The average annual rainfall from south to north is highly variable from 450 to 1000 mm. [9] Located in the plain of Bounamoussa; a major irrigation perimeter spanning 90% of El-Tarf province and covering the municipalities of Besbes, Beni Amar, Zerizer, Asfour, Ben M'hidi and Chebaita Mokhtar. It is limited on the North by coastal dunes, ontheSouth by the mountains of Medjerda, on the East by the Mountains and to the West by the National Highway 16 (Annaba, Souk- Ahras). [10]
[image:3.595.78.538.355.728.2]
RESULTS AND DISCUSSION
[image:4.595.123.488.381.605.2]The quality of river water was evaluated according to the physic-chemical parameters. It is determined by comparing our results across the quality grid of the National Agency for Water Resources (N.A.W.R) doors that are on the table.
Table 03: Quality class of surface water (N.A.W.R)
Parameter Units Excellent Good Fair Poor Excessive pollution
The temperature of the water °C < 20 20 à 22 22 à 25 25 à 30 30
pH _ 6.5 à 8.5 _ 6 à 6.5 ou
8.5 à 9
5.5 à 6 ou 9 à 9.5
< 5.5 ou > 9.5
The electrical conductivity µS/cm < 400 400 à 750 750 à 1500 1500 à 3000 3000
DCO mg/l ≤20 20 à 50 50 à 100 100 à 150 150
Orthophosphate mg/l < 0.2 0.2 à 0.5 0.5 à 1 1 à 5 5
Phosphore total mg PO43/l 0,05 0,2 0,5 1 ≤1
La temperature (T°C)
The water temperature is an environmental factor that causes significant ecological repercussions. [11] It acts on the density, the viscosity, the solubility of water gases, the separation of dissolved salts, as well as the chemical and biochemical reactions, the development and growth of organisms living in water and particularly the microorganisms [12].
The recorded temperatures of the study area (Figure 03) range between 09° C (S03) and 13° C (S09 and S10) during January 2014 and between 27 ° C (S03 and S04) and 30° C (S01) during July 2015. These variations in temperature follow those of the region’sclimate.
Temperatures measured in Oued Bounamoussa water belong to the good class with an average of 21° C.
.
Figure 03: Spatio-temporal variation of temperature
Potential of Hydrogen (pH)
The pH of water measures the concentration of the protons H + in. It summarizes the stability of the balance between different forms of carbonic acid and is linked to the buffer system developed by carbonates and bicarbonates [13]. The pH of water depends on the carbon balance and the photosynthetic activity of the ecosystems. The discharge of domestic and industrial waste water can influence the pH of the environment despite its buffer capacity [14].
The analysis of pH results shows a small variation, with an average of 7.36, a minimum of 6.44 at the station (S04) on October 2013 and a maximum of 8.14 at station (S02) on January 2015 (Figure 04).
0 5 10 15 20 25 30
S01 S02 S03 S04 S05 S06 S07 S08 S09 S10
T (°C)
Samling Station
oct-13
janv-14
avr-14
The observed values show that pH is slightly neutral to alkaline in all stations of Oued Bounamoussa, in the rainy season more than in the dry period, which may be due to the rainwater. [1] The acidity of pH on October can be explained by the abundance of CO2 dissolved in the water during the low water period [15] [16]. This small variation is due to the buffering effect of bicarbonate ions.
[image:5.595.125.489.128.347.2].
Figure 04: Satio-temporal variation of pH values
The Electrical Conductivity (EC)
The conductivity of the surface water of the study area (Figure 05) has significant values that vary as follows: -A Maximum of 4006µs/cm at the station (S10) and a minimum of 436µs/cm at the station (S02 during the month of July 2014.
-A maximum of 1453µs/cm at the station (S10) and a minimum of 265µs/cm at the station (S02) on January 2014.
.
Figure 05: Spatio-temporal variation of the values of electrical conductivity
The increase in conductivity in the warm period may be due to the low flow of the Oued which results in increased levels of minerals and to strong atmospheric evaporation [17]. The highest value was recorded at the station S10 which is influenced by the proximity of the marine environment. Moreover, the minimum values are marked in
0 1 2 3 4 5 6 7 8 9
S02 S03 S04 S05 S06 S07 S08 S09 S10
pH
Sampling station
oct-13
janv-14
avr-14
juil-14
0 500 1000 1500 2000 2500 3000 3500 4000 4500
S01 S02 S03 S04 S05 S06 S07 S08 S09 S10 E.C(µs/cm)
Sampling station
oct-13
janv-14
avr-14
[image:5.595.122.491.452.685.2]In our study case, the values exceed the standard of the surface water quality (N.A.W.R) 1500 µs/cm, indicating excessive mineralization attributed to wastewater from neighboring towns which allows the classification Oued Bounamoussa in the poor class.
Chemical Oxygen Demand
Chemical oxygen demand (COD) represents the amount of oxygen consumed by the chemically oxidizable materials contained in water. It allows assessing the concentration of organic or inorganic materials, dissolved or suspended in water, through the amount of oxygen required for the total chemical oxidation [19].
COD contents recorded at the studied waters range between 50 mg/l (S07) and 910 mg/l (S02) in October and between 45 mg/l (S01) and 135 mg/l (S03) in January (Figure 08). The values recorded at October and July exceeds the standards of the N.A.W.R set at 100 mg/l.
.
Figure 06 : Spatio-Temporal variation in chemical oxygen demand
Orthophosphate (PO4-3)
The orthophosphate is a biogenic element vital to the growth of algae. The higher levels of this element in surface waters can cause eutrophication [01]. The results analysis (Figure 06) shows that concentration of orthophosphate in OuedBounamoussa surface water varies between 0.10 mg/l (S05) and 0.49 mg/1 (S06) in January 2014 and between 0.18 mg/l (S02) and 2.29 mg/l (S05) in July 2014.
Orthophosphate that follow a spatial variation relatively marked by a rising trend in hot weather can be explained by the discharge of domestic waste water and by leaching of the farmlands fertilized with phosphate nourishments. The levels of orthophosphate we obtained are high and indicate a poor water quality according to the (N.A.W.R) standard. These high levels of this element cause the eutrophication that lead to ecosystem disturbance by the appearance of algae as Cyanophyceae with a rate of (44.03%), Euglenophycées (41.61%), Diatomophyceae (10.96%) and Chlorophyceae (3.38%) [20].
Total Phosphorus (TP)
In this study, seasonal evolution of the total phosphorus showed higher concentrations during July than during October, January and April. The recorded contents (Figure 07) range between 2,81mg PO4
3
/ l (S05) and 1,30 mg PO4-3/ l (S06) and between 1,70 mg PO4-3/l (S07)and 0,64 mg PO4-3/l (S10)respectively during July and October. These high values are due, on the one hand, to the industrial wastes including those containing detergents, and on the other hand, to the phosphate fertilizers. The total phosphorus content ranges from almost similarly to orthophosphate, which indicates a self-purifying effect in this hydrosystem.
0 100 200 300 400 500 600 700 800 900 1000
S01 S02 S03 S04 S05 S06 S07 S08 S09 S10 COD (mg/l)
Sampling station
oct-13
janv-14
avr-14
.
Figure 07: Spatio-temporal variation of orthophosphate values
Thus, Total phosphates measured in the water of Oued Bounamoussa belong to the class of excessive pollution with an average of 1,71 mg PO4-3 /l.
[image:7.595.124.488.356.577.2].
Figure 08: Spatio-temporal variation of total phosphorus values
CONCLUSION
In the light of the results obtained in the physicochemical parameters measured at the surface water of Oued Bounamoussa, a degradation of water quality is noticed and most tests revealed levels that exceed the of the international quality standards of surface water. It is worth mentioning that the contents discharged in phosphorus materials characterize a favorable situation for eutrophication.
This phenomenon promotes the proliferation of pollution-resistant organisms such as Chlorophyceae, Cyanophyceae and Diatomophyceae that represent the algal population.
The agricultural and industrial activities as well as the urban areas are the main sources of the phosphorus. Therefore, the preservation of water resources becomes imperative facing the deterioration of these aquatic
0 0.5 1 1.5 2 2.5
S01 S02 S03 S04 S05 S06 S07 S08 S09 S10
PO4-3(mg/l)
Sampling station
oct-13
janv-14
avr-14
juil-14
0 0.5 1 1.5 2 2.5 3
S01 S02 S03 S04 S05 S06 S07 S08 S09 S10
TP (mg PO43/l)
Sampling station
oct-13
janv-14
avr-14
Acknowledgments
This work was performed at the Laboratory of soil research and development, Department of Biology - Badji Mokhtar University Annaba, Algeria. We sincerely thank all those who contributed in one way or another in the development of this work
REFERENCES
[1] M Makhoukh; M Sbaa; A Berrahou; M Van.Clooster., 2011. Journal Larhyss, ISSN 1112-3680, n°09. 150- 154p.
[2] N Harrat; S Achour., 2010. Pollution physico-chimique des eaux de barrage de la region d’El-Tarf, impact sur la chloration. Journal Larhyss, ISSN 1112-3680, n°08. 48p.
[3]M Semaoune., 2008. Comparative study of aeration by the aeration and destratification Guidelines on environmental inspection systems for Mediterranean area. MAP Technical Report. 149p.
[4] M Khellou., 2012. Flux de l’azote et du phosphore minéraux à l’embouchure de l’Oued Seybouse. Mémoire de Magister en sciences Biologie et Ecologie Végétale. Université Badji Mokhtar Annaba Algérie. 01p.
[5] Google earth.
[6] J Rodier; L Bernard; M Nicole ., 2009. The analysis of the water, 9th Edition, Dunod, Paris. 988p. [7] J Rodier., 1996. Analysis of natural water, waste water, sea water, 8th Edition, Dénod, Paris. 1383p. [8] J Rodier; L Bernard; M Nicole., 2009. The analysis of the water, 9th Edition,Dunod, Paris. 426 p.
[9] H Bousnoubrah; N Chettab; N Kherici; C.L Rousset., 2004. Evaluation et exploitation des ressources en eau dans un système aquifère sud méditerranéen exemple de Annaba – El Tarf (Nord Est de l’Algérie). Revue des sciences et de la technologie, Revue Synthèse, N°13. 76-84p.
[10] O Kheireddine., 2012. Contribution à l’étude de l’impact de la fertilisation des terres agricoles sur la prolifération des phytoplanctons (Oued Bounamoussa). Mémoire de Magister en science d’Agriculture et Fonctionnement des écosystèmes. Université Badji Mokhtar El-Tarf Algérie. 75p.
[11] G Leynaud ., 1968. Les pollutions thermiques, influence de la température sur la vie aquatique. B.T.I. Ministère de l’agriculture, 224-881p.
[12] W.H.O., 1987. Global pollution and health results of related environmental monitoring. Global Environment Monitoring system, WHO, UNEP.
[13] M Ezzaouaq., 1991. Caractérisation hydrodynamique, physico-chimique et bactériologique des eaux superficielles de l’estuaire du Bouregreg soumis aux rejets des villes de Rabat-Salé. Thèse D.E.S. Faculté de science Rabat Maroc. 140 p.
[14] H El Halouanih ., 1995. Réutilisation des eaux usées en agriculture et leur impact sur l’environnement : cas de la ville d'Oujda. Thèse d'Etat, Faculté des Sciences Oujda Maroc. 144 p.
[15] A Gartet; J Gartet; C Conesa Garcia., 2001. Papeles of geografia. 34, 143-161 p. [16] G Gueade; A Quattara; O Edia., 2009. EJSR34. 384-394p.
[17] M Doubi; A Dermaj; B Ait Hadou; D Chebabe; H Erramli; N Hajjaji; A Abdellah Srhiri., 2013. Contribution a l’etude physico-chimique de l’oued Moulouya et un affluent au niveau de la region d’Outat El-Haj. Larhyss journal, ISSN 1112-3680, n°16. 96p.
[18] H El Haouati; M Guechaoui; A Arab ., 2013. Effet de l’eutrophisation sur les milieux aquatiques : Barrage de Hammam Boughrara Tlemcen.USTHB‐FBS‐4th International Congress of the Populations & Animal Communities: Dynamics & Biodiversity of the terrestrial & aquatic Ecosystems"CIPCA4"TAGHIT Bechar Algeria. 229p.
[19] AD N’Diaye; OC El-Kory; MI EL-Kory; MOK Sid’Ahmed; K Iben’Namr., 2012. Contribution des méthodes d’Analyses statistiques à l’évaluation de la qualité physicochimique des effluents de la STEP utilisés en agriculture dans le périmètre maraîcher du Sebkha (Nouakchott, Mauritanie). Journal Science en Liberté Editions Mersenne, ISSN 2111-4706, n ° 120501. 10p.