DEVELOPMENT OF DC-DC CONVERTER FOR DC MOTOR USING NEURAL NETWORK CONTROLLER
RASYIDI BIN ABDULLAH
A project report submitted in partial
fulfilment of the requirement for the award of the
Degree of Master of Electrical Engineering
Faculty of Electrical and Electronics Engineering
Universiti Tun Hussein Onn Malaysia
ABSTRACT
ABSTRAK
CONTENT
TITLE I
DECLARATION II
DEDICATION III
ACKNOWLEGMENT IV
ABSTRACT V
CONTENT VII
LIST OF FIGURES IX
LIST OF TABLES XI
LIST OF SYMBOLS AND ABBREVIATIONS XII
CHAPTER 1 INTRODUCTION 1
1.1 Motivation 1
1.2 Project Background 2
1.3 Problem Statement 3
1.4 Project Objectives 4
1.5 Project Scopes 4
CHAPTER 2 LITERITURE REVIEW 5
2.1 Technology Development 5
2.2 Theory Of Operation Buck Converter 6
2.3 The DC-DC Buck Converter 10
2.4 Neural Network 11
2.5 DC Motor 12
CHAPTER 3 METHODOLOGY 15
3.1 Project Design 15
3.2 Proposed DC Motor 18
3.3 Proposed Proportional Integral Controller 19
3.4 Proposed PID Controller 20
3.5 Architecture Of Neural Network Controller 21 3.6 Proposed Neural Network Controller 21
CHAPTER 4 RESULT AND ANALYSIS 25
4.1 DC Motor Speed Using PI Controller 25 4.2 DC Motor Speed Using PID Controller 27 4.3 DC Motor Speed Using NN Controller 29
CHAPTER 5 CONCLUSION AND RECOMMENDATION 34
5.1 Existing Paper 34
5.2 Future Works 34
LIST OF FIGURES
2.1 Buck Converter Circuit 6
2.2 PWM signal to control the switches in the DC-DC converter 6 2.3 Equivalent circuit of the buck converter when the switch is closed 7 2.4 Equivalent circuit of the buck converter when the switch is open 7 2.5 Ideal switch, (a) used to reduce the voltage dc component 8
2.6 Output voltage waveform vs(t). 8
2.7 Output voltage dc component by the switching period 9 2.8 Insertion of low-pass filter, to remove switching harmonics and pass
only the dc component of vs(t) to the output.
10
2.9 Buck converter dc output the voltage V vs. duty cycle D. 10
2.10 DC buck converter topology 10
2.11 Buck converter circuit when switch: (a) turns on (b) turns off 11
2.12 Matlab/Simulink model of DC motor 11
2.13 A perceptron network with three layers 12
2.14 A simulation model of PID controller 13
3.1 Block Diagram For Propose DC-DC Buck Converter Using Neural Network Controller
15
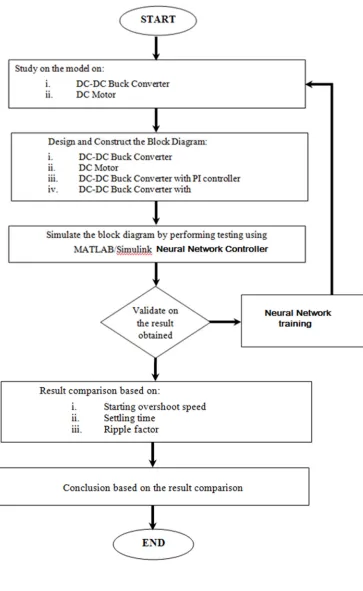
3.2 The methodology Flow Chart 17
3.3 Matlab model of DC motor 18
3.4 Block diagram of PI controller 19
3.5 PI controller Matlab Simulink block 20
3.6 The model for PID controller in MATLAB/Simulink 20
3.7 Architecture of Neural Network 21
3.8 NN block 24
3.9 Layer 1 block 24
3.10 Layer 2 block 24
4.2 Simulation output speed for PI controller 26
4.3 Maximum overshoot and ripple 26
4.4 Output speed for PI controller 27
4.5 Simulation model with PID controller 27
4.6 Maximum overshoot and ripple with PID controller 28
4.7 Output speed for PID controller 28
4.8 Simulation diagram for NN controller 29
4.9 Simulation output speed for NN controller 29
4.10 Maximum overshoot and ripple with NN controller 30
4.11 Output speed for NN controller 30
4.12 NN training tools 31
4.13 NN training performance 31
4.14 NN training error histogram 32
LIST OF TABLES
LIST OF SYMBOLS AND ABBREVIATIONS
D - Duty Cycle
T - Time
Vs - Supply voltage
Vo - Output voltage
Mv - Ratio
Vref - Reference voltage
e - Error
J - Inertia
L - Inductance
C - Capacitor
R - Resistance
No - Output speed
Nref - Reference speed
CHAPTER 1
INTRODUCTION
1.1 Motivation
The switched mode dc-dc converters are some of the simplest power electronic circuits which convert one level of electrical voltage into another level by switching action. These converters have received an increasing deal of interest in many areas. This is due to their wide applications like power supplies for personal computers, office equipment, appliance control, telecommunication equipment, DC motor drives, automotive, aircraft, etc.
The commonly used control methods for dc-dc converters are pulse width modulated (PWM) voltage mode control, PWM current mode control with proportional (P), proportional integral (PI), and proportional integral derivative (PID) controller. These conventional control methods like P, PI, and PID are unable to perform satisfactorily under large parameter or load variation.
Therefore, the motivation of this thesis is to control the output DC motor
1.2 Project Background
General idea of DC-DC converter to convert a fixed voltage dc source into a variable voltage dc source. The output voltage of the DC-DC converter can be higher
or lower than the input. DC-DC Converter widely used for traction motor in electric automobiles, trolley cars, marine hoists, and forklift trucks. They provide smooth acceleration control, high efficiency, and fast dynamic response. Dc converter can be used in regenerative braking of dc motor to return energy bake into the supply, and this feature results in energy saving for transportation system with frequent stop; and also are used, in dc voltage regulation. There are many types of dc-dc converter which is buck (step down converter), boost (step-up) converter, and buck-boost (step up- step-down) convertor. (Muhammad H. Rashid, 2004).
Classical PID controllers are commonly used in industries due to their simplicity and ease of implementation (Rubaai, A. et al., 2008). In linear system model, controller parameters of the PID controller are easy to determine and resulting good control performances. However, for nonlinear system model applications such as BLDC motor drive, control performance of the PID controller becomes poor and difficult to determine the controller parameters (Hong, W. et al., 2007 and Tipsuwanporn, V, et al.,2002).
In order to improve control performance of the BLDC motor drive, several intelligence controllers such as fuzzy logic control, neural network control and hybrid neuro-fuzzy control methods for BLDC motor have been reported in (Rubaai, A. et al., 2008, Tipsuwanporn, V. et al., 2002, Mahdavi, J. et al., 2011, Lee, B. K. et
al., 2003, Cunkas, M. et al., 2010, Gokbulut, M. et al., 2007, Ji, H. et al., 2008 and Ji, H. et al., 1997).
In this project, a complete simulation model with neural network control (NNC) method for DC motor drive is proposed using MATLAB/Simulink. The develop NNC has the ability to learn instantaneously and adapt its own controller parameters based on external disturbance and internal of the converter with minimum
steady state error, overshoot and rise time of the output voltage.
1.3 Problem Statement
DC-DC converter consists of power semiconductor devices which are operated as electronic switches. Operation of the switching devices causes the inherently nonlinear characteristic of the DC-DC converters including one known as the Buck Converter. The switching technique of the Buck converter causes the converter system to be nonlinear system. Nonlinear system requires a controller with higher degree of dynamic response. Proportional-Integral (PI) is one of the controllers used as a switching device for the converter. However the PI controller is known to exhibit sluggish disturbance rejection properties [5].
A study by Zulkifilie Ibrahim and Emil Levi (2002) shows that the PI speed control offers high speed dip and large recovery time when the load is connected. Therefore the implementation of Neural Network that will deal the issue must be investigated. Since the Buck converter is a nonlinear system, the Neural Network controller method will be developed to improve overshoot speed at starting of the motor and settling time. The developed Neural Network controller has the ability to learn instantaneously and adapt its own controller parameters based on external disturbances and internal variation of the converter. Thus this neural network can
1.4 Project Objectives
The objectives of this project are:-
i. To develop DC-DC buck converter using Proportional Integrated (PI)
Controller
ii. To develop DC-DC buck converter using Neural Network Controller (NNC) iii. To compare the NNC with PI performance in terms of speed overshoot,
settling time and ripple factor
1.5 Project Scopes
The scopes of the project are:
i) Modelling the DC-DC Buck converter with DC Motor
ii) Modelling the Proportional-Integrated (PI) controller for speed control iii) Modelling the Neural Network controller for speed control
CHAPTER 2
LITERATURE REVIEW
2.1 Technology Development
Switch mode DC-DC converters efficiently convert an unregulated DC input voltage into a regulated DC output voltage. Compared to linear power supplies, switching power supplies provide much more efficiency and power density. Switching power supplies employ solid-state devices such as transistors and diodes to operate as a switch either completely on or completely off [4].
Energy storage elements including capacitors and inductors are used for energy transfer and work as a low-pass filter. The buck converter and the boost converter are the two fundamental topologies of switch mode DC-DC converters. Most of the other topologies are either buck-derived or boost-derived converters, because their topologies are equivalent to the buck or the boost converters [2].
Traditionally, the control methodology for DC-DC converters has been analog control. In the recent years, technology advances in very-large-scale
2.2 Theory of Operation Buck Converter
The operation of the buck converter is fairly simple, with an inductor and two switches (usually a transistor and a diode) that control the inductor. It alternates between connecting the inductor to source voltage to store energy in the inductor and discharging the inductor into the load.
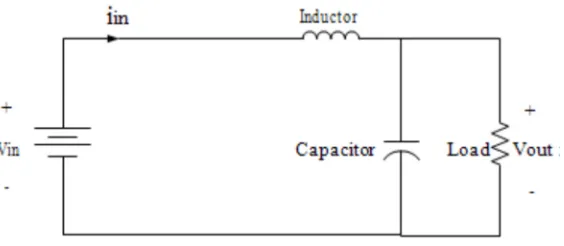
The buck converter, shown in Figure 2.1, converts the unregulated source voltage Vin into a lower output voltage Vout. The NPN transistor shown in Figure 1 works as a switch. The ratio of the ON time ( tON ) when the switch is closed to the
[image:15.595.149.482.343.629.2]entire switching period (T) is defined as the duty cycle D = to/T. The corresponding PWM signal is shown in Figure 2.2 [10].
[image:15.595.182.460.347.475.2]FIGURE 2.1: Buck Converter Circuit
FIGURE 2.2: PWM signal to control the switches in the DC-DC converter
through the capacitor and the diode [2]. The output voltage is controlled by varying the duty cycle. On steady state, the ratio of output voltage over input voltage is D, given by Vout/ Vin.
FIGURE 2.3: Equivalent circuit of the buck converter when the switch is closed
FIGURE 2.4: Equivalent circuit of the buck converter when the switch is open
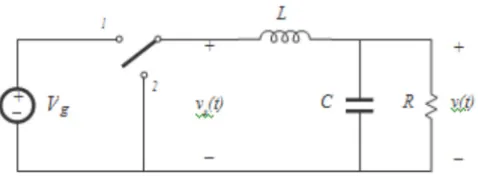
A buck converter is a step-down DC to DC converter. Its design is similar to the step-up boost converter, and like the boost converter it is a switched-mode power supply that uses two switches (a transistor and a diode), an inductor and a capacitor. The buck converter reducing the dc voltage, using only non-dissipative switches, inductors, and capacitors. The switch produces a rectangular waveform vs(t) as
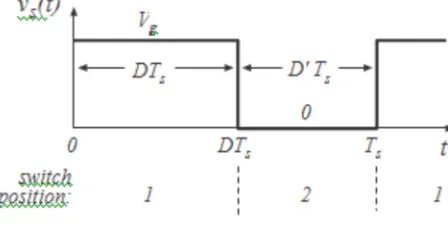
illustrated in Figure 2.5. The voltage vs(t) is equal to the dc input voltage Vg when the
switch is in position 1, and is equal to zero when the switch is in position 2. In practice, the switch is realized using power semiconductor devices, such as transistors and diodes, which are controlled to turn on and off as required to perform the function of the ideal equal to the inverse of the switching period Ts, generally lies
[image:16.595.232.414.336.461.2]The duty ratio D is the fraction of time which the switch spends in position 1, and is a number between zero and one. The complement of the duty ratio, D’, is defined as (1-D) [2].
FIGURE 2.5: Ideal switch, (a) used to reduce the voltage dc component
FIGURE 2.6: Output voltage waveform vs(t).
The switch reduces the dc component of the voltage: the switch output voltage vs(t)
has a dc component which is less than the converter dc input voltage Vg. From
Fourier analysis, we know that the dc component of vs(t) is given by its average value
<vs>, or
( )
t dt V Ts VT
s s >=
∫
⋅<
0
1
(2.1)
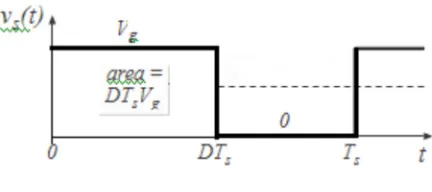
As illustrated in Figure 2.7, the integral is given by the area under the curve, or DTsVg. The average value is therefore
g g
S
s DTV DV
Ts
V >= =
< 1
(2.2) So the average value, or dc component, of vs(t) is equal to the duty cycle times the dc
[image:17.595.203.427.326.446.2]FIGURE 2.7: Output voltage dc component by the switching period
What remains is to insert a low-pass filter as shown in Figure 2.7. The filter is designed to pass the dc component of vs(t), but to reject the components of vs(t) at the
switching frequency and its harmonics. The output voltage v(t) is then essentially equal to the dc component of vs(t):
g
s DV
V V < >=
(2.2) The converter of Figure 2.8 has been realized using lossless elements. To the extent that they are ideal, the inductor, capacitor, and switch do not dissipate power. For example, when the switch is closed, its voltage drop is zero, and the current is zero when the switch is open. In either case, the power dissipated by the switch is zero. Hence, efficiencies approaching 100% can be obtained. So to the extent that the components are ideal, we can realize our objective of changing dc voltage levels using a lossless network.
The network of Figure 2.8 also allows control of the output. Figure 2.9 is the control characteristic of the converter. The output voltage, given by equation (2.3), is plotted vs. duty cycle. The buck converter has a linear control characteristic. Also, the output voltage is less than or equal to the input voltage, since 0 ≪ D ≪ 1.
FIGURE 2.8: Insertion of low-pass filter, to remove switching harmonics and pass only the dc component of vs(t) to the output.
[image:19.595.241.396.311.417.2]2.3 The DC-DC buck converter
FIGURE 2.9: Buck converter dc output the voltage V vs. duty cycle D.
Figure 2.9: Buck converter dc output the voltage V vs. duty cycle D. The buck converter circuit converts a higher dc input voltage to lower dc output voltage. The basic buck dc-dc converter topology is shown in figure. 2.10. It consists of a controlled switch Sw , an uncontrolled switch D (diode), an inductor L , a capacitor C
[image:19.595.115.524.610.739.2], and a load resistance R
(a) (b)
FIGURE 2.11: Buck converter circuit when switch: (a) turns on (b) turns off
FIGURE 2.12: Matlab/Simulink model of DC motor
2.4 Neural network
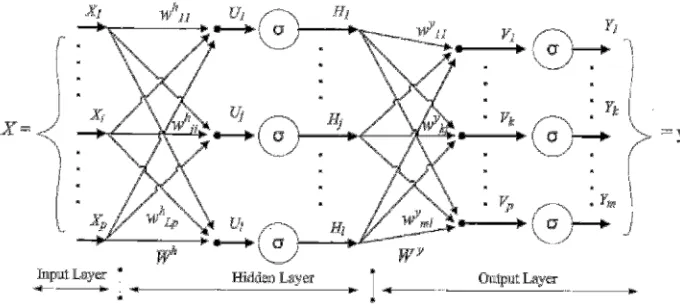
Figure 2.1 illustrates a Multilayer Perceptron Neural Network model. This network consists of an input layer (on the left) with three neurons, one hidden layer (in the middle) with three neurons and an output layer (on the right) with three neurons. Each layer has some neurons that are connected to the next layer through
[image:20.595.169.467.225.427.2]FIGURE 2.13: A perceptron network with three layers
Input layer is a vector of variable (x1....xp) that represented to the input. The input layer (or processing before the input layer) standardizes these values so that the range of each variable is -1 to +1. The input layer distributes the values to each of the neurons in the hidden layer. In addition to the predictor variables, there is constant input of 1.0, called the bias that fed to each of the hidden layers. The bias is multiplied by a weight and added to the sum going into the neuron. During hidden layer, the value from each input neuron is multiplied by a weight (wji), and the
resulting weighted values are added together producing a combined value uj. The weighted sum (uj) is fed into a transfer function, σ which outputs a value hj. The
outputs from hidden layer are distributed to the output layer.
Output layer occurred when the value from each hidden layer neuron is multiplied by a weight (wkj), and lastly the weighted values are added together producing a combined value vj. The weighted sum (vj) is converted into a transfer function, σ which output a value yk. The y values are the outputs of the network
2.5 DC motor
either interpoles or compensating winding. The fixed voltage Vf is applied to the field and the field current settles down to a constant value.
A linear model of a simple DC motor consists of a mechanical equation and electrical equation as determined in the following equations 3.1 and 3.2
.
∅ (2.1)
∅ (2.2)
Where
Ra = Armature Resistance (Q). La =Armature Inductance (H). Jm = Motor of inertia (kg.m 2/S2 ). K =Kb∅=Motor Constant (Nm / Amp).
K =Km∅ =Motor Constant (Nm I Amp).
b = Damping ration of mechanical system (Nms).
2.6 PID Controller
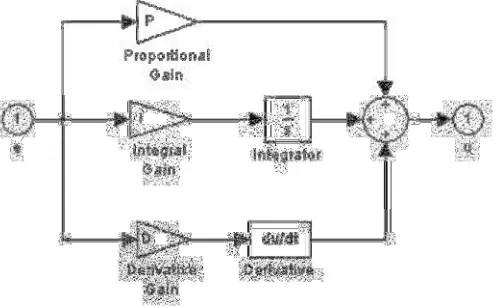
[image:22.595.196.444.550.704.2]Consider the characteristics parameters – proportional (P), integral (I), and derivative (D) controls, as applied to the diagram below in Fig.2, the system,
A PID controller is simple three-term controller. The letter P,I and D stand for P- Proportional, I- Integral, DDerivative. The transfer function of the most basic form of PID controller,is
(2.3)
(2.4)
Where
KP = Proportional gain, KI = Integral gain
KD= Derivative gain.
The control u from the controller to the plant is equal to the Proportional gain (KP) times the magnitude of the error plus the Integral gain (Ki) times the integral of the error plus the Derivative gain (Kd) times the derivative of the error.
! "# $ (2.5)
Due to its simplicity and excellent if not optimal performance in many applications, PID controllers are used in more than 95% of closed-loop industrial processes. We are most interested in four major characteristics of the closed-loop step response.
They are
a. Rise Time : the time it takes for the plant output Y to rise beyond 90% of
the desired level for the first time.
b. Overshoot : how much the peak level is higher than the steady state, normalized against the steady state.
c. Settling Time : the time it takes for the system to converge to its steady state. d. Steady-state Error : the difference between the steady-state output and the
CHAPTER 3
METHODOLOGY
3.1 Project Design
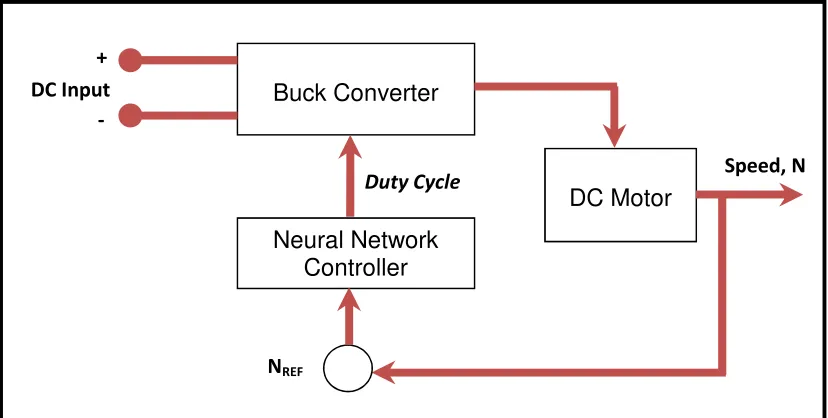
[image:24.595.116.530.480.689.2]The general proposed block diagram for this is is shown in Figure 3.1 and Figure 3.2 shows the overview of the project in flow chart.
FIGURE 3.1: Block Diagram For Propose DC-DC Buck Converter Using Neural Network Controller
Speed, N
Buck Converter
Neural Network Controller
DC Motor
DC Input +
-
NREF
The proposed design is using Neural Network Controller as a controller to controller speed to the desired speed. The performance of the controller is compared with the designed conventional controller which is Proportional-Integrated controller, PI. The NN controller used to control the duty cycle of the converter to ensure that
3.2 Proposed DC Motor
There were several papers such as Zulkifilie Ibrahim and Emil Levi (2002) and Teresa Orlowska-Kowalska (2001) had proposed the DC motor design using MATLAB/Simulink. The design DC motor is used to analyse of the system dynamics. But for this project, I have made the design made by Zulkifilie Ibrahim and Emil Levi as my reference due to the application of the motor which is quite the same.
[image:27.595.131.532.312.435.2]The dynamic model of the system is formed and Matlab Simulink blocks shown in Figure 3.1
FIGURE 3.3: Matlab model of DC motor
The input voltage of the motor is connected to the Buck converter to ensure that the motor runs at the desired speed control by the controller. The motor is connected to the fixed load. While the output of the motor is the desired speed, in rad/s. Due to the desired speed is in r.p.m, below equation is used to convert the speed in rad/s to speed,N in r.p.m.
(3.1)
The proposed project is to control the motor speed to 1600 rpm. The value of
motor parameter is based on the Muhammad H.Rashid (2004) and the P.Thepsatorn, A.Numsomran (2006) proposed parameter.
3.3 Proposed Proportional Integral Controller (PI)
[image:28.595.146.493.259.384.2]Proportional-Integral (PI) controllers [6, 14] are one of the most applicable controllers in different industries. The main important need in application of these controllers is their parameters tuning in order to gain desired result. So an accessible method with high accuracy and speed has to be used for determination of these control parameters (Kp, Ki). The control architecture used for PI controller is shown by Figure 3.2
FIGURE 3.4: Block diagram of PI controller
PI-controllers have been applied to control almost any process one could think of, from aerospace to motion control, from slow to fast systems. With changes in system dynamics and variation in operating points PI-controllers should be retuned on a regular basis.
%&#' (&#' *)+! &,'"&,'- . (3.2)
Where u(t) and e(t) denote the control and the error signals respectively, and KP and
Ti are the parameters to be tuned. The corresponding transfer function is given as,
The dynamic model of the system is formed and Matlab Simulink blocks shown in Figure 3.2
FIGURE 3.5: Matlab Simulink block
3.4 Proposed PID controller
[image:29.595.152.464.471.611.2]The design of the PI controller is as below where the value for gain was refers to the model proposed Muhammad H. Rashid (2004). The PID will only produce an output with the value range between 0 and 1. This is because the duty cycle range is from 0 to 1
3.5 Architecture of Neural Network Controller
Figure of input, hidden and output layer:
FIGURE 3.7: Architecture of Neural Network
3.6 Proposed Neural Network Controller
The forward calculations between input and hidden layer is
3 ∑;:<)567 ∙ 9: (3.4)
Where yi is the output between input and hidden layer neuron, while Wni is the connection weight from n-th neuron to i-th neuron and k is the number of previous layer neurons. Then, the activation is transfer to next layer neurons through a nonlinear transfer function as follow
= >&3'Yi (3.5)
The nonlinear transfer function used in this project is the following tan-sigmoidal function
Output layer is
G ∑ =&3; '. 5
<) (3.7)
Where Y(yi) is the output of previous layer neuron, while wi is the connection weight from i-th neuron and k is the number of previous layer neurons.
The activation function of the output layer is
I >&G' (3.8)
Where,
>&G' @)A$BCJ+? EF) (3.9)
The nonlinear transfer functions acts as the important rule in giving ANN nonlinear mapping property. ANNs have capability to obtain such as pattern recognition and any nonlinear function imitation by adjusting the connection weights appropriately.
The process is called the learning and error back propagation algorithm (BP algorithm) is generally use for the learning. BP algorithm is based on gradient descent method, i.e. connection weights are iteratively updated so the mean squared error EP to an input pattern p can decrease.
The updating weight parameters between input and hidden layer is
5: K6 1L 5: ∆5: (3.10)
∆5: η x R 5δe67 (3.11)
ST U VW+
SX+
U VW+ Y
SZX+
UX+ Y
S[+
U\&D+'Y
S[+
U[+ Y
ST
ST
U VW+ 9: Y =K1 &='
?L Y 5 Y &I I:' (3.13)
5: K6 1L 5: η9:= &1 =?'& 5 &I I:'' (3.14)
Where η represent the learning rate. The updating weight parameters between hidden layer and output layer is
5 K6 1L 5 ∆5 (3.15)
∆5 η &δ5δe
7' (3.16)
ST
SV+
S[+
S[+∙
S[+
S[+∙
ST
S[+ (3.17)
ST
SV+ = &1 = ' ∙ &I I:' (3.18)
5K6 1L 5 &η= &1 =''&I I:' (3.19)
Where η represent the learning rate. The mean square error Ep is calculated as
] )?∑ &^<) I I:' (3.20)
Where Zi is the desired output of the h-th neuron in output layer and Zn is the
corresponding actual output, respectively and m is the number of the output layer neurons.
FIGURE 3.8: NN block
FIGURE 3.9: Layer 1 block
[image:33.595.177.454.71.161.2]REFERENCES
[1] A. Giovanni Beccuti, Georgios Papafotiou and Manfred Morari, (2005) “Optimal control of the Boost dc-dc converter”. IEEE conference on decision and control
[2] Liu Qingfeng, Leng Zhaoxia, Sun Jinkun, Wang Huamin, (2011) “A composite PWM control strategy for Boost converter”. 2012 International conference.
[3] Fathi Shaban Jaber (2011) “Development of a Buck-Boost Converter Using Fuzzy Logic Control”. Degree of Master Thesis, UTHM
[4] Siti Hasmah Binti Jamali (2011) “Voltage Tracking of DC-DC Boost Converter Using Fuzzy Logic Controller”, Master Thesis UTHM
[5] Zulkiflilie Ibrahim and Emil Levi (2002)“A Comparative Analysis of Fuzzy Logic and PI Speed Control in High-Performance AC Drives Using Experimental Approach”, IEEE Transaction on Industry Application.
[6] B. Heber, L.Xu and Y.Tang “Fuzzy Logic enhanced speed control of an indirect field oriented induction motor drive”, IEEE Trans. Power Electron, vol.12, pp. 772-778, Sept 1997
[7] P.Thepsatorn, A. Numsomran, V. Tipsuwanporn, T.Teanthong (2006)”DC Motor Speed Control using Fuzzy Logic based on LabVIEW”. SICE-ICASE International Joint Conference 2006.
[8] Ramesh Chandra Chourasia, Mukesh Kumar (2013)”, Speed Control of S.E.D.C Motor by Using PI and Fuzzy Logic Controller. International Journal of Soft Computing and Engineering (IJSCE)
[9] H. Feshki Farahani (2011)“Designing and Implementation of a Fuzzy Controller for DC-DC Converters and Comparing With PI Digital Controller”. Islamic Azad University, Iran formerly [4]
[10] Muhammad H. Rashid (2004):”Power electronics Circuits, Devices and Applications” Electrical computer Engineering University of west Florida.
[11] Sinan Pravadalioglu (2005), “Single-chip fuzzy logic controller design and an application on a permanent magnet dc motor”. Engineering Application of Artificial Intelligence formerly [14]
[12] Yigang Shi and P.C Sen (2000) “A New Defuzzification Method for Fuzzy Control of Power Converters. IEEE members.
[14] Cetin Elmas, Omer Deperlioglu, Hassan Huseyin Sayan (2007),” Adaptive fuzzy logic controller for DC-DC converters”. Expert system with application. Formerly [11]
[15] Wing-Chi So, Chi K.Tse, Yim-Shu Lee (1996), “Development of a Fuzzy Logic
Controller for DC/DC Converter : Design, Computer Simulation and Experimental Evaluation. IEEE transaction on Power electronics formerly [12]
[16] K. Viswanathan, D. Srinivisan, R.Oruganti (2002),”A Universal Fuzzy
Controller for A Non-Linear Power Electronic Converter”. National University of Singapore. Formerly [13]
[17] Teresa Orlowska-Kowalska, Krzysztof Szabat, Krzysztof Jaszczak (2001) “The
Influence of parameter and structure of PI-Type fuzzy-logic controller on DC drive system dynamics”, Fuzzy set and systems
[18] C.K. Tse and K. M Adams (1992), “Quasilinear modelling and control of DC/DC Converters,” IEEE Trans. Power Electron
[19] V.S. C Raviraj and P.C. Sen, “Comparative Study of Proportional-Integral, Sliding Mode and Fuzzy Logic Controllers for Power Converters”. IEEE IAS Proceeding.
[20] K. Somsai, A. Oonsivilai, A. Srikaew & T. Kulworawanichpong,(2007),”Optimal PI Controller Design andSimulation of a static VAR Compensator Using MATLAB/SIMULINK”. International Conference on Power System.
[21] P.C Sen, (1990) “Electric Motor Drives and control – Past, Present, and future”. IEEE Trans on Inductrial Electronics, Vol37, No 6, formerly [6]
[22] Robert Babuska and Stefano Stramigiolo (1999)” Matlab and Simulink for Modeling and Control”, Delft University of Technology formerly [8]
[23] PID Control Tuning: A Short Tutorial, Retrieved June 22, 2013 from