International Journal of Emerging Technology and Advanced Engineering
Website: www.ijetae.com (ISSN 2250-2459, Volume 2, Issue 3, March 2012)260
Exploring the Forecasting Behaviour: Findings from
Indian SMEs
Biju Augustine
1, M Bhasi
2, G Madhu
31Biju Augustine, Associate Professor, Rajiv Gandhi Institute of Technology, Kottayam, India, PIN 686501
2M Bhasi, Professor, School of Management Studies, Cochin University of Science & Technology, Cochin, India
3G Madhu, Professor, School of Engineering,Cochin University of Science & Technology, Cochin, India
1
2[email protected] 3[email protected]
Abstract—We explored the link between firm performance and forecasting, demographics of the key person, standardization practices, effect of training, learning and IT usage. Empirical testing of a model formed is done by a questionnaire survey conducted among the selected Small and Medium Enterprises (SMEs) in India. Univariate tests indicate the significant influence of forecasting usage, type of forecasts, standardization, training and learning on SME performance. Combined influence on firm performance is analysed by means of a logistic regression model. Use of forecasting, standardization and learning orientation influenced the SME performance and take a role in classifying below and above performing firms. Less importance is given to training. Use of forecasting, standardization and training methods are to be improved. Features of above and below performers provide information to industry people. Conceptual and measurement models may give input to researches and may help to improve the existing models. This study is a particular one conducted in the Indian SME context.
Keywords— Use of forecasting, Standardization, Performance, Learning, Small and Medium Enterprises.
I. INTRODUCTION
In India, more than 90 percent of the industrial units belong to the small – scale sector and attribute 40 percent value addition and 6.5 percent contribution to the GDP [1]. Global competition compels the firms to make improvement in performance standards in terms of quality, quantity, cost and productivity. Performance measurement is needed to plan, control and act whenever necessitated [1]. Even though SMEs operate with less resources and managerial expertise they attract research attention due to the ease of management, flexibility in operations and more reactive response to market changes [2, 3]. Forecasting, planning and control have progressed very much in the last 30 years to satisfy the distinct needs raised by the industry.
Marketing oriented forecasts play an important role in the planning of production, finance and other corporate activities [4]. Forecast and PPC related areas were preferred by the large firms in the past but are being welcomed by SMEs of the present era.
II. OBJECTIVE AND ORGANIZATION OF ARTICLES
Research indicates that the aspects of SME’s key persons influence firm performance in a more significant manner than large firms [5, 3]. As a result of economic reforms and liberalisation, SMEs of India felt pressures due to the increased competition from the firms, which are kept away from approaching the domestic market. Operation of SMEs in the global economy seeks research attention [6]. Success of SMEs depends on the competencies of key persons, education level, risk taking, decision making style and emphasis given to strategic/operational planning [7, 8]. Importance given to forecasting by most of the SMEs is not much [9]. Forecasting provide the base for planning and in an extremely dynamic business environment, use of formal/strategic planning is a must. We have analysed the use of forecasting and firm performance in the SME context by means of an empirical study. A questionnaire survey instrument is developed and is administered among the firms in the form of a self reported schedule. Standard statistical tests are conducted to interpret the link between firm performance and the independent variables. We are of the opinion that the explanation of the knowledge gaps is beneficial to the small and medium manufacturing industry and economy.
III. LITERATURE REVIEW
A. Brief Outline of Forecasting Followed in Firms:
International Journal of Emerging Technology and Advanced Engineering
Website: www.ijetae.com (ISSN 2250-2459, Volume 2, Issue 3, March 2012)261 and business conditions. Because of increased competition and uncertainty, it is not easy to anticipate future requirements [10]. Attempts to develop advanced forecasting practices and algorithms are made to increase the accuracy of prediction, but are applied to the large firms. Many of the firms use convenience forecasting because of the lack of knowledge and resources [11]. Statistical methods are superior to judgmental methods in terms of accuracy and timeliness [12]. Judgmental methods use informal ways and are prone to bias and anchoring [13]. Readily accessible information channels are preferred because of the human tendency to follow the law of least effort [12]. Most of the studies on forecasting were done in the large firm context [9]. Smaller firms considered forecasting as less important and put less effort because of low operating volume, less competition and lack of knowledge and resources. Forecast errors are caused by internal sources such as price fluctuations, product quality, distribution system and promotion plan [14]. Mean Error (ME), mean square error (MSE), mean absolute error (MAE) and mean absolute deviation (MAD) are used by researchers for measuring precision [15].
B. Importance of Small and Medium Enterprises
Department of Trade and Industry (UK) define SME as the category of micro, small and medium sized enterprises employing fewer than 250 persons and annual turnover not exceeding 50 million Euros [16]. As per the Indian Micro, Small and Medium Enterprise Development Act [17], medium manufacturing enterprise is one with investment in plant and machinery between Rupees 50 to 100 million. Micro enterprise comes within investment limit of 2.5 million rupees and small enterprise investment limits between 2.5 and 50 million rupees. SMEs are rigid, inflexible, non-agile and non responsive to change and operates with limited customer base in competitive and turbulent markets [2] and are facing resource limitations [1]. Poor learning and training of workers and owner/managers result in poor business planning [1, 5]. To be successful in business, SME owners need to seek for models and be ready to invest in learning. Key success factors of SMEs include more involvement in operational decisions, long planning horizons, IT infrastructure, cultural dimensions, customer specific demand management and strategic use of forecasting planning and control [9].
IV. FRAMEWORK AND RESEARCH METHODOLOGY
A. Research Framework
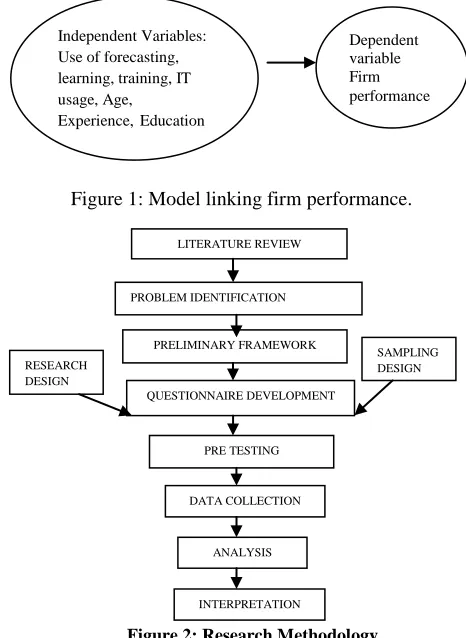
A model used in our study is shown in figure 1. Firm performance is selected as dependent variable. Independent variables include the use of forecasting, standardization, training orientation, learning orientation and demographic characteristics such as age, education and experience of the key person. Exploratory is planned after having literature
review of similar studies
.
Research methodology is shown in figure 2. [image:2.612.323.556.276.595.2]Figure 1: Model linking firm performance.
Figure 2: Research Methodology
Data is gathered by means of mailed questionnaire, those who wanted to clarify their, doubts, assistance is provided by enumerators. Parameters are reduced by Exploratory Factor Analysis. Distribution of the data is not linear and normal. So a logistic regression model is assumed to relate dependent and independent variables [18, 19].
IndependentVariables: Use of forecasting, learning, training, IT usage, Age,
Experience,Education
Dependent variable Firm performance
LITERATURE REVIEW
PROBLEM IDENTIFICATION
PRELIMINARY FRAMEWORK
QUESTIONNAIRE DEVELOPMENT
PRE TESTING
DATA COLLECTION
ANALYSIS
INTERPRETATION RESEARCH
DESIGN
International Journal of Emerging Technology and Advanced Engineering
Website: www.ijetae.com (ISSN 2250-2459, Volume 2, Issue 3, March 2012)262
B. Indicators used in the study
Firm performance is measured by the following six indicators: Sales performance - Sales performance is the drive for operating the firm. SMEs are operating by re circulating the money during the business cycle [8, 20], Growth plan by the firm- Growth orientation is considered as a measure of SME growth [21, 8], Target achievement- Target achievement and prompt delivery measures the firm’s ability to follow the production planning [22, 23], Profit levels met by the firm- Profit levels indicate the overall performance and stability [24,25], Delivery promptness [1], Lead time reduction- Small lead time implies the firm’s ability to plan and act [20]. All items are measured using a five point Likert’s scale [22, 8]. Overall firm performance is dichotomized into two groups - group 0 (below performing) and group 1 (above performing).
For measuring the use of forecasting, we used the instrument by Smith et al. [11] and Herbig et al. [4], consisting of seven indicators, namely simplicity, understandability, ease of use, comprehensiveness, effectiveness, timeliness and accuracy. An open question is used to indicate the practice of any type of standardization on dichotomous basis. Practice of Information Technology (IT) and Information System (IS) used is measured by using the questions for revealing ―number of computers used in the firm‖ [8], ―Level of computer proficiency of workers‖ [8, 9], ―Extend of use of computers/internet‖ [1, 8, 9] and ―Level of computer enabled control‖ [6, 8, 9]. Training orientation is explored using three indicators [1]. Learning orientation is explored by means three indicators [26, 27]. Demographics of SMEs such as Age, Experience (general as well as professional), Education level and decision making style were explored by means of Five point Likert’s scale. Age was measured from very young (25 to 30 years) to more than 60 years (old), with suitable increment. Educational level included school level (formal education) to professional qualification such as engineering degree and MBA in the high end. Beginners and pioneers were classified experience wise. Such classifications were common in SME research [8, 20, 21, and 9].
C. Data Collection
Data collection from small and medium firms is a problem due to the limitations of recording procedures followed in such firms. Quantitative data based on standard measures such as Return on Investment, Profitability Index, Leverage Ratio etc. are not applicable in the small firm context. Qualitative data in the form of self reported ratings are highly subjective, but are used whenever there is no other recorded data are available.
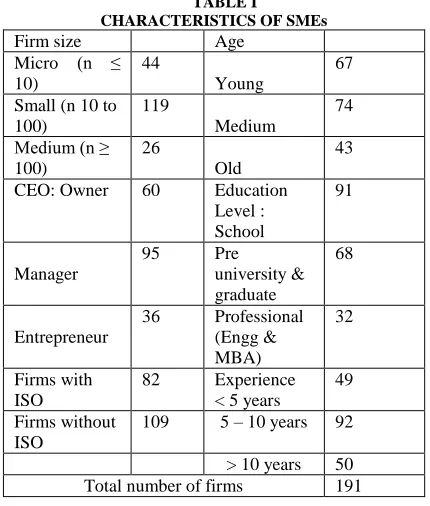
[image:3.612.337.552.335.588.2]Many small firm owners are reluctant to share the data or disclose the figures, which they keep as secret. SME related studies reported the applicability of self reported type questionnaire as a diagnostic tool [7, 8, 27, 26, 21, 9, 1, 22]. Pre testing is done by three numbers each of eminent experts from the university and industry. Sampling frame consisted of the SME data base provided by SME Association of Kerala State. A random sample is selected by means of statistical sampling procedure. Data collection by e-mail is not feasible because of the non familiarity with internet facilities by most of the SME people. After sending a letter describing the objective and features of the study, questionnaire was send by post. A response of 212 with a response rate of 27.3 is obtained. After screening and editing, 191 response forms are included for analysis. Data particulars are shown in table I.
TABLE I
CHARACTERISTICS OF SMEs
Firm size Age Micro (n ≤
10)
44 Young
67
Small (n 10 to 100)
119 Medium
74
Medium (n ≥ 100)
26 Old
43
CEO: Owner 60 Education Level : School
91
Manager
95 Pre university & graduate
68
Entrepreneur
36 Professional (Engg & MBA)
32
Firms with ISO
82 Experience < 5 years
49
Firms without ISO
109 5 – 10 years 92
> 10 years 50 Total number of firms 191
D. Hypotheses Formed
To test the worth of forecasting in SMEs, we formed the following hypotheses:
H1a: Firm performance is in no way influenced by the ―use of forecasting‖ by the firm.
H1b: Firm performance is in no way influenced by the type of forecasting followed.
International Journal of Emerging Technology and Advanced Engineering
Website: www.ijetae.com (ISSN 2250-2459, Volume 2, Issue 3, March 2012)263 H1d: ―Use of forecasting‖ is in no way influenced by the education of the key personnel.
H1e: There is no difference among the use of forecasting between ISO and non ISO firms.
We propose the following hypotheses to explore the use of standardization, training, learning and IT practices in SMEs.
H2: Standardization followed in the firm is not influencing the SME performance.
H3a: Firm performance is in no way influenced by the firm’s training orientation.
H3b: Firm performance is in no way influenced by the firm’s learning orientation.
H3c: Firm performance is in no way influenced by the IT practices followed in the firm.
V. DATA ANALYSIS AND DISCUSSION
A. Testing the validity and Reliability
Data has been reduced without much distortion by means of Exploratory Factor Analysis. Common factors are extracted with eigen values greater than 1, as per the principal component analysis. A varimax rotation is used to enhance the factor loadings within each common factor and a simplified factor structure is established. Content validity is ensured from the findings of other researchers in this field. Cronbach’s alpha is used to establish reliability of the data. Alpha values above .7 ensured construct validity and reliability [29].
All firm performance indicators were reduced into a single factor with adequate communality values. Values of item to item correlations nearing .3 indicate that the items are related each other (some degree of multicolliniarity of the lower end is desirable for factor analysis). Item to total correlation values are all significant and below .8 indicating no redundancy and items are measuring the firm performance. K-M-O criteria of sample adequacy (above .8) and Bartlett’s test of sphericity (significant at 5% level) are fulfilled. About 62% of the variability is explained by the single factor construct. With a control variable ―ownership type‖ (proprietary firms with sample size 96 and non proprietary firms with sample size 95 respectively) split factor analysis is conducted and similar pattern of interdependence is observed. Correlation between firm performance factor construct and its subset ―target achievement‖ is .734. Independent sample t test for testing the difference between factor construct scores and ―target achievement‖ (surrogate variable) scores indicated similar pattern and thereby establish convergent validity [30].
TABLE III A
RESULTS OF SPLIT FACTOR ANALYSIS –NONPROPRIETARY TYPE
FIRMS
Variable Factor 1 Usefulness
Factor 2 Ease of use
Simplicity -.035 .812b
Understandability .331 .736b
Ease of use .365 .615b
Effectiveness .751a .284
Comprehensiveness .782a .214
Timeliness .755a .038
Accuracy .779a .205
Eigen values 3.267 1.078
% variance 46.672 15.394
a variables grouped under ―Usefulness‖ b
variables grouped together ―Ease of use‖
TABLE IIII B
RESULTS OF SPLIT FACTOR ANALYSIS –PROPRIETARY TYPE FIRMS
Variable Factor 1 Usefulness
Factor 2 Ease of use
Simplicity -.035 .812b
Understandability .331 .736b
Ease of use .365 .615b
Effectiveness .751a .284
Comprehensiveness .782a .214
Timeliness .755a .038
Accuracy .779a .205
Eigen values 3.267 1.078
% variance 46.672 15.394
a variables grouped under ―Usefulness‖ b variables grouped together ―Ease of use‖
International Journal of Emerging Technology and Advanced Engineering
Website: www.ijetae.com (ISSN 2250-2459, Volume 2, Issue 3, March 2012)264 Almost similar pattern of loading is found in both cases (shown in TABLE IIA and TABLE II B respectively). Better loading pattern is observed in non proprietary type firms (firms that are run by professional managers other than owners). Education and professionalism are the anticipated reasons for the better loadings.
TABLE IVII
RELIABILITYANDSAMPLEADEQUACYOFDATA
Variable s
Indicator Comm unality
Item-total correla tion
Cronba ch's Alpha
Firm perform ance
Sales performance .758 .752 .784 Target achievement .827 .801 .738 Profit levels met by
the firm
.772 .764 .761
Delivery promptness .768 .759 .772 Lead time reduction .603 .625 .794
Use of forecasti ng
Simplicity .729 .547 .764
Understandability .745 .718 .746
Ease of use .639 .692 .752
Effectiveness .740 .798 .732
Comprehensiveness .654 .735 .735
Timeliness .583 .696 .748
Accuracy .602 .727 .747
IT usage
Use of computers in control
.833 .889 .886
Extend of use of computers
.812 .724 .912
Computer proficiency .723 .832 .898
Number of computers used
.812 .811 .873
B. Univariate Analysis
For testing the difference between firm performance and use of forecasting with suitable control variables, such as age, education, experience and standardization, it was planned to conduct ANOVA and Pierson Correlation tests. But such test necessitated the normality assumption. Kolmogorov-Smirnov test for normality is conducted and the results indicated significant variation from normality. Therefore we used Kruskal-Wallis chi square test (non parametric test) for testing the difference between samples [29, 30] and non parametric correlation test (Spearman correlation).
Nonparametric correlation is significant between ―use of forecasting‖ and firm performance (.556**) but Kruskal-Wallis chi square test did not indicate any significant difference in firm performance between groups with low forecast usage and high forecast usage.
Thus univariate analysis is insufficient to reject H1a. Kruskal-Wallis chi square test rejects the hypothesis H1b stating that the firm performance differs among the typology of forecasting used. Forecasting methods such as regression, moving average and exponential smoothing are found better compared to individual, salesmen and committee forecasting. Perceived use of forecasting is better reported by managers (mean 3.874) than conventional owners and entrepreneurs (mean 3.761 and 3.643). ANOVA test (F value 5.026**) reject the Hypothesis H1c and it is concluded that the use of forecasting differ among the SMEs run by owner/manager/entrepreneurs (ANOVA is used in this case, because the distribution of use of forecasting is normal). Results of ANOVA test is shown in TABLE IV.
TABLE VV
ANOVALINKINGUSEOFFORECASTINGWITHFIRM
PERFORMANCE
Use of forecasting
Mean SD F value Sig
Ownership: Owner
3.761 .47340
5.026 .008**
Manager 3.874 .46203 Entrepreneur 3.643 .42846
Less educated 3.7148 .48717 23.065 .002**
More educated 3.8740 .43310
ISO firms 3.7024 .43786 29.438 .000**
Non ISO firms 3.9575 .46384
Chi-square test indicated significant difference among the use of forecasting with the control variable ―key persons education‖. Hence Hypothesis H1d is rejected. Difference in the use of forecasting between ISO and non ISO firm rejects the hypothesis H1e. There is significant difference in firm performance between ISO and non ISO firms (χ2
value 61.152; p < 0.01). The hypothesis H3a is not rejected because χ2 test is not able to differentiate between firms with lower and higher training orientation (χ2
International Journal of Emerging Technology and Advanced Engineering
Website: www.ijetae.com (ISSN 2250-2459, Volume 2, Issue 3, March 2012)265 TABLE V
KRUSKAL-WALLISTESTRESULTS
Control variable Kruskal -Wallis Chi square
Signi fican ce
Inferenc e
Below and above level performers of ―Use of forecasting‖
2.698 .097 (NS)
H1a is accepted
Below and above level users of Standardization.
61.152 .000* *
H2 is rejected
Below and above level performers of ―Use of Training.‖
.496 .445 (NS)
H3a is accepted
Below and above level performers of ―Use of Learning‖.
39.101 .000* *
H3b is rejected
Below and above level performers of ―Use of IT Usage‖.
37.721 .000* *
H3c is rejected
Note: Kruskal –Wallis test is a non parametric test usually done with Likert scale data. Variables measured on Likert’s five-point scale (1 – low score; 5 high score; scores 3 and less were named as below level and more than 3 are above level); *: p<0.05; **: p<0.01.NS-Not significant
C. Multivariate Analysis
We analysed the combined effect of independent variables on SME performance using logistic regression [29, 30]. The Wald’s statistic evaluates the interrelations among the variables. The maximum likelihood ratio, Hosmer and Lemeshow measure, and classification table of predicted and observed figures are used to test the regression model. Pseudo R2 of Cox and Snell and the R2 of Nagelkerke are used to evaluate the overall fit (shown in table V).
We link the relation between firm performance (dependent variable) and independent variable as follows:
Ln (Pi/1-Pi) = β0+ β1.STi+ β2.FOi+ β3.LEi+ β4.TRi+ β5.ITi+ β6.AGi+ β7.EXi+ β8.EXi+εi
In this Logit model, Pi indicate the likelihood of classify in the correct group.
Logit employs a binomial probability function for the dichotomous dependent variable and estimates its chance of occurrence using an odds ratio (Pi/1-Pi). In Logit, we maximize the likelihood of correctly classified as better performers or getting benefited from the use of forecasting and other variables. Notations/symbols used for variables such as ST indicates standardization, FO means forecasting and so on.
TABLE VI
RESULTSOFLOGISTICREGRESSION
Independent
variables B SE Wald Sig. Exp
(B) Standardization .988 .361 14.318 .000 2.832 Use of
forecasting 1.637 .371 23.361 .000 4.784 Learning .944 .287 10.567 .002 2.631 Training usage -.415 .174 9.885 .002 .647 Constant -8.639 1.450 35.763 .000 .000
In a foreword LR models, stepwise inclusion of variables are followed. In Step 1, use of forecasting was entered; step 2 entered standardization; step 3 entered learning usage; step 4 entered training. Dependent variable is dichotomized as follows (Dummy): Firm performance; below performers = 0; above performers = 1. Logistic coefficients (B) were used to measure the changes in the ratio of probabilities, termed as odds ratio. Positive values of B increase the predictive probability. SE is the standard error. Wald is a statistic known as Wald statistic. Exp (B): exponent of B. Model fit is statistically assed by means of global fit measure of Hosmer and Lemeshow, in which the obtained value indicate the statistically significant difference between the observed and predicted classifications are not existing, because of the insignificant value of Chi square (Chi square :7.316, Sig: 0.542). A percentage of 69.4 found correctly classified. Pseudo R2 (percentage of phenomenon explained) by R2 of Cox and Snell, a value of 0.248 means 24.8 percent of the variability is explained by this model, R2 of Nagelkerke is 0.286 and -2 log likelihood is 136.457.
International Journal of Emerging Technology and Advanced Engineering
Website: www.ijetae.com (ISSN 2250-2459, Volume 2, Issue 3, March 2012)266 Negative relationships mean the SMEs do not use training as a competitive business strategy. SMEs consider training as important but there is a higher probability of usage of lesser amounts of training.
VI. CONCLUSION
With this exploratory study, we put forward an exploratory model to link firm performance with the influencing variables such as use of forecasting, standardization, learning, training and IT usage in the small firm context. It is observed that the use of forecasting, standardization and learning orientation influence the SME performance. The role of classifying below and above performing firms by means of the use of forecasting followed in the firm is explained. IT usage influences the firm performance to a significant extent as evident from univariate tests, but its role is not explained by logistic regression. SMEs can be benefitted from giving more importance to training methods. These findings agrees with the observations of Saini et al. [17] that the key persons of Indian SMEs act as informal and proceed without structured processes under the assumption that it will help them minimize cost and provide the necessary in – built flexibility in their operations. Lower scale of operation and focus on internal markets may be attributes for the less proactive nature of SME key personnel, but we have not covered such issues in our work. Significant difference in firm performance observed among ISO and non ISO firms. Standardization is taking place to a large extent, but the same is not being followed in majority of firms and it is important to create a positive awareness towards the necessity of standard procedures, knowledge acquisition and the benefits derived from it.
References
[1] Singh, R. K., Garg, S. K. and Deshmukh, S. G. (2010), ―Strategy development by small scale industries in India‖, Industrial
Management and Data Systems, Vol. 110, N0. 7, pp 1073 -93.
[2] Garengo, P. (2009), ―A performance measurement system for SMEs taking part in quality award programmes‖, Total Quality
Management, Vol. 20, N0. 1, pp. 91-105.
[3] Dangayach, G.S. and Deshmugh, S.G. (2001), ―Manufacturing strategy: literature review and some issues‖, International Journal of
Operations and Production Management, Vol. 21, No. 7, pp.
884-932.
[4] Herbig, P, Milewicz, J. and Golden, E., J, ―Differences in forecasting behaviour between industrial product firms and consumer product firms‖, Journal of Business and Industrial Marketing, Vol 9, No 1, 1994.
[5] Pansiri, J. and Temtime, Z. T. (2008), ―Assessing managerial skills in SMEs for capacity building‖, Journal of Management
Development, Vol. 27, No. 2, pp. 251-60.
[6] Todd, P. R. and Javalgi, R. G. (2007), ―Internationalization of SMEs in India‖. International Journal of Emerging Markets. Vol. 2, No. 2 pp. 166-180.
[7] Karami, A., Analoui, F. and Kakabadse, N.K. (2006), ―The CEOs characteristics and strategy development in UK SME sector‖,
Journal of Management Development, Vol. 25 No. 4 pp. 316 – 324.
[8] Bhutta, M.K., Rana, A.I. and Asad, U. (2008), ― Owner characteristics and health of SMEs in Pakistan, ― Journal of Small
Business and Enterprise Development, Vol. 15, No. 1, pp. 130-149.
[9] Sharma, M.K. and Bhagwat, R. (2006), ―Practice of Information Systems: evidence from Indian SMEs‖, Journal of Manufacturing
Technology Management, Vol. 17, No.7.
[10]Wacker, J.G. and Sprague, L.G. (1995), ―The impact of institutional factors on forecasting accuracy‖, International Journal of
Production Research, Vol. 33, No. 11, pp. 2945-58.
[11]Smith, H., Paul, H. and John, M. (1996), ―Differences in forecasting behaviour between large and small firms‖, Journal of Marketing Practice, Vol. 2, No. 1. pp. 35-51.
[12]Sanders, N.R. (1995), ―Managing the forecasting function‖,
Industrial Management and Data Systems, Vol. 95, No. 4. Pp. 12-18.
[13]Sniezek, J. (1989), ―An examination of group process in judgmental forecasting‖, International Journal of Forecasting, Vol.5, No.2, pp 171-8.
[14]Chalmbers, J.C., Mullick, S.K. and Smith, D.D. (1971), ―How to choose the right forecasting technique‖, Harward Business Review, July – August.
[15]Downing, M., Chipulu, M., Ojiako, U and Kaparis, D (2011), ―Forecasting in airforce supply chains‖, The International Journal of
Logistics Management, Vol. 22, No. 1, pp 127-144.
[16]Koh, S.C.L., and Maguire, S, (2004) ―Adoption of e-business and knowledge management within SMEs‖, Journal of Small Business and Enterprise Development, Vol 2, No 3, pp 338-348.
[17] Saini, D. S. (2008), ―Managing the human resources in Indian SMEs‖, Journal of World Business, 43, 2008, pp 417-434.
[18]Hair, J. F., Black, W.C., Babin, B., J., Anderson, R., E., and Tatham, R., L. (2011), ―Multivariate Data Analysis‖, 6th
Edition, Pearson Education, Delhi.
[19]Perez, D.G. and Durendez, A. (2007), ―Managerial behaviour of small and medium – sized family businesses: an empirical study‖,
International Journal of Entrepreneurial Behaviour and Research,
Vol. 13, No 3. Pp. 151-172.
[20]Daily, C.M. and Dollinger, M.J. (1992), ―An empirical examination of ownership structure in family and professionally managed firms‖,
Family Business Review, Vol. 5, No. 2 pp. 11-34.
[21]Boohene, R., Sheridan, A. and Kotey, B. (2008), ―Gender, personal values, strategies and small firm performance‖, Equal Opportunities
International, Vol. 27, No. 3 pp. 237-257.
[22]Rosa, P. and Carter, S. (1996), ―Gender as a determinant of small firm performance: insights from a British study‖, Small Business
Economics, Vol. 8 pp. 463-478.
International Journal of Emerging Technology and Advanced Engineering
Website: www.ijetae.com (ISSN 2250-2459, Volume 2, Issue 3, March 2012)267
[24]Sadler, Smith, E, Spicer D P and Chaston, I. (2001), ―Learning orientations and growth in small firms‖, Long Range Planning, Vol. 34, No. 2, pp. 139-58.
[25]Wiklund, J. and Shephered, D. (2005), ―Entrepreneurial orientation and small business performance: a configurational approach‖,
Journal of Business Venturing, Vol. 20, No. 1 pp. 71-91.
[26]Keskin, H, (2006), ―Market orientation, learning orientation and innovation capabilities in SMEs- an extended model‖, European
Journal of Innovation Management, Vol. 9, No. 4, pp. 396 – 417.
[27]Anderson, V. and Boocock, G. (2002), ―Small firms and internationalization: learning to manage and managing to learn‖,
Human Resources Management Journal, Vol. 12, pp. 5-24.
[28]O’ Regan, N. and Ghobadian, A. (2002), ―Effective strategic planning in SMEs‖, Management Decision, 40/7 pp. 663 - 671 63.
[29]SPSS for Windows (2008): Darren George, Pearson Education, New Delhi.