Geosciences Theses Department of Geosciences
8-11-2015
Cartography for Communities: An Examination of
Participatory Action Mapping
Amber J. Boll
Follow this and additional works at:https://scholarworks.gsu.edu/geosciences_theses
This Thesis is brought to you for free and open access by the Department of Geosciences at ScholarWorks @ Georgia State University. It has been accepted for inclusion in Geosciences Theses by an authorized administrator of ScholarWorks @ Georgia State University. For more information, please [email protected].
Recommended Citation
Boll, Amber J., "Cartography for Communities: An Examination of Participatory Action Mapping." Thesis, Georgia State University, 2015.
by
AMBER J. BOLL
Under the Direction of Katherine B. Hankins
ABSTRACT
Participatory Action Mapping (PAM) as a methodology strives to fill the gaps created by
participatory and critical mapping methodologies. Public participatory GIS (PPGIS), which often
fails to elicit a bottom up approach to mapping, and community mapping, which typically
produces critical mappings that often fail to be taken seriously by decision makers both fall short
in offering members of the public meaningful opportunities to make claims about particular
places. Through the implementation of a critical mapping methodology that utilizes professional
cartography techniques, PAM offers community organizations the ability to assert their claims
through maps. Using a critical cartography lens, this case study focuses on PAM with a
community-based organization in west Atlanta and reveals how this methodology can be
successful in engaging professional mapping practices to communicate the truths of, and
subsequently inspire action among, community members.
by
AMBER J. BOLL
A Thesis Submitted in Partial Fulfillment of the Requirements for the Degree of
Master of Science
in the College of Arts and Sciences
Georgia State University
Copyright by Amber Jeanette Boll
by
AMBER J. BOLL
Committee Chair: Katherine B. Hankins
Committee: Daniel M. Deocampo
Andy Walter
Electronic Version Approved:
Office of Graduate Studies
College of Arts and Sciences
Georgia State University
DEDICATION
To Damien, whose world spins at a speed and degree of tilt that is complementary to mine. I
ACKNOWLEDGEMENTS
Anyone who knows my story understands that this ride of mine has been one filled with
wonderfully challenging twists and turns. As such I have many people to thanks for being on the
ride with me. First and foremost to my advisor, Dr. Katherine Hankins, who kept me afloat when
I was certain my only option was to sink. Also, my committee members, Dr. Andy Walter and
Dr. Daniel Deocampo, provided thoughtful feedback to my work. I appreciate the support and
guidance from you both. I extend the biggest of thanks to the members and leaders of the
Westside Atlanta Land Trust. Thank you for trusting me. Bit by bit, you all have the ability to
change the world.
On a more personal note, I’d like to thank my mom, Carmen, for indulging me in my
desire to make this journey to Atlanta. The big city isn’t so awful after all. I hope I can continue
to produce moments that make you proud. Another thank you goes out to my father, Jeff, who
has been supportive in many ways throughout the years and to my sister, Cassie, who is doing
incredible work in the world and allows me to share the journey with her. Of course the list
could go on and on, so I’ll just suffice to extent one giant blanket thank you to the rest of my
family who has supported me through this work.
To my dearest friend, Rose, who validates me every day, I cannot thank you enough for
all the good energy you’ve sent my way, all the adventures you’ve shared with me, and all the
time you’ve committed to helping review my work. You are my favorite. And lastly, to my
fiancé, Damien, how lucky I am to have not had my calculator that day in GIS lab. You and me,
TABLE OF CONTENTS
ACKNOWLEDGEMENTS ... vi
LIST OF TABLES ... x
LIST OF FIGURES ... xi
1 INTRODUCTION ... 1
2 CONCEPTUAL FRAMEWORK ... 3
2.1 Geography and Mapping ... 3
2.1.1 What is a map? ... 4
2.2 The Rise of the “Scientific” Map ... 6
2.3 Public Participatory GIS ... 8
2.3.1 Academic PPGIS Programs... 10
2.4 Critical Cartography... 11
2.4.1 Power Relations... 12
2.5 Critical mappings ... 18
2.5.1 Community Mapping as Critical Mapping ... 20
2.5.2 Parish Map ... 21
2.5.3 The Green Map ... 22
2.6 Participatory Action Research ... 23
2.7 Participatory Action Mapping ... 24
3.1 Case Study ... 29
3.2 Establishing the Partnership ... 30
3.2.1 Study Site ... 31
3.3 Observation ... 31
3.3.1 Direct Observation ... 31
3.3.2 Participant Observation ... 32
3.4 Interviews ... 33
3.5 Researcher Subjectivity ... 34
4 RESULTS ... 35
4.1 WALT Maps and Mappings ... 35
4.2 WALT and Key Elements of PAM ... 39
4.3 Naturalized Coding through PAM ... 40
4.4 Creating Truths through PAM ... 46
4.5 PAM and Inspiring Action ... 49
4.6 PAM as Critical Mapping ... 52
4.7 Additional Reflections of PAM for WALT ... 57
5 CONCLUSIONS ... 58
NOTES ... 60
REFERENCES ... 61
Appendix A: Interview Participants ... 65
Appendix B: WALT Maps and Mappings ... 66
Appendix C: Collector for ArcGIS Application ... 71
Appendix D: Interview Questions ... 72
LIST OF TABLES
LIST OF FIGURES
Figure 1. What makes a map a map? ... 5
Figure 2. Art maps challenge professional cartography... 19
Figure 3 Participatory Action Mapping ... 25
Figure 4 Map Showing Neighborhood Planning Units of Atlanta ... 28
1 INTRODUCTION
In recent decades, scholars writing in the critical cartography literature have argued that
maps and mapping are results of power-knowledge relationships, wherein uneven power
relations are embedded in how maps are made (and by whom) and how they are read or
understood (Harley 1989). Critical mapping practices, meaning the production of maps by
non-professionals, attempts to expose and uproot top down power-knowledge relationships and put
the power of the map into the hands of the public. A popular form of critical mapping practice is
community mapping. Community mapping occurs when a map is produced, “...by a particular
local, often featuring local knowledge and resources” (Parker 2006, 23 emphasis added).
Even with the increasing frequency of members of the public participating in map
production, however, professionally produced maps continue to wield their power in formal
decision-making processes, such as in municipal planning and policy-making. While
non-professionally produced maps may indeed go viral on social media or make a stately wall
decoration at the local community center, often they have limited ability to represent the interests
of community members in important decision-making arenas. For example, a quick glance at the
maps and data provided on the website of the Atlanta Regional Commission, a regional planning
and policy making body of the metropolitan Atlanta region, make it clear that
community-produced data and representations are not often incorporated into official decision-making
conversations that can have a real impact on the communities in question.
While community-created maps continue to be undervalued in decision making
discussions, a remedy could include allowing a trained cartographer to perform the mapping on
behalf of the community. In recent decades, scholars have developed public participatory
public into professionally-produced maps and mappings (Sieber 2006). PPGIS, as it is currently
practiced in most universities and nonprofit organizations, however, continues to work from a
top down structure and often only engages the public to assist in the data collection process to
answer a previously determined research question. As such, PPGIS is often not effective in
addressing questions asked by the community. Participatory action mapping (PAM) is a mapping
methodology that attempts to fill the gap that exists between PPGIS and community mapping.
By partnering members of the community with academic cartographers, PAM provides
communities the opportunity to decide what should be mapped, participate in the mapping
process, and produce professional maps, which have the potential to challenge the kinds of
spatial representations made by professionals in policy-making bodies and organizations such as
the Atlanta Regional Commission.
This thesis examines the ways in which PAM fulfills or challenges critical cartography’s
approach to maps and mapping with the goal of establishing a methodology that is as critical as it
is effective. Critical cartography conceptualizes maps and mapping to occur within what I
identify as three pillars of power: 1) naturalized codes, 2) constructions of truth(s), and 3)
inspiration for action. In what follows, I explore these tenets of critical cartography and apply
them to my own mapping experience with a community-based organization. This case study of
mappings completed with the Westside Atlanta Land Trust (WALT) reveals that PAM has the
potential to code spatial claims through the cartographic principles taught to university students,
can create truths for both outsiders to the community and to those living within the community
being mapped, and inspires action for both the community-based organization’s members and
methodology that is both practical and theoretical, could contribute to best (or better) practices in
community mapping in addition to informing the critical cartography literature.
2 CONCEPTUAL FRAMEWORK
The purpose of this case study is to explore the effectiveness of participatory action
mapping (PAM) as a methodology for providing community organizations an avenue to engage
in critical mapping practices that have the ability to influence decision-making processes. As
such, it is crucial to examine the literatures of public participatory geographic information
systems (PPGIS) and community mapping, two mapping approaches most closely connected to
PAM, to gain an intricate understanding of the current boundaries of their approaches in addition
to the results they have elicited from practice. This examination is couched in a discussion
around the many shifts mapping methods have taken over time and the arguments advanced by
scholars of critical cartography. Lastly, I examine literature from participatory action research
(PAR), which provides the overarching framework from which PAM draws.
2.1 Geography and Mapping
Eckert in his 1908 publication, “On the Nature of Maps and Map Logic”, begins his
writing with the following three quotations: “Maps are the basis of geography…”; “Maps
represent the deposit of geographic knowledge for any given period…”; and “Maps are the
indispensable tools and implements of geography and geographic teaching,” (Eckert and Joerg
1908, 344). These quotations, he explains to readers, are the affirmations of prominent
geographers of the time (though he fails to provide their names). Taking Eckert’s claims as
emblematic of the time, it is clear that to early scholars in geography, maps and mapping were
goes as far as to question readers if they could ever fathom geography without maps, as he views
the relationship between the two to be “indivisible.” Today, despite the significant shifts that
have occurred in mapping methods and the incorporation of maps into other disciplines, a strong
association between geographers and maps remains, as maps continue to be the “primary
language” for geographical expression (Borchert 1987). While geographic thinking is so
strongly correlated with maps, however, it remains a challenge to apply a single definition about
what makes a spatial representation a map.
2.1.1 What is a map?
The term “map” is one that is often taken for granted, rarely provoking anyone to pause and
think about its meaning. The term is gracefully applied to broad range of applications while
somehow managing to avoid mass confusion. If one does pause a moment to think about how
one would describe what a map is, it becomes clear very quickly the discrepancies that emerge.
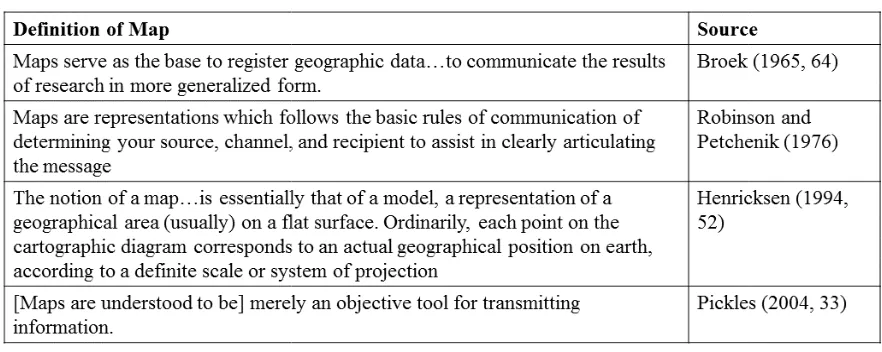
One may say that a map is “a representation of the earth’s surface.” While this may hold true,
how does this definition distinguish a map from a photograph or painting of a landscape
(Crampton 2010)? To highlight this conceptualization of a map, I offer the images below offer
different depictions of Grand Canyon Village. Which of these images would be appropriately
Figure 1. What makes a map a map?
Top Left: http://www.nps.gov/grca/planyourvisit/arch_day.htm
Top Right: https://www.google.com/maps/place/36%C2%B003'28.7%22N+112%C2%B006'42.5%22W/@36.055821,-112.1215718,1889m/data=!3m1!1e3!4m2!3m1!1s0x0:0x0
Bottom Left: http://grandcanyonhistory.clas.asu.edu/history_whoownsgrandcanyon.html Bottom Right: http://www.panoramio.com/photo/2456481?source=wapi&referrer=kh.google.com
Crampton (2010, 43) insists that “if we want to answer the question of what a map is then we
must begin by acknowledging that it is a culturally learned knowledge” and goes on to argue that
only through the submersion in a certain society at a particular point in time can there be any
degree of agreement on what a map is (Wood 2010). The table below highlights how
discrepancies have existed among researchers, cartographers, and geographers even during the
past 50 years, as the prominent viewpoints on maps has largely positioned them as scientific
Table 1. Definition of a Map
2.2 The Rise of the “Scientific” Map
The perspective of the “scientific” map emerged due to the professionalization of
cartography (Pickles 2004). This process of professionalization consists of a transition of
mapping from being viewed as just a skillset to becoming an entire professional field that took
place within academia following WWII
were developed and employed in the execution of w
Robinson, who developed what became a prominent map projection that bears his name, is
sometimes referred to as the “dean of modern cartography”
of the Map Division for the Office of Strategic Services
the decisions of those who orchestrated the war. Robinson naturally emerged as a figurehead in
the world of mapping and used his prominence to put ou
design (A. Robinson 1979), positioning maps as merely a medium of
He inadvertently worked to distance cartography from the
surrounding design by advocating for the prioritization of the functionality of maps through
The Rise of the “Scientific” Map
perspective of the “scientific” map emerged due to the professionalization of
This process of professionalization consists of a transition of
mapping from being viewed as just a skillset to becoming an entire professional field that took
place within academia following WWII (Crampton and Krygier 2006). During the war, maps
were developed and employed in the execution of wartime tactics (Crampton 2001)
, who developed what became a prominent map projection that bears his name, is
ferred to as the “dean of modern cartography” (Montello 2002), worked as a Chief
of the Map Division for the Office of Strategic Services during the war, and his maps informed
who orchestrated the war. Robinson naturally emerged as a figurehead in
the world of mapping and used his prominence to put out a call for a scientific approach
, positioning maps as merely a medium of (scientific)
to distance cartography from the creative and artistic dimensions
design by advocating for the prioritization of the functionality of maps through perspective of the “scientific” map emerged due to the professionalization of
This process of professionalization consists of a transition of
mapping from being viewed as just a skillset to becoming an entire professional field that took
. During the war, maps
(Crampton 2001). Arthur
, who developed what became a prominent map projection that bears his name, is
, worked as a Chief
during the war, and his maps informed
who orchestrated the war. Robinson naturally emerged as a figurehead in
scientific approach to map
(scientific) communication.
dimensions
strict, scientifically-produced guidelines, and claimed that aesthetics were secondary (Crampton
2010).
Additionally, Robinson introduced the Map Communication Model (MCM) to mapping
practices. The MCM, like other communication models, outlines the ways in which information
is transferred between source and user, providing a feedback loop for cartographers to anticipate
the ways in which their products will be interpreted. The model, over time, became a frequently
practiced method in cartography and translated well into technology-based mapping methods
(Crampton 2010).
The introduction of Geographic Information Systems (GIS), or a computer system that
analyzes and visualizes geographic data, intensified the argument that mapping is a scientific
method (Downs 1997). GIS emerged in the practice of mapping in the 1960s and offered
cartographers the ability to layer information, perform analyses, and uncover patterns with the
push of a button that would have taken a great deal of time to complete through past methods
(Coppock and Rhind 1991). While GIS gained in popularity through use for military purposes
(Pickles 2004), the new range of abilities introduced by GIS to all map makers shifted the
understanding of maps into being, “… geographer’s instrument of scientific discovery… it is a
means of bringing the impossibly large within the bounds of human vision and therefore
knowledge” [emphasis added] (Downs 1997, 113), increasing the scientific positionality
believed to be held by maps. As GIS continued to gain prominence, academics became critical of
the ways in which GIS was making an impact on society. From these critiques emerged the
2.3 Public Participatory GIS
Public Participation GIS (PPGIS) emerged as a practice that sought to make GIS more
accessible to the public (Sieber 2006). Through its inclusionary model, PPGIS attempts to
alleviate the accusations made toward GIS for being process that alienates, or makes “other” the
population being studied with GIS methods (Craig, Harris, and Weiner 2002; Sieber 2006).
Elwood (2006, 696) outlines the practice that emerged to “intervene” in these alienating GIS
technologies in three ways: 1) including an increase in diversity of participants in GIS research
2) expanding both the types of spatial knowledge a GIS can include (such as pictures, drawings,
and audio files) and its accessibility (for example, through online access platforms) and 3)
re-designing the software/databases of GIS to incorporate social characteristics when representing
and analyzing spatial data (to include cultural context and information capturing concepts that
are difficult to measure, such as emotion). Sieber (2006, 503) discusses the potential social
impacts of PPGIS by arguing, “PPGIS provides a unique approach for engaging the public in
decision making through its goal to incorporate local knowledge, integrate and contextualize
complex spatial information, allow participants to dynamically interact with input, analyze
alternatives, and empower individuals and groups.” While there are opportunities for granting
members of the public opportunity to participate or inform decision making, possibly going as
far as empowering individuals or groups, the main premise of PPGIS is using the knowledge of
the public to inform GIS research.
For PPGIS projects to be successful, the participants and roles of each participant need to
be clearly defined early on (Tulloch 2008). A clear definition of appropriate roles allows
researchers, community leaders, and participants to take the first step towards understanding the
remains a very flexible term, offering definitions such as “all affected stakeholders” (Schlossberg
and Shuford 2005,15). Freeman (1984, 46) defines the public as “any group or individual who
can affect or is affected by the achievement of the organization’s objectives.” It is clear that “the
public” can be positioned to refer to a wide range of differing groups of people, creating
opportunities for processes of inclusion and exclusion in PPGIS exercises. For instance,
geographers Eden and Bear (2012), who focus on the intersections between the public and the
environment, categorize the public as general or specialized. The general public is any person or
group of people, while a specialized public denotes a group of people that has a particular
knowledge concerning an issue. PPGIS practitioners Schlossberg and Shuford (2005) divide the
public into three categories: those affected by a decision, those bringing knowledge to a decision,
and those who have power to affect a decision or the implementation of a decision or project.
Once the “public” has been defined for a project, one must then decide how and what role
this defined public is expected to have, or how engaged it should be. Inclusion can be acted out
in a number of different ways, ranging from participation in the formulation of the research
question to being solicited for data collection or data visualization preferences (Elwood 2006). In
some instances, the public may determine the purpose, goals, and outcomes of the project
(Schlossberg and Shuford 2005)1. In other projects, the purpose and goals of the research may
also determine the “public” needed for a project. The adaptability of PPGIS methods makes
PPGIS applicable to a wide range of projects. This same conceptual flexibility has also created
challenges in establishing structured methods for project achievement that could be performed on
large scales. Despite the lack of rigid structure through which to implement such projects,
academics have remained committed to the PPGIS model in efforts increase GIS accessibility in
2.3.1 Academic PPGIS Programs
There are number of academic institutions that have created localized mapping programs
with the inclusionary PPGIS model as the foundational approach. These programs have been
established on the premise of increasing access to GIS in their cities/regions. For example, the
Syracuse Community Geography program engages the residents of the greater Syracuse area in
the participation of knowledge production through the use of GIS (J. Robinson 2010). Since the
inception of the program in 2003, Syracuse Community Geography, under the direction of Dr.
Jonnell Robinson, has been working alongside community members, offering services of GIS in
efforts to effect positive change throughout the area. Some projects completed through the
program are an examination of housing demolition completed with the City of Syracuse Bureau
of Planning and Sustainability, A Safe Routes to School map completed with the Outer
Comstock Neighborhood Association and area schools, and a geographic analysis of urban
forestry efforts completed with Cornell University Cooperative Extension of Onondaga County.
A similar model has been introduced in Atlanta at Georgia State University. Though in its
beginning stages of development, the Atlanta Community Mapping and Research Center
(ACMRC) specifically works towards including “disenfranchised” individuals and communities
in the research process. Examples of projects completed by the ACMRC include a canvassing of
invasive species in urban parks completed with the Atlanta Botanical Gardens and an
examination of food deserts in the Bankhead neighborhood completed with The Atlanta Mobile
Market. Both Syracuse Community Geography and the ACMRC are highly dependent on Esri’s
ArcGIS for the creation of maps and analysis for their community mapping partners.
Programs such as these are focused on processes of inclusion; this refers to establishing
skilled students to participate in GIS projects, partnering students with the community-based
organizations and allowing students to work with the organizations to attempt to meet their
mapping needs. While these processes are vital to the success of such partnerships, it must be
recognized that it is the maps produced through the partnership that exist regardless of the
processes through which the partnership is established or maintained. The maps will continue to
work, communicating claims about a particular area long after the student-organization or
community-university partnerships conclude. By focusing on the processes of inclusion, these
methods can be ambiguous about the maps they create.
One aspect that is nearly constant among all PPGIS projects is that while they do include
the public, or members of community-based organizations, in acts of data collection or
validation, they do not typically consult those members of the public for their perspectives on
what should be mapped in the first place (Perkins 2007). This means that while the data are
collaboratively curated with members of the public using GIS, control over the map and the
message it presents often times remains out of the hands of community members. At the opposite
end of the spectrum is community mapping, a type of critical mapping and a method in which
non-experts are in complete control in the development of maps. While many scholars and
practitioners of PPGIS celebrate PPGIS’s inclusivity, it is clear that, especially when contrasted
with community mapping, PPGIS is more “top down” than it is “bottom up.” Before I discuss
critical mappings in any more detail, I provide the method a more robust framework of reference
by examining in detail the works of scholars of critical cartography.
2.4 Critical Cartography
This social critique of maps began when Brian Harley posed the question, “what type of
rules, according to Wood (2010, 120), are about “...trying to lay bare, understand, and question
the presumptions of professional cartography.” Through his own examination, Harley
determines, “...an alternative epistemology, rooted in social theory rather than in scientific
positivism” (Harley 1989, 3), would be a more appropriate lens through which to view maps.
Academics and critics such as Denis Wood, John Fels, John Pickles, and Jeremy Crampton all
heed Harley’s call for the creation of a cartography grounded in social theory and have led the
development of an approach that has become known as “critical cartography.” Critical
cartographers take head on the task of exposing the “epistemological myths” about the
knowledge production of mapping practices that are typically opaque and largely created by
professional cartographers, who explicitly or implicitly adopted the “scientific” approach to
map-making.
2.4.1 Power Relations
The cornerstone of critical cartography is the assertion that power relations are always
present within the creation and utilization of maps. For example, Crampton (2010, 41) argues
that “Critical cartography… conceives of mapping as embedded in specific relations of power….
in what we chose to represent, how we choose to represent objects such as people and things, and
what decisions are made with those representations.” It is the individuals and regimes in
positions of power that get to choose what and how the map represents a particular aspect of a
place. Crampton (2010) and others draw from Foucault’s concept of power-knowledge.
Power-knowledge is a concept that focuses on how a powerful minority is able to,
“…impose [its] idea of right, or the truth, on the majority” (Fillingham 1993, 6). Essentially,
those who maintain power in a given social hierarchy are those who define truth for the rest. As
occurred, maps and mapping have become methods through which an idea of “right” can be both
established and reinforced. For example, countries can make significant statements by producing
maps that omit, and thereby ignore the existence of, the boundaries of a country. The map
declares and fortifies this viewpoint as a way to indoctrinate its readers into taking a stance that
the omitted country should indeed not be recognized as a country. Harley highlights how maps
are a type of discourse through which power structures are reflected and reinforced:
The key to this... power is thus cartographic process. By this I mean the way maps are compiled and the categories of information selected; the way they are generalized, a set of rules for the abstraction of the landscape; the way the elements in the landscape are formed into hierarchies; and the way various rhetorical styles that also reproduce power are employed to represent the landscape. To catalogue the world is to appropriate it, so that all these technical processes represent acts of control over its image…. the world is disciplined. The world is normalized. We are prisoners in its spatial matrix. For
cartography as much as other forms of knowledge, all social action flows through boundaries determined by classification schemes (Harley 1989, 13).
The key here is that the cartographers are the ones in positions of power who are doing the
cataloguing and classifying. As such, they are the ones who create the lens through which the
rest can view the world.
2.4.1.1 Pillars of Power
As maps have wielded power during certain eras and in particular places, I identify three
main pillars that represent the elements of power-knowledge that maps embody. These three
pillars include the process of coding maps and their naturalization; the creation of truth(s); and
the inspiration of action. While each pillar is connected to the others, I see them as important
2.4.1.2 Naturalization through Coding
The concept that maps serve as mirrors of the “real world” is a result of naturalization.
Naturalization has occurred when the map is believed to represent neutrally what exists in the
world, nothing more and nothing less, completely ignoring the social perspective and field of
power through which maps are created (Wood 2010; Crampton 2010; Pickles 2004). Pickles
offers a nice explanation of naturalization:
The myth of the dispassionate neutrality of the map hides the socially constructed nature of the image. In this view, the map is a transparent object that reflects like a mirror that which is real: the map is the ‘mirror of nature’ in which the real is represented
transparently as objective neutral and accurate. (Pickles 2004, 61)
A brief example of naturalization is offered through the way in which the International
Cartographic Association’s defines the map as “…a graphic representation of a space” (ICA
2014). This definition expresses that the data a map displays already exist in the world and the
map is serving only as a mirror to that data.
Pickles goes on to describe that, “Maps work by naturalizing themselves by reproducing
a particular sign system and at the same time treating the sign system as a natural and given”
(Pickles 2004, 60-61). This reproduction of a sign system is referred to as the process of coding.
Coding assigns a socialized correlation between a signifier and a signified to produce a sign. A
signifier is the physical object or action that occurs, while the signified is the meaning that the
signifier conveys. A non-map example of coding is provided by a fire truck and a pulled over
car. The lights and sound of the sirens alone do not hold any meaning; however through the
process of coding, a socially agreed upon assignment of meaning, we are socialized to
understand the sign and therefore to drive our car to the side of the road. The relationship
between the signified and the signifier changes in different settings: the same vehicle with sirens
Within maps, codes are the ways in which an assignment scheme associates, or signifies,
meaning to symbols (shapes and colors). For example, a symbol of a small circle can represent a
location where a fire has been reported to have taken place. Likewise in a representation of a
“hot spot” analysis, the color red may mean a high concentration of fires in an area, and the color
green may mean a low concentration. These codings can become socially agreed upon by
cartographers, thereby naturalizing the meaning of “red” to be associated with a high intensity,
for example.
Wood (2010) dives deeper into the process of coding and argues that maps employ
statements of ontological claims by displaying what exists in the world, or what he refers to as
this and the spatial locations of things in the world, or what he refers to as there. The this and
there statements are the tools that, as Harley (2010) describes, assign, prioritize, and rank
concrete spatial claims, asserting truths over an area and giving power to the map. In a map
showing reported fire incidences responded to by a neighborhood’s fire department, for example,
residential buildings, businesses, commercial spaces, and even vehicles serve as the attributed
this (or the existence of). This house that burnt is there. This boundary for the fire station is
there, and if you live on the other side of the boundary line, you must be served by a different
station (see section 2.4.2.3, where I discuss how maps can inspire action). A successful process
of coding therefore goes beyond cartographic production and involves social assent whereby the
coding imparted by the map is accepted and lived by. If a map is successfully coded, then it
becomes naturalized, masking the fact that there was any social process involved in coding at all.
2.4.1.3 Maps create truth
Through the power of the naturalized codes, maps represent specific perspectives or
because they naturalize social perspectives or agendas. Maps are powerful because the fact that
they make truth claims through “cultural coding” is not seen or acknowledged. The map is
simply accepted. Because these perspectives are naturalized through cultural coding, the claims
made by a map are then available to be accepted as true. This transition from coding to truth is a
result of the scientific perspective toward maps, wherein maps became seen as mirroring the real
world, a process I discussed earlier. Harley (1989, 4) argues that, “…the methods of cartography
have delivered a true, probably progressive, or highly confirmed knowledge.” Pickles takes a
slightly different approach when he asserts that maps bring objects into reality, creating truth.
“Maps create objects whose existence is mythic, at least to the extent that these identities are highly formalized abstractions whose effects (once represented as a real object) become very real. Once conjured up, new spatialized identities begin to work as real places…from this vantage point the real has been conjured out of the copper and ink by the cartographic magician; transubstantiation has been achieved and the magician’s gold (the real thing) is available to us for use” (2004, 94).
Crampton takes a middle-of-the-road approach by claiming, “Mapping creates knowledge as
much as (and for some, instead of) reflecting it... Mapping…is the production of knowledge, and
therefore, truth” (Crampton 2010, 46). For all of these scholars, the production of knowledge
results from the assertion or reassertion of claims that are made through naturalized maps.
To continue with the example of fire maps, maps have transitioned from coded
representations to representation of truth when decision makers choose to use the map as a basis
for their decision making. A map that has successfully been coded and naturalized may not be
accepted as truth if the map does not meet socially-agreed upon standards appropriate for map
design or for datasets. A map of reported fires that is created from cardboard and crayon is not
likely to be accepted as truth due to the current social preference for data and representation
in a GIS map may be accepted as fact without challenge. It could cause the rethinking about
what parts of town are the most prone to house fires, for example.
Wood and Fels (1986) provide the most well recognized articulation of a map’s ability to
assert truth through their deconstruction of a North Carolina Official Highway Map. They begin
by highlighting the codes and naturalization, explaining the way the map highlights roads while
ignoring biking paths, displays locations for tourist activities while silencing its other economic
drivers, asserts the state’s identity through pictures of the state flag and state bird, selects “points
of interest” for travelers, and even offers a little prayer for drivers, the “mask of innocence and
transparency” (Harley 1989, 9). The map creates a hierarchy of towns and roads as to organize
the way in which those who move through the spaces of North Carolina are viewing the
landscape. As one drives through a small town, the hollow black dot that represents it on the map
tells the reader “this is not the best that North Carolina has to offer. Wait till you get to the city
indicated by the star with a circle around it!” These codes are used to make assertions about what
it is that gives North Carolina its North Carolina-ness. Wood and Fels make the case that these
cartographers, while they were making this map, were actually making North Carolina.
Maps can confirm their readers’ already socially-produced impressions of a place, or they
can encourage their readers to think about space in a different way. If a map has been naturalized
completely, the new or reaffirmed information represented through the map can transform from a
simple claim to a truth. When a claim is accepted as truth, the claim can provide the foundation
or justification to inspire action in the world.
2.4.1.4 Maps inspire action
Just as the map makes mythic objects into reality (Pickles 2004), maps can inspire the
tool for providing validation for decision making, informing a larger conversation around a
pattern or process, reporting history, or simply navigating between destinations.
In my example of fire reporting, a boundary line on a map asserts a truth that a person’s
house fire would be serviced by fire station 16, but if she lives on the other side of the line, she
must be served by a different station. In the instance that a resident who lives inside of the fire
station 16 boundaries would call the fire department, fire fighters from station 16 would be called
into action and trucks would be driven on the determined quickest route to get to her home. In a
map that represents the concentration of reported house fires, this resident’s neighborhood,
having been determined a hot spot for fire concentration, could be the location of door-to-door
canvasing by members of the Red Cross to provide free smoke detectors to residents.
Through these three pillars of power I identify, maps are able to create and reinforce
power-knowledge in the world. Critical cartography exposes the entire political process,
including these pillars, within which professional map production exists. With an increased
understanding of these power relations, recent movements in mapping have begun to challenge
top down approaches to mapping, developing critical mapping strategies.
2.5 Critical mappings
Recent modes of cartography have been “slipping from the control of the powerful elites
that have exercised dominance over [cartography] for several hundred years,” (Crampton and
Krygier 2006, 12). If maps are tools that the professionals use for knowledge production, is it
possible that the public could make competing and equally powerful claims with maps
(Crampton 2010, 41)? Mapping that challenges professional map-making has been framed as
critical mapping (Wood 2003; Crampton 2010; Wood and Krygier 2009). More specifically,
top-down control and does not need the approval of experts in order to flourish.” Critical mapping
differs from critical cartography in that the mapping confronts the power dynamics that have
been revealed by scholars of critical cartography through practice.
One well-recognized example of critical mapping is an art map, or a representation of
space created by individuals or groups that either utilize previously created maps (typically ones
made by professionals) or construct their own representation of space using less traditional
methods (see Figure 2). Wood argues that by expressing space through art, the mask of neutrality
is stripped away from the map, as art does not attempt to veil its biases, allowing the biases to be
discernable and open for discussion. There is a great deal of interest in the work of art maps
because of the way they “… contest not only the authority of professional mapmaking
institutions... to reliably map the work, they also reject the world such institutions bring into
being,” (Wood and Krygier 2009, 9). For example, the picture below depicts a map of Paris that
Figure 2. Art maps challenge professional cartography
has been split up into its different neighborhoods; red arrows have been drawn to represent how
Parisians generally travel between the different neighborhoods. This subjective view of Paris
demonstrates how these alternative methods can starkly contrast and challenge the authority of
the professional mapmaking institutions while at the same time revealing a particular perspective
about the city. Beyond the instances of art maps, due to the latest “technical transition” (Perkins
2003), anyone who has a home internet connection has the ability to utilize open source,
collaborative, mapping tools and engage in forms of critical mapping. Perkins (2003) and
Monmonier (1985) assert that recent technological transitions of mapping practices are creating
opportunities not only to advance the technical abilities of professionals, but to advance the
mapping practices of the public through the introduction of open source data, mobile mapping
technology, and the geospatial web. Through map hacks (using a web based map for one’s own
purposes), hybrid, or even every day mappings, individuals are asserting their claims about a
space through the use of newly available technologies (Crampton and Krygier 2006). Crampton
(2010) demonstrates how tools such as Google Earth provide individuals who have an internet
connection the ability to create interactive, 3D visualizations, and agrees with Perkins and
Monmonier that mapping has been taken out of the exclusive realm of professional
cartographers. As mapping continued to expand outside the boundaries of professional
cartography, members of the public worked together to create maps that represented their own
spatial claims in a process known as community mapping.
2.5.1 Community Mapping as Critical Mapping
Community mapping occurs when a map is produced, “...by a particular locale, often
featuring local knowledge and resources” (Parker 2006, 23 emphasis added). Local knowledge
share their experience, their values, their vision about a particular place” (Lydon 2003, 4). These
methods engage a critical mapping approach, as they take map creation out of the hands of the
powerful by giving members of the public the ability to make maps. This redistribution creates
opportunities for entire communities to engage in discussions around space and actively
articulate social, economic, political, or aesthetic claims about that space (Perkins 2007). The
ability to assert spatial claims through maps is especially important for marginalized
communities, as they typically do not have available to them the resources that allow them to
create knowledge about their neighborhoods. There are a number of well-established community
mapping projects that have gained a significant amount of traction regionally and globally,
including the UK-based project Parish Map.
2.5.2 Parish Map
One of the earliest well-known community mapping projects beganin 1985 when the
charity Common Ground, based in the United Kingdom, began the Parish Map Project. This
traveling initiative encourages local residents to map their parish using whatever skills or
knowledge they have. Common Ground was keen to avoid centralized standards and only offered
general guidelines as a way to encourage communities to represent their unique perceptions
about their spaces. Since its inception, over 2000 communities have engaged in the parish
mapping project (Perkins 2007), a large percentage of which are in rural England (Crouch and
Matless 1996). The lack of central standards for the initiative and high levels of participation led
to diverse outcomes. Community mapping engages participants in process of negotiation;
Perkins (2007) reflects that, “The process sees different voices raised. The remit encourages
sharing, but the format tends to articulate a single voice. On the surface most parish mapping
products often hide uneasy and negotiated comprises” (Perkins 2007, 131). While disagreements
may be masked by the map, the act of mapping allows opportunities for interaction and dialogue
between community members. Perkins (2007) explains that, “many parish mapping projects have
also involved a strongly performative element…,” meaning that the mapping initiative sparked
the organization of community events and social gatherings. Simply by engaging in the mapping
project, communities further built social relationships. Community mapping projects often
highlight the processes that take place in refining the vision of a large community into one
singular representation. The Green System project is another example that faces the challenges of
representing the opinion of many in a map.
2.5.3 The Green Map
The Green Map System is a well-developed example of what a technology-based
community mapping can accomplish. Through the collection and sharing of locally-collected
data in the Green Map Systems online database with a standardized set of symbols and mapping
practices, the program sets out to create a depiction of sustainable development around the globe.
The program’s first map was made of New York City in the 1990s and was created as a way for
community to make eco-cultural claims about their neighborhoods to aid in the development of a
model for sustainable planning. From this installment, the project has grown to a global network
of projects that have been completed in 900 communities in 65 countries. Similar to the Parish
Map Project, the Green Map system is centrally organized while leaving the work to be done by
the community that is being represented. However, the Green Map project places a greater
emphasis on a structured process and methods in an attempt to standardize global data sets. This
structure can restrict a single community’s ability to make its claims, as participants must
As more and more people are participating in mapping, is it possible that the spatial
claims made by the public can wield the same types of power as the ones that are made by the
professional cartographers? That question has not yet been examined in detail. While scholars of
critical cartography propose the framework from which to do so, there has been no area of study
that has ontologically examined this. Crampton (2010, 37) asserts that community and
participatory mapping is “…not likely to provide solutions for underserved populations to
bootstrap themselves out of poverty”, in a discussion of the democratization of cartography, but
does not further explain why this is to be true. But it does appear to be true that community
mapping, and other critical mapping efforts, continue to lag behind professionally-produced
maps in the sense that the main power they seem to have is that they have been produced through
bottom-up methods. It remains to be seen if there have been any significant upsets of power
relations in decision-making conversations, as maps used by local, city, state, and federal leaders
do not resemble that of the Paris art map or the parish maps but instead remain as spatial
representations that reflect the Arthur Robinson-era of cartographic methods. Because of this, I
propose a new methodology of mapping that attempts to bridge the ability to be critical and the
ability to be powerful. This methodology is couched in the effective approach of participatory
action research.
2.6 Participatory Action Research
Participatory action research (PAR) references a research methodology that partners
researchers and members of the public together in working towards effecting positive change.
This methodology challenges the traditional understanding of “objective” scientific research
design, removing the barrier between the “researcher” and the “researched” (Wadsworth 1998)
(Kindon et al. 2007). McIntyre (2007,44) suggests that PAR is a method for researchers who are,
“committed to co-developing research program with people rather than for people.” While the
primary goal of much qualitative research is to understand a phenomenon from an individual’s
viewpoint, PAR incorporates action into the research approach, which is “the systematic
collection and analysis of data for the purpose of taking action and making change” (Gilis and
Jackson 2002, 265). What most distinctly separates PAR from other qualitative methodologies is
the active inclusion of participants in the action research process (MacDonald 2012). As such,
PAR is considered democratic, equitable, liberating, and life enhancing (Kach and Kralik 2006).
This methodology has been heavily applied to four main areas: community development,
organizations, schools, and environmental studies (Selenger 1997).
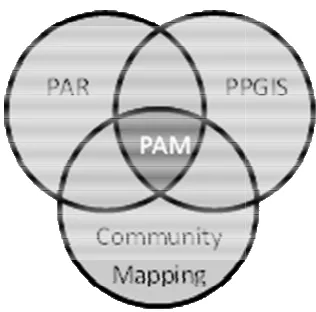
2.7 Participatory Action Mapping
Through the review of the literature, in addition to my experiences as a student of
geography and GIS, it becomes apparent that participatory mapping methods are failing to offer
the public significant opportunities for sustainable empowerment. Therefore, I suggest PAM as a
methodology that combines the resources and expertise of PPGIS, the critical mapping
perspective of community mapping, and the effort to effect positive social change of PAR.
Through this methodology, mapping experts and members of the public work in tandem to create
maps that advocate for social change. While a mapping collaboration can be acted out in a wide
range of combinations of efforts from either party, the main premise of PAM is that both the
mapping expert and the non-expert/s are actively engaged in the process of deciding and acting
There are six key elements that make up PAM. The first and most significant element is
that the partnership is based on equality
Such a partnership often requires ample opportunity for the establishment of trust.
communities suffering from larger issues of systemic disenfranchisement, residents suffer from
fatigue as they have worked with multiple “helicopter researchers”
“literally or figuratively fly into their communities,
hear from again by the community” (Ferreira and Gendron 2011, 154)). Another way to avoid a
“helicopter researcher” experience
community engaged in the partnership should
mappings prior to the creation of
strongest foundation for a meaningful partnership and helps avoid the engagement of community
members in mapping simply for the sake of fulfill
academic partner. A third element of PAM is that it is best to
what ways early on in the partnership. This process of definition provi
expectations for all involved in the research, allowing all parties to move forward with
confidence. These definitions of participation should not be rigid
[image:37.612.106.264.67.223.2]very fluid, and the methodology should be so as well
Figure 3 Participatory Action Mapping
key elements that make up PAM. The first and most significant element is
based on equality, as is the case with most participatory action methods.
Such a partnership often requires ample opportunity for the establishment of trust.
communities suffering from larger issues of systemic disenfranchisement, residents suffer from
fatigue as they have worked with multiple “helicopter researchers” (meaning researchers who
“literally or figuratively fly into their communities, administer surveys, and leave
hear from again by the community” (Ferreira and Gendron 2011, 154)). Another way to avoid a
“helicopter researcher” experience, and the second element of PAM, is that it is best that the
artnership should have a need or desire in place for maps and
mappings prior to the creation of the PAM partnership. I argue that this element provides the
strongest foundation for a meaningful partnership and helps avoid the engagement of community
s in mapping simply for the sake of fulfilling course or dissertation requirements for the
academic partner. A third element of PAM is that it is best to define who participates and in
on in the partnership. This process of definition provides a foundation of
expectations for all involved in the research, allowing all parties to move forward with
confidence. These definitions of participation should not be rigid, however. Community work is
very fluid, and the methodology should be so as well. Therefore, PAM’s fourth element is to
Participatory Action Mapping
key elements that make up PAM. The first and most significant element is
, as is the case with most participatory action methods.
Such a partnership often requires ample opportunity for the establishment of trust. Especially in
communities suffering from larger issues of systemic disenfranchisement, residents suffer from
(meaning researchers who
administer surveys, and leave-never to be
hear from again by the community” (Ferreira and Gendron 2011, 154)). Another way to avoid a
, and the second element of PAM, is that it is best that the
have a need or desire in place for maps and
. I argue that this element provides the
strongest foundation for a meaningful partnership and helps avoid the engagement of community
course or dissertation requirements for the
define who participates and in
des a foundation of
expectations for all involved in the research, allowing all parties to move forward with
however. Community work is
keep an open and flexible workflow. This flexibility allows for a process of refinement to take
place during the mapping process. The process of refinement is very important for the success of
PAM to ensure that maps produced through the expertise of the mapping partner are precise in
their expression of the community’s perspectives. Therefore, the fifth element of PAM is
engaging in an iterative mapping practice. This can be performed through the presentation of
multiple drafts of maps to the community members. When presented with a draft, community
members are prompted to provide detailed feedback with the goal of ensuring the map/mappings
align with the community’s perspectives as closely as possible. Changes are made based on
community feedback, and the updated draft is presented for additional feedback. This process
repeats as many times as necessary, or as negotiated by the partners. The sixth and last element is
to employ sustainable mapping methods. Sustainable, in this case, refers to the ability of the
maps and mappings to continue to work on behalf of the community once the partnership has
expired. This requires that the community has access to, and potentially workable knowledge of,
the map data and tools used by the mapping partner. By engaging these six elements, PAM
strives to provide a framework for research that is supportive in exploring and challenging
everyday injustices faced by community members.
While the history of our present day understanding of maps remains brief, there has been
an even shorter span of critically examining the ways in which maps are produced and how they
act in the social world. While critical cartography exposes the power that maps hold, critical
mapping has emerged to challenge the constraints of professional cartography. As methods such
as community mapping and PPGIS produce maps that are either whimsically critical or
inaccessible to the public, PAM is an approach that attempts to bridge the two. There are
to establish their connections and distinctions to PAR. Counter mapping is a type of participatory
mapping that pairs indigenous populations and researchers or activists to produce maps that can
be used to advocate for the rights of indigenous peoples (Peluso 1995, Chapin et al 2005,
Herlihy and Knapp 2003, Harris and Hazen 2005). The term counter mapping was coined by
Nancy Peluso (1995), who accounts of using sketch maps to assist the indigenous population in
Kalimantan, Indonesia re-claim forest territories that were being taken over by industry. While
counter mapping efforts share the type of partnership model of PAM, the partnerships are
typically led by academic activists and thereby do not fulfill the practices of equalization enacted
by PAM. Another form of participatory research is community-based participatory research
(CBPR). CBPR focuses the efforts of PAR within a self-defined community group and has been
practiced largely by researchers in public health (Israel et al 1998, Wallerstein and Duran 2003,
Minkler and Wallerstein 2008). The action oriented prospects of methods such as PAR or CBPR
closely align with many of the six tenants of PAM. PAM, however, narrows the lens onto a
specific method, mapping, in ways these other methodologies do not.
Through an examination of the ways in which the tenets of critical cartography exist in
PAM, I seek to examine this methodology in its potential to be a process that is simultaneously
critical and effective, acting as a way to access the power that professionally-produced maps
hold.
3 RESEARCH QUESTION AND METHODOLOGY
This study’s guiding research question, framed by literature in critical cartography, public
participatory geographic information systems, community mapping, and participatory action
research, sets out to explore the proposed participatory action mapping (PAM) methodology.
cartographers. Therefore the guiding q
does participatory action mapping (PAM) fulfil
cartography?
To answers this question, I employ a case stu
members of a community-based organization and I
professional cartographer, engage in the co
study approach is the application
[image:40.612.100.334.305.568.2]that can be used in a broader context
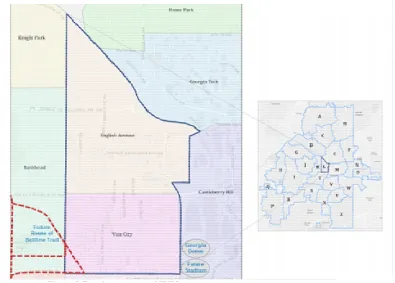
Figure 4 Map Showing Neighborhood Planning Units of Atlanta
Map by Amber Boll
partnership with the Westside Atlanta Land Trusty (WALT) and my experiences in English
Avenue and Vine city community mapping project to examine the
Therefore the guiding question for this research asks the following
does participatory action mapping (PAM) fulfill or challenge insights offered by critical
question, I employ a case study approach to observe the ways in which
based organization and I, utilizing the tools and techniques of a
engage in the co-production of knowledge through mapping. A case
study approach is the application of a close examination to a single process to reveal applications
that can be used in a broader context (Yin 2009). For this research, I will examine my mapping
Map Showing Neighborhood Planning Units of Atlanta
with the Westside Atlanta Land Trusty (WALT) and my experiences in English
Avenue and Vine city community mapping project to examine the successes and failures
for this research asks the following: In what ways
or challenge insights offered by critical
dy approach to observe the ways in which
, utilizing the tools and techniques of a
production of knowledge through mapping. A case
of a close examination to a single process to reveal applications
or this research, I will examine my mapping
with the Westside Atlanta Land Trusty (WALT) and my experiences in English
PAM elicits. The empirical research for this project consists of two forms of data collection: 1)
direct and participant observation during the advisory board meetings for WALT and 2)
individual interviews engaging the members of WALT in a critical examination of maps.
3.1 Case Study
The mission of the Westside Atlanta Land Trust (WALT) is to “...organize the
community’s power for self-determination to serve and preserve in-place residents, small
businesses and their successive generations in redeveloping areas (waltprogram.org).” Its
primary efforts are performed through the development of a community land trust (CLT) model.
A CLT is a model for collective ownership of land, where members of the land trust are all
considered owners of the land while the structure on top (e.g., the house) can be rented or owned
by an individual. This allows the individual to only pay taxes on the structure they are occupying
and not the land, as the property taxes are the responsibility of the land trust. WALT utilizes this
method of property ownership as a method to create an affordable housing stock within the
community.
WALT concentrates its work specifically in the English Avenue and Vine City
neighborhoods, which combined make up Neighborhood Planning Unit (NPU) L in Atlanta’s
twenty-five district citizen advisory council divisions (see Figure 4). The 2010 Census reports
NPU L to be home to over 7,000 residents, the majority of which are Black (see Table 2). This
area is located in a portion of Atlanta that is undergoing redevelopment (see Figure 5). As such,
the model to create affordable housing for residents is relevant to preventing residents from
Figure 5 Development Near NPU
Map by Amber Boll and Andy Walter
3.2 Establishing the Partnership
Members of WALT have
Georgia State University’s Department of Geosciences. More precisely, during the summer of
2014, Dr. Katherine Hankins advised a group of undergraduate students participating in a
National Science Foundation (NSF) funded Research Experience for Undergraduates (REU), as
they completed a research project with WALT. The leaders of WALT and Dr. Hankins have kept
in contact and in fall 2014, leaders of WALT reached out to Dr. Hankins to ask for some
assistance in utilizing the data from th
aware of my interest in community mapping, asked if I would like to take on the commu
mapping project with WALT. In October of 2014 Dr. Hankins and the leaders of WALT
Development Near NPU-L
Amber Boll and Andy Walter
Establishing the Partnership
ve completed a previous research project in collaboration with
Georgia State University’s Department of Geosciences. More precisely, during the summer of
advised a group of undergraduate students participating in a
National Science Foundation (NSF) funded Research Experience for Undergraduates (REU), as
they completed a research project with WALT. The leaders of WALT and Dr. Hankins have kept
d in fall 2014, leaders of WALT reached out to Dr. Hankins to ask for some
assistance in utilizing the data from the summer’s research projects to make maps. Dr. Hankins,
aware of my interest in community mapping, asked if I would like to take on the commu
mapping project with WALT. In October of 2014 Dr. Hankins and the leaders of WALT completed a previous research project in collaboration with
Georgia State University’s Department of Geosciences. More precisely, during the summer of
advised a group of undergraduate students participating in a
National Science Foundation (NSF) funded Research Experience for Undergraduates (REU), as
they completed a research project with WALT. The leaders of WALT and Dr. Hankins have kept
d in fall 2014, leaders of WALT reached out to Dr. Hankins to ask for some
summer’s research projects to make maps. Dr. Hankins,
aware of my interest in community mapping, asked if I would like to take on the
arranged an introduction meeting where I was able to meet with them for the first time and, after
hearing about their specific mapping needs, agreed to take on the project. Since this date, I have
been attending WALT advisory board meetings.
3.2.1 Study Site
Research was performed at three locations. The first location was the meeting space for
the WALT advisory board meetings. These meetings took place the first and third Saturday of
the month from 3pm to 5pm at 186 Sunset Avenue. The second location was the Parent as
Partners Academic Center 225 J.P. Brawley Drive (Vine City neighborhood) and the third was
the Outdoor Classroom & Learning Garden at 386 Elm Street (English Avenue neighborhood).
3.3 Observation
I completed both direct observation and participant observation as part of this research. I
observed a series of bi-monthly public advisory board meetings for WALT. These meetings were
held the first and third Saturday of the month from 3pm-5pm at the Neighborhood Union Health
Center Community Room and have been averaging attendance rates of approximately thirty
people, including adults and teenagers.
3.3.1 Direct Observation
Observations were made to assist in determining the spatial understanding that WALT
members have toward their neighborhood and to gain an understanding of what it was that
members of WALT would like to assert about their neighborhood in the creation of maps.
Additionally, observation of these advisory board meeting allowed me to become familiar with