Using rainfall thresholds and ensemble precipitation forecasts to
issue and improve urban inundation alerts
Tsun-Hua Yang1, Gong-Do Hwang1,2, Chin-Cheng Tsai1, and Jui-Yi Ho1
1Taiwan Typhoon and Flood Research Institute (TTFRI), National Applied Research Laboratories (NARLabs),
Taipei, 10093, Taiwan
2Department of Atmospheric Science, National Taiwan University, Taipei, 10617, Taiwan
Correspondence to:Tsun-Hua Yang ([email protected])
Received: 8 July 2016 – Published in Hydrol. Earth Syst. Sci. Discuss.: 29 July 2016 Revised: 8 November 2016 – Accepted: 16 November 2016 – Published: 30 November 2016
Abstract. Urban inundation forecasting with extended lead times is useful in saving lives and property. This study pro-poses the integration of rainfall thresholds and ensemble pre-cipitation forecasts to provide probabilistic urban inunda-tion forecasts. Utilizainunda-tion of ensemble precipitainunda-tion forecasts can extend forecast lead times to 72 h, predicting peak flows and to allow response agencies to take necessary prepara-tory measures. However, ensemble precipitation forecasting is time- and resource-intensive. Using rainfall thresholds to estimate urban areas’ inundation risk can decrease this com-plexity and save computation time. This study evaluated the performance of this system using 352 townships in Taiwan and seven typhoons during the period 2013–2015. The lev-els of forecast probability needed to issue inundation alerts were addressed because ensemble forecasts are probability based. This study applied six levels of forecast probability and evaluated their performance using five measures. The re-sults showed that this forecasting system performed better before a typhoon made landfall. Geography had a strong im-pact at the start of the numerical weather modeling, resulting in the underestimation of rainfall forecasts. Regardless of this finding, the inundation forecast performance was highly con-tingent on the rainfall forecast skill. This study then tested a hybrid approach of on-site observations and rainfall fore-casts to decrease the influence of numerical weather predic-tions and improve the forecast performance. The results of this combined system showed that forecasts with a 24 h lead time improved significantly. These findings and the hybrid approach can be applied to other hydrometeorological early warning systems to improve hazard-related forecasts.
1 Introduction
Flooding is one of the most destructive disasters in the world and results in enormous losses of life and property annu-ally (Gruntfest and Handmer, 2001; Barredo, 2009; Halle-gatte et al., 2013; Sampson et al., 2015). Global flood risk is likely to increase under climate change; as a result, numerous adaption strategies should be considered (Hirabayashi et al., 2013). Establishing an early flood warning system to reduce disaster losses is the most cost-effective solution of all of the structural and non-structural measures studied (Alfieri et al., 2012; Hallegatte, 2012). Several flood warning systems have been developed and implemented in response to floods (Pap-penberger et al., 2005; Thielen et al., 2009; López-Trujillo, 2010; De Kleermaeker et al., 2012; Doong et al., 2012).
– Simplified equation-based systems (e.g., Cirbus and Podhoranyi, 2013; Liu et al., 2015; Shao et al., 2015) use simplified equations, such as Manning’s equation, to describe water spreading, thereby improving the cal-culation efficiency of the forecasting models. However, the data required, including digital elevation models (DEMs) and surface roughness, are sometimes difficult to collect. As a result, data preparedness is still a practi-cal concern for the abovementioned models.
– Data-driven models are based on computational intelli-gence or machines. Flood forecasting is just one of the applications of these models (e.g., Chang et al., 2010; Lin et al., 2013). As indicated by the name, the quality and quantity of data used in the model have a consider-able impact on the performance of data-driven models. To collect accurate flood inundation data is a challenge in itself. In addition, the performance of data-driven models deteriorates as forecast time increases (e.g., Lin and Jhong, 2015; Badrzadeh et al., 2015). Data-driven models also cannot provide forecasts with longer lead times.
– A rainfall threshold approach is commonly applied to evaluate landslide risk (e.g., Crosta and Frattini, 2003; Guzzetti et al., 2007; Posner and Georgakakos, 2015). Meteorological organizations generally issue flood fore-casts/warnings if a critical value – namely, a rainfall threshold – is exceeded by the observed or predicted rainfall (Martina et al., 2006). Several operational me-teorological agencies throughout the world issue warn-ings based on Flash Flood Guidance (FFG) values (Gourley et al., 2014). The US National Weather Ser-vice (NWS) developed FFG values for flash flooding (Carpenter et al., 1999). Based on these values, floods are predicted, and flood warnings are issued Geor-gakakos (2005, 2006) studied operational flash flood warning systems based on FFG and provided analyt-ical results. These studies found that an FFG thresh-old is likely to produce a high probability of detec-tion in regions where flash floods are frequent. The Eu-ropean Flood Awareness System (EFAS) uses numer-ical weather predictions and the Enhanced Runoff In-dex based on Climatology, which is based on simulated climatology, an FFG-related concept, to provide flash flood warnings (Raynaud et al., 2015). In countries such as Kenya and Haiti that do not have enough well-trained operators and resources to set up an efficient flood warn-ing system, the approach is a viable alternative that al-lows for the mitigation of flood damage (Georgakakos et al., 2013; Shamir et al., 2013; Hoedjes et al., 2014). The rainfall threshold approach has proven successful in identifying a number of flash floods across Europe (Al-fieri et al., 2014). Although it should not be considered a substitute for complex hydro-meteorological models
because of its simplicity, using a rainfall threshold ap-proach to develop a flood warning system can be an im-mediately useful tool for a variety of decision makers interested in early warnings and flash floods (Martina et al., 2006). Only a few studies (Jang, 2015; Wu et al., 2015) have applied rainfall thresholds to evaluate urban inundation risk. The present study represents the first of its kind to use the rainfall threshold approach and quan-titative precipitation forecasts (QPFs) to evaluate inun-dation risk in Taiwan. By directly comparing QPFs with critical rainfall thresholds, this study aims to propose an early warning system that provides forecasts, allows for the possibility of issuing urban inundation warnings and gives response agencies enough lead time to implement emergency preparedness plans.
A flood warning system that uses QPFs as the rainfall in-put could increase the forecasting horizon from a few hours to a few days (Pappenberger et al., 2005; Shi et al., 2015). Georgakakos (2005) concluded that the dominant source of uncertainty in applying a rainfall thresholds approach to eval-uate flood risk is precipitation. The uncertainty in forecasted rainfall values is generally higher than that for observed rain-fall data. Nevertheless, to extend the forecast lead time, op-erational and research flood forecasting systems around the world are increasingly moving toward using QPFs to pro-vide early warnings (Cloke and Pappenberger, 2009). Mar-tina et al. (2006) discussed the possibility of providing flood warnings at given river reaches by directly comparing the QPF to a critical rainfall threshold value. Regardless of the forecasts’ uncertainty, considering which probabilistic fore-cast levels should be used to issue inundation alerts or take actions is a challenging topic. Higher levels of probabilis-tic forecasts usually give the practitioner more confidence in the results. Dale et al. (2014) proposed a risk-based decision-support framework that could be easily applied in an opera-tional flood forecast and early warning context. Other studies have also discussed the selection of appropriate probabilis-tic forecasts in terms of the economic and pracprobabilis-tical conse-quences of taking action (Coughlan de Perez et al., 2015, 2016). Therefore, the present study evaluates the system’s performance in terms of different levels of forecast probabil-ity. In addition, this study proposes a data assimilation tech-nique that uses real-time observations to decrease the uncer-tainty from rainfall forecasts and increases the 24 h forecast accuracy.
2 System development
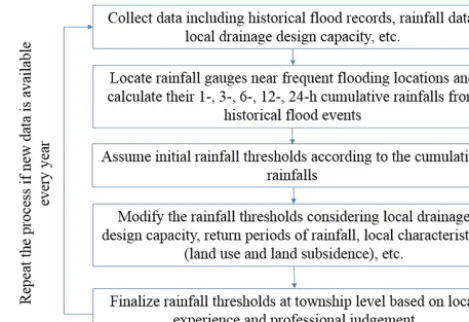
Figure 1.The operational flow chart for the proposed urban inun-dation early warning system.
page. Due to a limitation in the computing resources and data retrieval tools available, the system generates a forecast ev-ery 6 h and updates the results on the web page. The details of each component in the system are as follows.
2.1 Ensemble precipitation forecasts for system input This study used rainfall forecasts from a precipitation ensem-ble forecast experiment, namely, the Taiwan cooperative pre-cipitation ensemble forecast experiment (TAPEX). TAPEX is a collective effort among academic institutes and govern-ment agencies such as National Taiwan University (NTU), National Central University (NCU), National Taiwan Nor-mal University (NTNU), Chinese Culture University (CCU), the Central Weather Bureau (CWB), the National Center for High-Performance Computing (NCHC), the Taiwan Ty-phoon and Flood Research Institute (TTFRI), and the Na-tional Science and Technology Center for Disaster Reduc-tion (NCDR). The experiment began in 2010 and was the first attempt to design a high-resolution numerical ensemble weather model in Taiwan. The experiment collects world-wide observation data, including temperature, wind, surface pressure, and relative humidity, from satellites, atmospheric sounding devices, buoys, aviation routine weather reports, ships, and other available sources (e.g., Hsiao et al., 2012, 2013). TAPEX uses the outputs from the Global Forecast System (GFS) produced by the National Centers for Envi-ronment Prediction (NCEP), along with observation data, as the initial and boundary conditions for its forecasts. Various model physics schemes and data assimilation strategies are used to perturb the numerical weather models and create
dif-Figure 2.The identification process of rainfall thresholds (modified
from Wu and Wang, 2009).
[image:3.612.311.546.67.228.2]two-level alarm for five duration periods. The five duration periods are 1, 3, 6, 12, and 24 h; a total of 10 rainfall thresh-olds are used to issue urban inundation alerts. The two levels of alarms are defined as follows:
– First-level alert: If the rain continues, the roads and vil-lages subject to a high risk of flooding in the alerted townships may flood.
– Second-level alert: If the rain continues, the roads and villages subject to a high risk of flooding in the alerted townships will flood in the next 3 h.
The WRA has associated different rain gauges with differ-ent townships and issues warnings by comparing the obser-vations with the associated rain gauges. The rainfall thresh-olds for the first and second alerts are different. There is a 3 h lead time before flooding if the accumulated rainfall reaches the second-level alert. The first-level alert is at an immedi-ate risk of flooding. The WRA identified the rainfall thresh-olds of the second-level alerts for the purpose of precaution so that the responding authorities have time to take action. An inundation alert is issued if any of the rainfall thresh-olds is met by the observed rainfall. Wu (2013) compared the alerts to collected inundation records in 2012 and 2013 and concluded that the forecast accuracy rate is above 60 %. As the only rainfall threshold approach used to issue inundation alerts in Taiwan, it has proven its applicability in predicting flood inundation. This study used the rainfall thresholds of the second-level alerts to develop an early flood warning sys-tem.
2.3 Inundation risk evaluation and a data assimilation technique to modify the forecasts
In practice, the WRA issues inundation alerts when the cu-mulative rainfall exceeds the rainfall threshold at time T
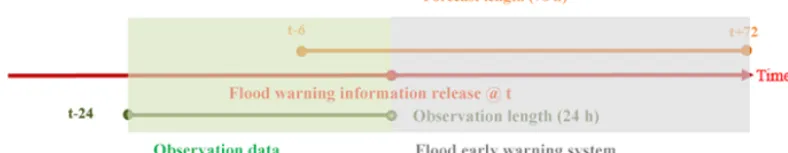
[image:4.612.327.524.70.214.2](Fig. 3). However, WRA compares real-time precipitation observations to the rainfall thresholds, and thus the lead time is usually not long enough to allow communities to im-plement emergency preparedness measures. This study pro-poses a practical early warning system that compares cumu-lative projected rainfall instead of observed rainfall to pro-vide probabilistic urban inundation forecasts. The system uses TAPEX’s forecasted rainfall to extend the model’s lead time to 72 h. Figure 4 shows the forecast length during a real-time operation. TAPEX uses available observations att−6 as its model’s initial conditions, and its numerical weather model computation process took 6 h to produce rainfall fore-casts fromttot+72 h; 352 Taiwanese townships were used in this study to evaluate the proposed system’s performance. Equations (1) and (2) were used to calculate the probabil-ity of inundation in any given township; the forecasts were displayed over three distinct time periods (1–24, 25–48, and 49–72 h). A rolling window approach was applied to esti-mate the probability of issuing an inundation alert: each hour
Figure 3.WRA issues an inundation alert when observed rainfalls
meet or exceed any given rainfall thresholds (modified from Martina et al., 2006).
of the forecasting period was considered an evaluation end point, and the cumulative rainfall was calculated for the dif-ferent durations.
fi=
1 if PFi,accu≥PTdur
0 if PFi,accu<PTdurdur
= {1,3,6,12,24 h}, (1) where PFi,accuis the cumulative forecasted rainfall of theith
ensemble member in TAPEX. PTdur represents cumulative
rainfall thresholds for the different durations (dur) (1, 3, 6, 12, and 24 h). An inundation occurred (fi=1) if the
cumu-lative forecasted rainfall exceeded any of these thresholds.
Pr= 1
N
N X
i=1
fi×100, N=1,2, . . .,20 (2)
There are 20 ensemble members (N=20) in TAPEX. Equa-tion (2) sums thefivalues to obtain a probability (Pr), which
represents the inundation risk for any given township. Each township’s inundation risk can be obtained by repeating the above steps and comparing the results to TAPEX’s 72 h rain-fall forecasts. Three separate time periods (1–24, 25–48, and 49–72 h) illustrate the township’s future inundation risk.
Figure 4.A combination of real-time rainfall observations and forecasts to improve 1 to 24 h inundation forecasts.
biases were 0.49 and 0.12 for rainfall thresholds of 100 and 350 mm day−1, respectively. The complexity of the earth– atmosphere system and associated physical interactions adds uncertainty to the ensemble rainfall forecasts. However, this is beyond the scope of this study. The purpose of this study is to provide flood warnings by adopting the existing uncertain-ties in numerical weather forecasts and to improve the fore-casts by using a data assimilation technique that uses real-time rainfall observations. This study used the technique to modify the 24 h urban inundation forecast performance. Fig-ure 4 illustrates the combination of observations and fore-casts used in the forecasting process. This study utilized five rainfall thresholds to represent different rainfall durations. However, these five thresholds could not be applied to eval-uate the inundation risk at every hour within the first 24 h forecast. For example, only one rainfall threshold covers the 1 h period, which can be considered time t in Fig. 3; how-ever, there is a lack of forecasts fort−1 and the preceding hours. Whent=t+2, only rainfall thresholds for 1 and 3 h can be adopted. This shortcoming results in the underestima-tion of inundaunderestima-tion forecasts. Given the above assumpunderestima-tion, all five duration periods are applicable after the 25th hour. This study proposes a data assimilation technique using observed rainfall data to address the absence of rainfall forecasts. It applies available observation data fromt−24 tot−1 prior to issuing inundation forecasts att (Fig. 4). Figure 2 com-bines the observation data (red line) and forecasts (dash line) with all rainfall thresholds (solid blue line). Alerts are issued if the combination exceeds the rainfall threshold at any given duration. In other words, the inundation forecast is improved within the first 24 h.
3 Study area and data 3.1 Study area
Taiwan has an area of approximately 36 000 km2, and ap-proximately 70 % of the island is covered by mountains. A mountain range runs through the center of the island from north to south and forms a ridge dividing the east- and west-bound rivers. The rest of the island is composed of alluvial plains below 100 m in elevation. Ninety percent of the popu-lation lives on these alluvial plains. The distance from the
mountaintops to the sea is very short, less than 70 km on average. Most of the riverbed slopes exceed 1/100 in the upstream reaches and are between 1/200 and 1/500 in the downstream reaches, which results in average rainfall-runoff concentration times of between 6 and 72 h in the townships (Jang, 2015) and a lag time between observed peak precipi-tation and flooding of between 2 and 10 h (Jang et al., 2012) time and high density of the population in the plains areas further increase the damage caused by floods. Taiwan is one of the most disaster-prone countries in the world; thus, it has been selected as the study area here for the development of an urban inundation warning system.
3.2 Observed inundation alerts
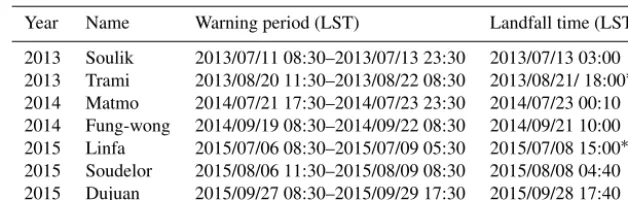
Table 1.Information of seven typhoons during 2013–2015 used to evaluate the system performance.
Year Name Warning period (LST) Landfall time (LST)
2013 Soulik 2013/07/11 08:30–2013/07/13 23:30 2013/07/13 03:00 2013 Trami 2013/08/20 11:30–2013/08/22 08:30 2013/08/21/ 18:00∗
2014 Matmo 2014/07/21 17:30–2014/07/23 23:30 2014/07/23 00:10
2014 Fung-wong 2014/09/19 08:30–2014/09/22 08:30 2014/09/21 10:00
2015 Linfa 2015/07/06 08:30–2015/07/09 05:30 2015/07/08 15:00∗
2015 Soudelor 2015/08/06 11:30–2015/08/09 08:30 2015/08/08 04:40 2015 Dujuan 2015/09/27 08:30–2015/09/29 17:30 2015/09/28 17:40
∗For typhoons that did not make landfall, this study defined the landfall time while the minimum observational
[image:6.612.53.280.260.322.2]station pressure was observed when typhoon was closest to Taiwan.
Table 2.Contingency table used for the system performance
evalu-ation.
CAP records from WRA Issued Not issued
Forecasted by the Issued Hit False alarm
proposed system Not issued Miss No event
make landfall. For reference, this study selected the mini-mum observed atmospheric pressure at a weather station to define the time when these two typhoons were closest to Tai-wan. The selected weather stations were the Taipei station for Trami and the Kaohsiung station for Linfa.
4 Results and discussion
This study relied on the contingency information shown in Table 2 to evaluate the performance of the proposed system. Hits and misses were associated with the observed records and determined based on whether the system’s warning fore-casts were consistent with the observations. A false alarm was associated with forecasts that did not correlate with ob-served data. “No event” was assigned to a township when neither the CAP records nor the model indicated flooding. Because floods are not frequent events, the no event (no flooding) scenario typically had a higher frequency than the other three fields. Different measures that have been broadly adopted by previous studies (e.g., Nguyen et al., 2015; Yang et al., 2015; Zhang et al., 2015) were used to evaluate the system’s performance:
probability of detection (POD)= Hit
Hit+Miss, (3)
false alarm ratio (FAR)= False alarm
Hit+false alarm, (4) success ratio (SR)= Hit
Hit+false alarm, (5)
threat score (TS)= Hit
Hit+Miss+false alarm. (6)
Both POD and TS are sensitive to hits and range from 0 to 1. The only difference between these two values is that POD ignores false alarms and TS does not. POD has the ability to be artificially improved by the issuance of additional alarms, which would increase the number of hits. TS is also known as the critical success index (CSI) and usually results in poorer scores for rare events. SR and FAR are the success ratio and false alarm ratio, respectively. FAR is used in conjunction with POD. If FAR equals 0.5 or less, the performance is con-sidered tolerable (Coughlan de Perez et al., 2016). The sum of SR and FAR equals 1, and both indices ignore misses. This study combined SR and FAR into one index (SR–FAR) that had a range from−1 to 1. A positive value (>0) for SR–FAR was expected given that the likelihood of correct warnings is acceptable. Rare events such as floods result in extremely large numbers of no events, which could greatly affect the forecast results. In this study, a no event forecast can provide information to decision makers that allows them to allocate resources to those townships with a higher inundation risk. Equations (3)–(6) do not consider the “no event” scenario in their formulas. The accuracy (ACC) of the model, which is shown in Eq. (7) and is also called the proportion of correct forecasts (Wilks, 2005), is simple and intuitive, and it served as a valuable reference in this study.
Accuracy (ACC)= (7)
Hit+No event
Hit+False alarm+Miss+No event
Figure 5.Location of the island of Taiwan, seven typhoons during 2013–2015, and their observed tracks.
August for 25–48 h; and 08:00, 19 August for 49–72 h. The average impact duration of a typhoon in Taiwan is 73.68 h (Huang et al., 2012). A typhoon has the most impact during the evaluation period (a total of 36 h).
4.1 Original forecast results without a data assimilation technique
Both the typhoon tracks and geography affected the perfor-mance of the rainfall forecasts. Figure 5 shows the observed typhoon tracks, and Fig. 6 compares the forecasted and ob-served tracks for Soulik, Soudelor, and Matmo. The models of the first two typhoons were consistent with the observed tracks, while the third was not; as a result, the performance of rainfall forecasts during the first two typhoons exceeded that of the third typhoon. The causes of the track forecast errors are beyond the discussion of this study. Use of en-semble rainfall forecasts as inputs to produce flood warn-ing forecasts should take into account uncertainties such as track and rainfall forecast errors in numerical weather pre-dictions. Figures 7–9 show the differences between the ob-served and forecasted flood warnings without a data assimi-lation technique over three lead-time periods (1–24, 25–48, and 49–72 h). Tables 3–5 summarize the average ACC, POD and SR–FAR results for different lead-time lengths during the evaluation period. The proposed system provides proba-bilistic forecasts. For example, 50 % flood probability means that at least 10 out of 20 TAPEX members produced rainfall forecasts that met or exceeded the rainfall thresholds. The ap-propriate probability threshold that initiated response actions was discussed. Six probability thresholds (10, 30, 50, 70, 80,
Figure 6.Comparisons of forecasted and observed typhoon tracks
for Soulik (top), Soudelor (middle), and Matmo (bottom): black lines are TAPEX’s ensemble mean forecasted tracks and each black line’s forecasting length is 72 h.
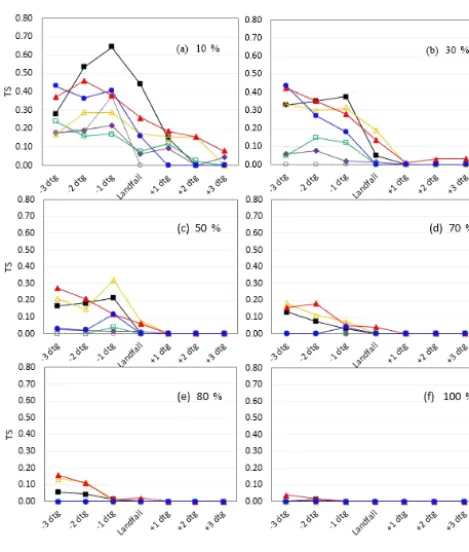
[image:7.612.61.276.65.298.2]Figure 7. Comparisons of TS performance with a 1 to 24 h lead time considering various probability thresholds without a data as-similation technique.
[image:8.612.310.546.66.338.2]scores. A lower probability threshold means a lower inun-dation threshold. Thus, the number of hits increased, but the number of false alarms increased as well. Decision makers generally consider an increased number of actions “in vain” when taking emergency measures based on a low probabil-ity threshold. The higher probabilprobabil-ity thresholds (e.g., a prob-ability threshold >50 %) had lower TSs and indicated that TAPEX ensemble rainfall forecasts were usually underesti-mated in this study. TAPEX’s forecasted tracks had an im-pact on the rainfall forecasts, which affected the accuracy of the inundation forecasting. Soudelor and Soulik had the best performance in terms of TSs. The results for these ty-phoons were consistent with the track forecasts’ performance (Fig. 5). The results also showed that the TS performance decreased after the typhoons made landfall. The period from −3 dtg to landfall is shown in Figs. 7–9. The steep terrain of Taiwan poses a challenge to the vortex initialization in nu-merical weather prediction models. Most current techniques are unable to properly initiate a typhoon vortex near complex terrain, when in reality the typhoons are already well devel-oped at the time of landfall. The typhoons, due to their prox-imity to Taiwan by the time of model initiation, are not well developed in the models because of the terrain. The vortex is initialized near the complex terrain, and the current tech-nique in TAPEX may not perform as well as it does when the vortex is in the open ocean. This introduces errors into the
Figure 8.Comparisons of TS performance with a 25 to 48 h lead
time considering various probability thresholds without a data as-similation technique.
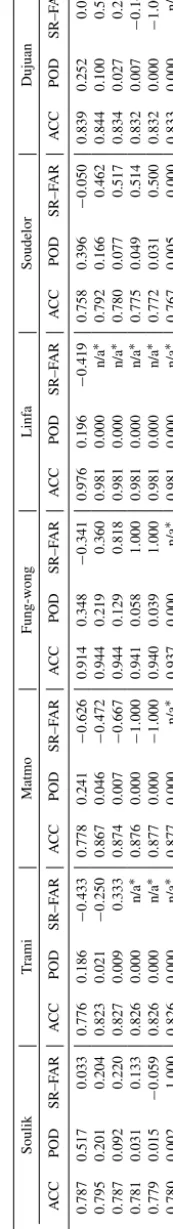
T able 5. A v erage performance with 49 to 72 h lead time during the ev alua tion period for all probability thresholds. % Soulik T rami Matmo Fung-w ong Linf a Soudelor Dujuan A CC POD SR–F AR A CC POD SR–F AR A CC POD SR–F AR A CC POD SR–F AR A CC POD SR–F AR A CC POD SR–F AR A CC POD SR–F AR 10 0.671 0.576 − 0 . 299 0.514 0.573 − 0 . 610 0.483 0.317 − 0 . 835 0.860 0.303 − 0 . 668 0.910 0.188 − 0 . 913 0.761 0.531 − 0 . 024 0.826 0.129 − 0 . 138 30 0.762 0.092 − 0 . 301 0.715 0.219 − 0 . 593 0.771 0.099 − 0 . 814 0.935 0.071 − 0 . 1544 0.978 0.000 − 1 . 000 0.782 0.154 0.248 0.829 0.002 − 0 . 818 50 0.782 0.022 0.333 0.784 0.105 − 0 . 531 0.866 0.017 − 0 . 737 0.937 0.000 − 1 . 000 0.982 0.000 n/a ∗ 0.768 0.040 0.022 0.831 0.000 − 1 . 000 70 0.780 0.000 n/a ∗ 0.821 0.047 − 0 . 245 0.876 0.003 − 0 . 500 0.937 0.000 n/a ∗ 0.982 0.000 n/a ∗ 0.768 0.016 0.059 0.833 0.000 n/a ∗ 80 0.780 0.000 n/a ∗ 0.826 0.021 0.000 0.877 0.003 1.000 0.937 0.000 n/a ∗ 0.982 0.000 n/a ∗ 0.769 0.014 0.333 0.833 0.000 n/a ∗ 100 0.780 0.000 n/a ∗ 0.826 0.000 n/a ∗ 0.877 0.000 n/a ∗ 0.937 0.000 n/a ∗ 0.982 0.000 n/a ∗ 0.767 0.000 n/a ∗ 0.833 0.000 n/a ∗ ∗ n/a means that either F AR or POD had zero v alues in the denominator and cannot be calculated.
Figure 9.Comparisons of TS performance with a 49 to 72 h lead
time considering various probability thresholds without a data as-similation technique.
In general, the SR–FAR scores decreased when the fore-cast lead time increased. However, the results for Soulik were opposite for the 50 % probability threshold and below. The TS was higher when the probability increased by up to 50 % prior to the typhoon making landfall (i.e.,−1 dtg). The num-ber of false alarms decreased when the probability threshold increased. This helped improve the TS at−1 dtg. However, this finding did not hold true when the probability thresh-old was above 70 %. Typhoon Matmo performed worst in terms of SR–FAR scores for the three different lead-time lengths. Figure 5 shows that the forecasted tracks did not co-incide with the observed track. When a typhoon made land-fall, the topography affected the performance of the numer-ical weather models, worsening the performance of the in-undation warning forecasts. All of the results above indicate that the greatest uncertainty in the forecasts appears in the numerical weather predictions, which also has an important impact on other related disaster forecasts.
4.2 Modified forecasts using the data assimilation technique
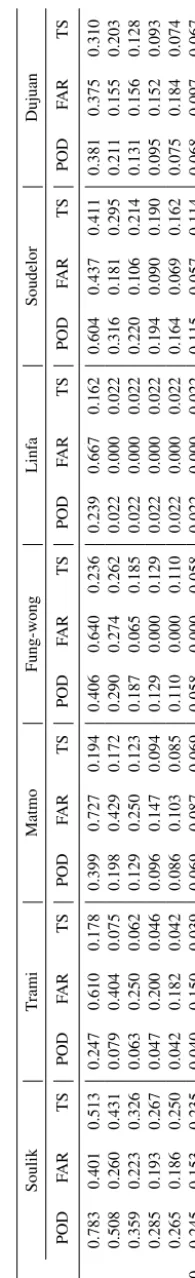
[image:10.612.118.207.106.695.2]de-T able 6. A v erage performance with 1 to 24 h lead time during the ev alua tion period for all probability thresholds using the data assimilation technique. % Soulik T rami Matmo Fung-w ong Linf a Soudelor POD F AR TS POD F AR TS POD F AR TS POD F AR TS POD F AR TS POD F AR TS POD 10 0.783 0.401 0.513 0.247 0.610 0.178 0.399 0.727 0.194 0.406 0.640 0.236 0.239 0.667 0.162 0.604 0.437 0.411 0.381 30 0.508 0.260 0.431 0.079 0.404 0.075 0.198 0.429 0.172 0.290 0.274 0.262 0.022 0.000 0.022 0.316 0.181 0.295 0.211 50 0.359 0.223 0.326 0.063 0.250 0.062 0.129 0.250 0.123 0.187 0.065 0.185 0.022 0.000 0.022 0.220 0.106 0.214 0.131 70 0.285 0.193 0.267 0.047 0.200 0.046 0.096 0.147 0.094 0.129 0.000 0.129 0.022 0.000 0.022 0.194 0.090 0.190 0.095 80 0.265 0.186 0.250 0.042 0.182 0.042 0.086 0.103 0.085 0.110 0.000 0.110 0.022 0.000 0.022 0.164 0.069 0.162 0.075 100 0.245 0.153 0.235 0.040 0.150 0.039 0.069 0.087 0.069 0.058 0.000 0.058 0.022 0.000 0.022 0.115 0.057 0.114 0.068
30 0.26 0.25 0.49 0.19 0.75 0.08
50 0.18 0.18 0.34 0.11 0.72 0.03
70 0.15 0.15 0.29 0.03 0.59 0.01
80 0.14 0.13 0.38 0.01 0.42 0.01
100 0.12 0.11 0.20 0.00 – 0.00
creased the temporal uncertainty of numerical rainfall fore-casts and improved the accuracy of early warning notifica-tions. The longest rainfall threshold duration to trigger an inundation alerts is 24 h in this study. The technique was used to address the gap in forecasted rainfall data with ob-served rainfall information. The absence of forecasted rain-fall values occurred in the first warning period (i.e., 1–24 h). Therefore, this study used the data assimilation technique to improve the 1 to 24 h forecasts. Table 6 shows the modified forecast results compared to the original forecasts. Compared to the results without the hybrid technique, all performance measures’ scores improved significantly. For example, when all typhoons were tested using the original forecasts, the sys-tem performed best during Soulik. Using the hybrid tech-nique, the POD scores improved from 0.517 to 0.783 and from 0.002 to 0.245 for the 10 and 100 % probability thresh-olds, respectively. The TSs improved from 0.293 to 0.513 and from 0.002 to 0.235 for the 10 and 100 % probability thresholds, respectively. The probability threshold represents the number of ensemble members’ forecasted rainfall events that met or exceeded the rainfall thresholds. The hybrid tech-nique forecasts thus support the idea that a higher probabil-ity threshold indicates lower uncertainty in terms of forecast-ing. The FAR and POD scores decreased when the proba-bility threshold increased. Decision-making confidence in-creases when the probability threshold inin-creases and the FAR decreases. Coughlan de Perez et al. (2016) concluded that the likelihood of taking a necessary action when the FAR is lower than 0.5 would satisfy the decision maker’s require-ments for not taking action potentially in vain. Table 6 shows that most of the FAR scores improved to below 0.5 using the hybrid technique. Though these values improved com-pared to previous results, all of the POD scores were still low and continued to decrease when the probability threshold in-creased. The low POD score implies a lower hit rate. To im-prove these values, identifying the accuracy and uncertainty of rainfall forecasts is necessary.
[image:11.612.122.220.90.730.2] [image:11.612.331.525.95.202.2]0.5 when the possibility is greater than 30 % with a lead time of 48 h. Therefore, the system performance meets the requirements of decision makers to take action during ty-phoon events (Coughlan de Perez et al., 2016). However, the system cannot provide acceptable forecasts with a lead time greater than 48 h, regardless of which possibility threshold is selected. This finding limits the use of the system when the lead time is greater than 48 h. The system integrates TAPEX data to obtain forecasted typhoon tracks and rain-fall amounts. However, for some local convections, such as afternoon thunderstorms, the current 5 km spatial resolution of TAPEX might not be sufficient to resolve these weather phenomena as well as it does for much larger-scale weather systems, such as typhoons. These small-scale weather sys-tems pose another limitation to the use of this system.
5 Conclusions
This study proposed an early inundation warning system that integrates ensemble rainfall forecasts and rainfall thresholds. Five rainfall thresholds with different durations were applied. Seven typhoon events during the period 2013–2015 and real inundation alert records from the WRA were used to eval-uate the performance of the system. Five performance mea-sures and a period of 18 h (3 dtg’s) before and after a typhoon made landfall were considered. The system applied ensemble rainfall forecasts and provided probabilistic forecasts. There-fore, six different probability thresholds were considered to trigger the issuance of inundation alerts and calculate vari-ous performance scores. An appropriate probability thresh-old helps decision makers take fewer actions in vain. The re-sults showed that a lower probability threshold had a higher POD score, which is associated with a higher inundation alert detection rate. The downside of a lower probability threshold is a higher FAR score. If the FAR is above 0.5, the system is considered impractical (Coughlan de Perez et al., 2016). Al-though the system performed better before a typhoon made landfall, particularly in terms of TSs, it was still unable to identify the most useful probability threshold for identifying when emergency responders should take various actions. Nu-merical weather predictions were the dominant input influ-encing the forecast results. The system’s performance varied according to the different typhoons tested. In other words, the system cannot maintain a constant level of performance due the temporal and spatial uncertainties in the numerical rain-fall forecasts. Taiwan’s steep terrain also poses a challenge to the vortex initialization in numerical weather prediction models and contributes to the uncertainty inherent in the rain-fall forecasts. In conclusion, the findings of this study suggest that a better forecast is usually produced (1) when the fore-casted typhoon tracks are consistent with the observed tracks and (2) before a typhoon makes landfall.
Finally, the authors developed a data assimilation tech-nique that combined real-time observed and forecasted rain-fall to decrease the uncertainty of numerical weather pdictions and to improve 24 h inundation forecasts. The re-sults showed that the FAR scores decreased when the prob-ability threshold increased. All FAR scores were below 0.5 or less when the probability threshold was 30 % or above. This technique improved the appeal of the early warning sys-tem and generated more valuable forecasts that allowed cision makers to take fewer actions in vain. To further de-crease the uncertainty of numerical weather predictions and improve the performance of inundation forecasts, advanced techniques, such as radar observations and associated data assimilation systems, could be considered in the future. A greater number of extreme weather events are likely in the future due to global climate change. These extreme events will bring high-intensity rainfalls over very short time spans. Radar observations efficiently improve very short-range rain-fall forecasts, which are essential for accurate inundation forecasts. Rainfall thresholds need to be updated to meet the present flood capacity, such as when a new storm sewage system is put in place. After all, decision makers use fore-casted rainfall and threshold-based early warning systems for a high-level overview of flood risk only. Given its advantage of an extended lead time and rapid estimation process, the model presented here is beneficial for emergency deployment to prepare large areas in advance of flooding. For small-area forecasts during a disaster, a complex physics-based model is recommended to replace the threshold-based model and provide detailed information.
6 Data availability
DEMs digital elevation models dtg date–time group dur durations
GFS Global Forecast System EFAS European Flood Alert System FAR false alarm ratio
FFG flash-flood guidance
h hour
km2 square kilometer LST local standard time
m meter
mm millimeter
NCDR National Science and Technology Center for Disaster Reduction NCEP National Centers for Environment Prediction
NCHC National Center for High-Performance Computing NCU National Central University
NTNU National Taiwan Normal University NTU National Taiwan University NWP numerical weather prediction NWS US National Weather Service POD probability of detection
QPFs quantitative precipitation forecasts SR success ratio
TAPEX TAiwan cooperative Precipitation Ensemble forecast eXperiment TS threat score
TTFRI Taiwan Typhoon and Flood Research Institute
Acknowledgements. The authors would like to thank the Water Resources Agency, Taiwan, for providing the rainfall threshold values and the Central Weather Bureau, Taiwan, for providing rainfall observation data.
Edited by: H. Cloke
Reviewed by: two anonymous referees
References
Alfieri, L., Salamon, P., Pappenberger, F., Wetterhall, F., and Thie-len, J.: Operational early warning systems for water-related haz-ards in Europe, Environ. Sci. Policy, 21, 35–49, 2012.
Alfieri, L., Pappenberger, F., and Wetterhall, F.: The extreme runoff index for flood early warning in Europe, Nat. Hazards Earth Syst. Sci., 14, 1505–1515, doi:10.5194/nhess-14-1505-2014, 2014. Badrzadeh, H., Sarukkalige, R., and Jayawardena, A. W.: Hourly
runoff forecasting for flood risk management: application of var-ious computational intelligence models, J. Hydrol., 529, 1633– 1643, 2015.
Barredo, J. I.: Normalised flood losses in Europe: 1970–2006, Nat. Hazards Earth Syst. Sci., 9, 97–104, doi:10.5194/nhess-9-97-2009, 2009.
Carpenter, T. M., Sperfslage, J. A., Georgakakos, K. P., Sweeney, T., and Fread, D. L.: National threshold runoff estimation utiliz-ing GIS in support of operational flash flood warnutiliz-ing systems, J. Hydrol., 224, 21–44, 1999.
Chang, L., Shen, H., Wang, Y., Huang, J., and Lin, Y.: Clustering-based hybrid inundation model for forecasting flood inundation depths, J. Hydrol., 385, 257–268, 2010.
Cheng, C. and Liao, W.: Current situation and sustainability of wa-ter resource in Taiwan, in: Proceedings of 1st Asian Wawa-ter Saving Council Conference, 141–148, 2011.
Cirbus, J. and Podhoranyi, M.: Cellular automata for the flow sim-ulations on the earth surface, optimization computation process, Appl. Math. Inf. Sci., 7, 2149–2158, 2013.
Cloke, H. L. and Pappenberger, F.: Ensemble flood forecasting: a review, J. Hydrol., 375, 613–626, 2009.
Coughlan de Perez, E., van den Hurk, B., van Aalst, M. K., Jong-man, B., Klose, T., and Suarez, P.: Forecast-based financing: an approach for catalyzing humanitarian action based on extreme weather and climate forecasts, Nat. Hazards Earth Syst. Sci., 15, 895–904, doi:10.5194/nhess-15-895-2015, 2015.
Coughlan de Perez, E., van den Hurk, B., van Aalst, M. K., Amuron, I., Bamanya, D., Hauser, T., Jongma, B., Lopez, A., Mason, S., Mendler de Suarez, J., Pappenberger, F., Rueth, A., Stephens, E., Suarez, P., Wagemaker, J., and Zsoter, E.: Action-based flood forecasting for triggering humanitarian action, Hy-drol. Earth Syst. Sci., 20, 3549–3560, doi:10.5194/hess-20-3549-2016, 2016.
Crosta, G. B. and Frattini, P.: Distributed modelling of shallow land-slides triggered by intense rainfall, Nat. Hazards Earth Syst. Sci., 3, 81–93, doi:10.5194/nhess-3-81-2003, 2003.
Dale, M., Wicks, J., Mylne, K., Pappenberger, F., Laeger, S., and Taylor, S.: Probabilistic flood forecasting and decision-making: an innovative risk-based approach, Nat. Hazards, 70, 159–172, 2014.
De Kleermaeker, S., Verlaan, M., Kroos, J., and Zijl, F.: A new coastal flood forecasting system for the Netherlands, Proceed-ings of Hydro 2012 “Taking Care of the Sea”, Rotterdam, the Netherlands, 13–15 November 2012, 135–140, 2012.
Doong, D.-J., Chuang, L. Z.-H., Wu, L.-C., Fan, Y.-M., Kao, C. C., and Wang, J.-H.: Development of an operational coastal flooding early warning system, Nat. Hazards Earth Syst. Sci., 12, 379– 390, doi:10.5194/nhess-12-379-2012, 2012.
Georgakakos, K.: Modern operational flash flood warning systems based on flash flood guidance theory: performance evaluation, International Conference on Innovation Advances and Imple-mentation of Flood Forecasting Technology, Bergen-Tromsø, Norway, 9–13 October 2005, 1–10, 2005.
Georgakakos, K. P.: Analytical results for operational flash flood guidance, J. Hydrol., 317, 81–103, 2006.
Georgakakos, K., Graham, R., Jubach, R., Modrick, T., Shamir, E., Spencer, C., and Sperfslage, J.: Global flash flood guidance system, phase I, Hydrological Research Center, San Diego, CA, HRC Technical Report No. 9, 2013.
Gourley, J. J., Flamig, Z. L., Hong, Y., and Howard, K. W.: Evalu-ation of past, present and future tools for radar-based flash-flood prediction in the USA, Hydrol. Sci. J., 59, 1377–1389, 2014. Gruntfest, E. and Handmer, J. (Eds.): Coping with Flash Floods,
NATO Science Series, Vol. 77, Springer Verlag Science, Dor-drecht, the Netherlands, 243 pp., 2001.
Guzzetti, F., Peruccacci, S., Rossi, M., and Stark, C. P.: Rainfall thresholds for the initiation of landslides in central and southern Europe, Meteorol. Atmos. Phys., 98, 239–267, 2007.
Hallegatte, S.: A cost effective solution to reduce disaster losses in developing countries: hydro-meteorological services, early warn-ing, and evacuation, World Bank Policy Research Working Paper 6058, 2012.
Hallegatte, S., Green, C., Nicholls, R. J., and Corfee-Morlot, J.: Fu-ture flood losses in major coastal cities, Nat. Clim. Change, 3, 802–806, 2013.
Hirabayashi, Y., Mahendran, R., Koirala, S., Konoshima, L., Ya-mazaki, D., Watanabe, S., Kim, H., and Kanae, S.: Global flood risk under climate change, Nat. Clim. Change, 3, 816–821, 2013. Hoedjes, J., Kooiman, A., Maathuis, B., Said, M., Becht, R., Limo, A., and Su, B.: A conceptual flash flood early warning system for Africa based on terrestrial microwave links and flash flood guidance, ISPRS Int. J. Geoinf., 3, 584–598, 2014.
Hsiao, L., Chen, D., Kuo, Y., Guo, Y., Yeh, T., Hong, J., Fong, C., and Lee, C.: Application of WRF 3DVAR to operational typhoon prediction in Taiwan: impact of outer loop and partial cycling approaches, Weather Forecast., 27, 1249–1263, 2012.
Hsiao, L., Yang, M., Lee, C., Kuo, H., Shih, D., Tsai, C., Wang, C., Chang, L., Chen, D. Y., Feng, L., Hong, J., Fong, C., Chen, D., Yeh, T., Huang, C., Guo, W., and Lin, G.: Ensemble forecasting of typhoon rainfall and floods over a mountainous watershed in Taiwan, J. Hydrol., 506, 55–68, 2013.
Huang, J., Yu, C., Lee, J., Cheng, L., Lee, T., and Kao, S.: Linking typhoon tracks and spatial rainfall patterns for improving flood lead time predictions over a mesoscale mountainous watershed, Water Resour. Res., 48, W09540, doi:10.1029/2011WR011508, 2012.
tocol for disaster reduction in Taiwan, 2014 TGIS GeoInformat-ics – UGIS Joint International Conference, Kaohsiung, Taiwan, 25–27 June, 2014.
Lin, G. and Jhong, B.: A real-time forecasting model for the spatial distribution of typhoon rainfall, J. Hydrol., 521, 302–313, 2015. Lin, G., Lin, H., and Chou, Y.: Development of a real-time regional-inundation forecasting model for the regional-inundation warning system, J. Hydroinform., 15, 1391–1407, 2013.
Liu, L., Liu, Y., Wang, X., Yu, D., Liu, K., Huang, H., and Hu, G.: Developing an effective 2-D urban flood inundation model for city emergency management based on cellular automata, Nat. Hazards Earth Syst. Sci., 15, 381–391, doi:10.5194/nhess-15-381-2015, 2015.
López-Trujillo, D.: Real Time Flood Alert System (RTFAS) for Puerto Rico, US Department of Interior, US Geological Survey, 2010.
Martina, M. L. V., Todini, E., and Libralon, A.: A Bayesian deci-sion approach to rainfall thresholds based flood warning, Hydrol. Earth Syst. Sci., 10, 413–426, doi:10.5194/hess-10-413-2006, 2006.
McBride, J. L. and Ebert, E. E.: Verification of quantitative precip-itation forecasts from operational numerical weather prediction models over Australia, Weather Forecast., 15, 103–121, 2000. National Science and Technology Center for Disaster
Reduc-tion, Taiwan (NCDR): Observed flood warnings for typhoons from 2013 to 2015, retrieved from: https://alerts.ncdr.nat.gov.tw/ AlertdataDownload.aspx, 2016.
Nguyen, P., Thorstensen, A., Sorooshian, S., Hsu, K., and AghaK-ouchak, A.: Flood forecasting and inundation mapping using HiResFlood-UCI and near-real-time satellite precipitation data: the 2008 Iowa flood, J. Hydrometeorol., 16, 1171–1183, 2015. OASIS Emergency Management Technical Committee: Common
alerting protocol, v.1.1., Organization for the Advancement of Structured Information Standards (OASIS), Boston, MA, 2005. Pappenberger, F., Beven, K. J., Hunter, N. M., Bates, P. D.,
Gouweleeuw, B. T., Thielen, J., and de Roo, A. P. J.: Cascad-ing model uncertainty from medium range weather forecasts (10 days) through a rainfall-runoff model to flood inundation predic-tions within the European Flood Forecasting System (EFFS), Hy-drol. Earth Syst. Sci., 9, 381–393, doi:10.5194/hess-9-381-2005, 2005.
Posner, A. J. and Georgakakos, K. P.: Soil moisture and precipita-tion thresholds for real-time landslide predicprecipita-tion in El Salvador, Landslides, 12, 1179–1196, 2015.
phy Jr., M. J., and Jubach, R.: Evaluation of real-time flash flood forecasts for Haiti during the passage of hurricane Tomas, 4–6 November, 2010, Nat. Hazards, 67, 459–482, 2013.
Shao, Q., Weatherley, D., Huang, L., and Baumgartl, T.: RunCA: a cellular automata model for simulating surface runoff at different scales, J. Hydrol., 529, 816–829, 2015.
Shi, H., Li, T., Liu, R., Chen, J., Li, J., Zhang, A., and Wang, G.: A service-oriented architecture for ensemble flood forecast from numerical weather prediction, J. Hydrol., 527, 933–942, 2015. Taiwan Typhoon and Flood Research Institute (TTFRI): TAPEX’s
rainfall forecasts for typhoons during 2013 to 2015, retrieved from: https://tf-rat.narlabs.org.tw/member/login/?next=/, 2016. Thielen, J., Bartholmes, J., Ramos, M.-H., and de Roo, A.: The
Eu-ropean Flood Alert System – Part 1: Concept and development, Hydrol. Earth Syst. Sci., 13, 125–140, doi:10.5194/hess-13-125-2009, 2009.
Water Resources Agency, Ministry of Economic Affairs, wan (WRA): Rainfall thresholds for townships in Tai-wan, retrieved from: http://fhy.wra.gov.tw/Pub_Web_2011/Page/ SurveyStationInfos.aspx, 2016.
Wilks, D.: Statistical Methods in the Atmospheric Sciences, 2nd Edn. Elsevier, Burlington, 2005.
Wu, D.: Rainfall threshold values for flood inundation, Workshop on Flood and Drought Prevention and Mitigation, Taipei, Taiwan, 12 April 2012, 2013.
Wu, D. and Wang, Y.: A research on using critical precipitation value for taiwan inundation warning system, in: Proceedings of the 2009 Conference for Disaster Management in Taiwan, Taipei, Taiwan, 19 December, 2009.
Wu, S., Hsu, C., Lien, H., and Chang, C.: Modeling the effect of un-certainties in rainfall characteristics on flash flood warning based on rainfall thresholds, Nat. Hazards, 75, 1677–1711, 2015. Yang, T., Yang, S., Ho, J., Lin, G., Hwang, G., and Lee, C.: Flash
flood warnings using the ensemble precipitation forecasting tech-nique: a case study on forecasting floods in Taiwan caused by typhoons, J. Hydrol., 520, 367–378, 2015.