MODELING AND SIMULATION OF MODAL ANALYSIS-BASED
TECHNIQUE ON UTP DISTRIBUTION NETWORK FOR
EVALUATING HARMONIC RESONANCES
Khairul Nisak M. Hasan and Ahmad Shahir Mohamad
Universiti Teknologi Petronas, Electrical and Electronics Engineering Department, Seri Iskandar, Perak, Malaysia E-Mail: [email protected]
ABSTRACT
Harmonic resonance is one of main concern when dealing with harmonic in an electrical network. Its presence is most likely to cause amplification of harmonics distortion in the system. Numerous techniques had been deployed to reduce the effects of harmonic resonance in power network. Installation of harmonic filters is a common and cheaper solution. However, it is difficult to identify optimum location to install harmonic filter and there is no particular method that can assist the decision. Modal Analysis-based technique was proposed in evaluating resonance in additional to commonly used frequency-scan technique. In modal approach, further evaluation on finding participating factor and sensitivity analysis was carried out to evaluate resonance in the system. In this paper, harmonic resonance mode analysis (HRMA) is presented and evaluated when implemented on several standard test systems including standard IEEE 14-Bus System. It was then implemented on the new academic building network of Universiti Teknologi Petronas (UTP) electrical network. The load flow of the whole network was obtained prior to that to ensure the reliability of data used for HRMA analysis. The frequency scan result was also obtained for the same network. The HRMA plots were compared to the frequency scan results for verification. Sensitivity evaluation in HRMA technique was carried out to determine participation factor of each buses in the network. From these results, HRMA technique was proven to be reliable and provides a simpler way to evaluate the existence of resonance in the system and at the same time indicates which buses are more dominant to a particular resonance. This provides some basis in assisting personnel to decide on the location to mitigate the resonance and it can be used in complement to the frequency scan technique.
Keywords: distribution network, UTP, harmonic resonance, HRMA technique.
INTRODUCTION
Harmonic resonance is one of the main effects of harmonics in power network [1]. Even though the cause of it can be well interpreted, the limitation of the tools in identifying the participating buses or components that causing the phenomenon remains the main issue. The only practical and applicable method at present is probably the frequency scan analysis. Frequency scan analysis calculates the driving point impedance of the bus when the one p.u. of current is injected. Large impedance at certain frequencies indicates harmonic resonance. However, despite its ability to detect and reveal the existence of harmonics, it could not provide specific information on which network components had actually caused the resonance and the best location to place harmonic filters to mitigate the problems [2].
Modal-based approach was introduced to overcome this limitation by evaluating further resonance characteristic [2-5]. The technique, namely harmonic resonance mode analysis has the ability to detect the potential of harmonic resonance as well as the impact of numerous network elements towards resonance [3]. In this method, ways to determine the location or buses that excite resonance was investigated. The resonance characteristics are determined from eigenvalue interpretation. Through the decomposition of admittance
matrix into left and right eigenvector matrices as well as diagonal eigenvalue matrix, the excitability and observability of a particular mode can be identified. Excitability means the tendency of the buses to create or cancel harmonics while observability means the ability to observe the resonance of a particular mode. Right eigenvector reflects the excitability of the bus while left eigenvector gives information on itsobservability. The combination or product of these two eigenvectors forms a participation factor which reveals the location which is the easiest to observe and excite harmonic resonance.
Resonance identification
Frequency scan technique had been recognized as the traditional method to identify resonances in power network. Frequency scan analysis is basically based on the equation of impedance with respect to the function of the frequency itself. Given
[��] = [ �][��], (1)
where f is harmonic order, [Vf] is harmonic
voltage vector, [Zf] is impedance vector while [If] is the
harmonic current vector. To calculate the voltage at the particular harmonic frequency, a one per unit current source is injected at the bus of interest. From (1), voltage is proportional to the impedance. Hence, the curves obtained from the impedance helps to identify the resonance at a particular bus. Peaks assemble parallel resonance while valleys assemble series resonance. Usually the former occurs more regularly compared to the latter.
The modal approach
Harmonic resonance modal analysis
From (1), the equation can be formed to be (2). Given
[��] = [ �][��], (2)
where [Yf] is the system’s admittance matrix at
frequency order, f. [Vf] is the modal voltage while [If] is
the modal current of the system. In this technique, a sharp resonance can be identified through its eigenvalue characteristics. The admittance matrix [Yf] is decomposed
into left and right eigenvectors as follows:
[ ] = [ℒ][⅄][�] , (3)
where [ℒ] is the left eigenvector matrix, [ℒ] is the right eigenvector matrix while [⅄] is the critical eigenvalue matrix. This critical eigenvalue matrix helps to identify the sharp parallel resonance that occurs in a system. Substituting (3) into (2) yields
[ ]−1= [ℒ][⅄]−1[�] ; [ℒ] = [�]−1 (4)
[�⋮1] = [�11⋮ … �⋱ 1⋮ ] [�11⋮ … �⋱ 1⋮ ] [�1
−1 … 0
0 ⋱ 0 ] [�⋮1]
eigenvalues result in higher modal impedance and as it approaching zero, modal impedance become very high reaching to infinity. These high ZM belongs to the point of
very small λ, is called critical mode. The corresponding
frequency of this critical mode is known as the resonant frequency. The plot of ZM versus the frequency is known as the modal impedance plot. From (5), it can be noticed that in the event of resonance at the node i (modei), a small injection of modal current, IMi, results in a very large
modal voltage, VMi. This is experienced only by the node
i, while other modal voltages are not affected due to nature of diagonal eigen-matrix. Due to this, the origin or location of the resonance in modal domain can be identified. It is to note that the resonance here refer to a specific mode and is not totally same as one obtained by frequency scan which relates to injection of current at particular bus.
Participation factors
Author Evaluating eigenvalue sensitivity to the modal impedance able to reveal the contribution of each buses on a specific resonance. Based on (6), eigenvalue sensitivity with respect to the modal impedances can be written as:
���
�� = ∑ �� ��� = �� (6)
Where tki is corresponds to right eigenvector of
kth bus and lik is corresponds to left eigenvector of kth bus
at a mode i. This sensitivity evaluation can also be explained as sensitivity evaluation of the eigenvalue towards the admittance matrix. It can be understood as we rewrite the relation as:
[ ]−1= �
�−1∑ �� � �� (7)
This equation shows the relation of modal impedances and its participation factor, Pki. It means, at a
particular mode i, when the modal current is injected at bus k, the participation factors of bus k to the critical mode
i is characterized by the left and right eigenvector. Basically, participation factor can be calculated as:
��, = ∑ �� � � (8)
Where b is the bus number and m is the mode number. As the PF indicates the contribution of a particular eigenvalue to the Vm - Im sensitivity, the higher
Evaluation on test systems
Several test systems have been tested using both the frequency scan analysis and the harmonic resonance mode analysis technique namely three bus system, five bus system and IEEE 14 bus test system, the standard and the modified system. The three bus system is reported in [] and mainly carried out to evaluate the obvious difference between the techniques. The five bus systems on the other hand highlighted the similarity that both techniques can resemble at certain condition. The two techniques are basically has some relation. In this section, only the five bus system and IEEE 14 bus system were reported. In a modified standard IEEE 14 bus system, some power electronics load were connected at selected buses.
Five bus test system
The codes were built using MATLAB and both the frequency scan analysis and harmonic resonance mode analysis were run to compare its impedance versus frequency graph. For five bus system, the configuration of the network is shown in Figure-1 [6]. It represents a basic test system utilizing a static VAR compensator (SVC) which connected to node 5. Node 1 is considered as the slack node while a capacitor bank of 30 MVAR is connected at node 4. The load is modelled according to
CIGRE’s load model (iii) while the line is represented as a short-line model. The SVC is said to be delta connected and act as a constant harmonic current source. The load flow of the system was carried out before the admittance representation of network was formed which was used for both techniques.
The results for both frequencies scan analysis and harmonic resonance mode analysis impedance vs. frequency graph as shown in Figure-2 and Figure-3, respectively. Both results are almost similar with resonances at 21.3 p.u, 30.9 p.u and 110 p.u were present
but it should be noted that the impedance magnitude in frequency scan is real impedance while modal impedance in HRMA result is derived from the eigenvalue as mentioned in previous section.
Further analysis for HRMA is shown in Table-1 where the critical eigenvalue, critical eigenvectors and the participation factors for the three modes (mode 3, mode 4 and mode 5) were presented. The result reveals that the key participating bus for mode 5 is bus 5 with almost unity participation factor, which indicates why the plotting in both graphs correlates bus 5 and mode 5 at the frequency of 21.3 p.u. For mode 4, a resonance is achieved at 30.9 p.u. and the key participating bus is said to be bus 3 with PF of 0.9872.This is proven by the correlation between the two graphs whereby at 30.9 p.u., both bus 3 and mode 4 achieved a high resonance with almost similar amplitude.
From these results, it proves that there is relationship between the frequency scan analysis method and the harmonic resonance mode analysis method. In certain condition, where one bus element dominates or being the main cause for resonance, the impedance magnitude of frequency scan are identical to the modal impedance.
Figure-1. Five bus test system with SVC.
Figure-3. Modal impedances of the five bus test system.
Table-1. Modal analysis results of the five bus test system.
power are used to conduct the harmonic resonance study. These values are essential to determine load admittance of the network which will determine overall admittance matrix of the network. Formula to determine admittance of the load will be based on CIGRE’s load model (iii).
The same method is implemented on the test system to evaluate the harmonic resonance in the network, which is through the implementation of the frequency scan analysis and the harmonic resonance mode analysis technique.
Figure-4 and Figure-5 shows the frequency scan analysis and the harmonic resonance mode analysis technique for the standard IEEE 14 bus test system. Detail of modal analysis results can be viewed in Table-2.
Table-2. Modal analysis results of the standard IEEE 14 bus test system.
As what can be seen in Figure-7 at 20.0 p.u., there are multiple resonance occurring at that particular frequency. Through the calculation of the participation factor, it can be seen in Figure-8 that the resonance at 20.0 p.u.in mode 4 is caused mainly by bus 4. Mode 4 also indicates that some resonances are occurring at 27.6 and 35.7 p.u. Through the participation factor, the key participating bus involved at 27.6 p.u. is bus 1 while at 35.7 p.u. the bus involved is bus 4. This means that bus 1 and bus 4 has the largest possibilities that the resonance can be excited the most. Hence, controlling these two buses can be crucial in determining the degree of resonance at these particular frequencies. The next test system will show the effects of including several harmonic sources into the network.
Modified IEEE 14 bus test system
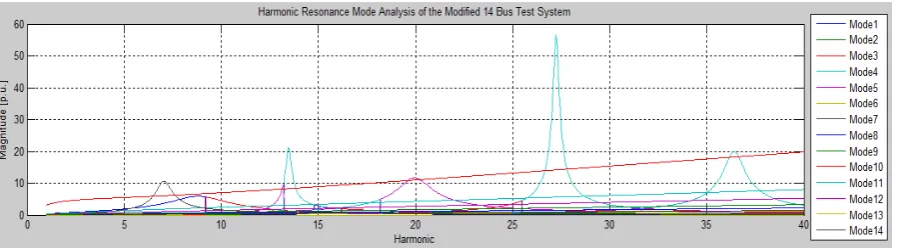
The standard IEEE 14 bus test system is modified whereby harmonic sources are included to show their impacts on the network. The load flow results and branch data are taken from [7] to ensure data reliability and the result was analysed. The code was run and the results can be viewed in Figure-6 and Figure-7. Table-4 shows the modal analysis results of the modified IEEE 14 bus test system.
As can be seen in Figure-7, high resonance involving mode 2, mode 4 and mode 5 occurs as a result of the presence of harmonic sources which are HVDC and SVC. The HVDC is modelled as a two-six pulse converter while the SVC is modelled as a delta-connected TCR. [6] suggested that the impact of the component at bus 8 (SVC) on the network harmonic distortion is smaller compared to bus 3 (HVDC).
It is observed that bus 5 affects the resonance largely at both frequency of 9.1, 9.3 and 19.9 p.u. while bus 3 affects mainly at a frequency order of 13.2 and 13.4 p.u. Bus 8 affects at a lower order of 7.1, while bus 1 and bus 4 affects at a frequency of 27.2 and 36.4, respectively. Due to the reason of investigating the suggestion made in [6], only Bus 3 and Bus 8 is discussed further.
Figure-6.Frequency scans of the modified IEEE 14 bus test system.
[image:6.595.75.524.265.389.2]Figure-7. Harmonic resonance mode analysis result for the modified IEEE 14 bus test system.
Table-3. Modal analysis results of modified IEEE 14 bus test system.
UTP new academic building network
The entire UTP network is basically supported by two 4.2MW Taurus 60 gas turbine generators, which combines to give a total supply of 8.4MW. These two generators are basically situated at the GDC, whereby it will be connected to the main intake substation (MIS) switchgear board. From there, the 11kV voltage will run through the high voltage (HV) board before being stepped down through an 11kV/413V step down transformer to be supplied to the LV board and distributed throughout the
[image:6.595.155.442.445.575.2]Figure-8. Simplified diagram of UTP new academic building network.
Figure-9. Frequency scans analysis of the UTP new academic building network.
Figure-10. Harmonic resonance mode analysis of the UTP new academic building network.
From Figure-9, it can be seen that there are resonances at frequency 21, 183.5, 223.5, 289 and 382 p.u. From the figure itself, it is almost impossible to figure out which buses actually took part in causing the
[image:7.595.87.511.582.684.2]As shown in Figure-10, resonance peaks obtained by using HRMA method are almost similar to the frequency scan technique. In fact, the resonance at 22.5 p.u is more obvious in the latter technique. From this figure, there are three modes that can be observed which are mode 23, mode 24 and mode 25. Only three modes were included as the other modes show less significant to the system compared to these three modes. It can be seen that there are multiple peaks produced by these three modes. Based on the observation, mode 23 produces resonances at frequencies of 189.5 and 228p.u. Mode 24 has the highest number of peaks at which the resonances occur at a frequency of 22.5, 183.5, 223.5, 289 and 382.5 p.u. while mode 25 produces resonance at 220 p.u. frequency. These modes can be further analysed to determine their participation factors which can determine the key participating buses that actually influence the resonance in the network.
From Table-4, it can be observed through the participation factor that bus 15 has the most potential to observe and excite resonance in the network at a frequency of 22.5, 183.5, 189.5 as well as 223.5 p.u. Through frequency scan analysis method; there is several numbers of buses which contributes to resonance at those particular frequencies. Through the computation of modal based technique, the highest observability and excitability of resonance can be found at bus 15. Hence, in order to mitigate resonance at 22.5 p.u, bus 15 is the most suitable. Installation of harmonic filter to damp the resonance should be placed at this point.
Furthermore, resonances higher than 100.00 p.u can be disregards as they are most unlikely to cause severe distortion in the network. However, should these resonances are considered, it can be seen that it involve bus 9, 11, 24 and 27 at their respective resonant frequencies. From this information, it can be acknowledged that observing the resonance through these buses can be the key to mitigate further resonance implications. This is due to the fact that these buses also have the highest excitability to produce the highest resonance in this network.
Table-4. Modal analysis of UTP new academic building network.
Hence, by observing the conditions at these two buses, the critical resonance that is occurring through the UTP new academic building can be observed and further analysed. Consideration on reducing the effects of harmonic resonance at that particular frequency by placing harmonic filters can be a good idea but again the planning need to be precise as misplacing the filters can affect other components in the network.
The result obtained is reflected in the measurement of harmonic carried out at several locations in the new academic building network. The measurement was carried out prior to this study but can be as a reference. The THD current measured is on the high side at 2 academic building while the THD voltage measured are within permissible limit. However, since UTP has designed the cables to be large enough, the slightly high harmonic current does not affect the performance. However, further measurement with a recent network need to be carried out.
DISCUSSION AND CONCLUSIONS
From the results obtained, it can be concluded that resonance actually occurs through specific mode whereby the mode can be determined through the smallest/ critical eigenvalue of the admittance matrix of the network. It is difficult to know which bus actually can be excited the most when being injected with harmonic current. Hence, by examining and identifying the key participating bus through the participation factor can helps to solve this problem. The bus with the largest participation factor has the highest observability and excitability of resonance. This can be calculated through the left and right eigenvectors whereby the product gives the centre occurrence of resonance.
From the work, it can be concluded that modal-based approach can be used in complement of frequency-scan technique. In the case where dangerous or harmful resonant points detected, a further analysis using the harmonic resonance mode analysis technique can be made. Unlike frequency scan analysis which its peak does not always corresponds to the true resonance frequency, harmonic resonance mode analysis helps to solve this drawback though providing necessary information on revealing the critical modes and the area to be affected.
ACKNOWLEDGEMENT
REFERENCES
[1] A. Frobel, and R. Vick, “Chosen aspects for harmonic analysis in distribution networks,” presented at 22nd International Conference and Exhibition on Electricity Distribution.
[2] Z. Huang, Y. Cui, and W. Xu, “Application of modal sensitivity for power system harmonic resonance analysis,” IEEE Trans, Power Syst, vol. 22, no. 1, pp. 222-231.
[3] W. Xu, Z. Y. Huang, Y. Cui, and H. Z. Wang, “Harmonic Resonance Mode Analysis,” IEEE Trans. Power Del., vol. 20, pp. 1182-1190.
[4] M. Esmaili, H. A. Shayanfar, and A. Jalilian, “Modal analysis of power systems to mitigate harmonic resonance considering load models,” J. Energy, vol. 33, no. 9, pp. 1361-1368.
[5] K. N. M. Hasan, K. Rauma, P. Rodriguez, J. I. Candela, and A. Luna, “Harmonic Compensation Analysis in Offshore Wind Power Plants Using Hybrid Filters,” IEEE Transactions on Industry Application, vol. 50, no. 3, pp. 2050-2060.
[6] E. Acha, and M. Madrigal, “Power System Harmonics Computer Modelling and Analysis”, Chichester: Wiley.
[7] IEEE Task Force on Harmonics Modeling and Simulation, “Modelling and Simulation of the Propagation of Harmonics in Electric Power Networks: Part I,” IEEE Trans. Power Del., vol. 11, no.1, pp. 466-474.
[8] H. Zhou, Y. Wu, S. Lou, and X. Xiong, “Power System Series Harmonics Resonance Assessment Based on Improved Modal Analysis,” IU-Journal of Electrical and Electronics Engineering, vol. 7, no. 2, pp. 423-430.
[9] A. Medina, J. Segundo, P. Ribeiro, W. Xu, K. L. Lian, G. W. Chang, V. Dinavahi, and N. R. Watson, “Harmonic Analysis in Frequency and Time Domain,” IEEE Trans. Power Del., vol. 28, no. 3, pp. 1813-1821.
[10]IEEE Task Force on Harmonics Modeling and Simulation, “Modeling and Simulation of The Propagation of Harmonics in Electric Power
Networks: Part II,” IEEE Trans. Power Del., vol. 11, no. 1, pp. 466-74.
[11]Z. Y. Huang, W. Xu and V. R. Dinavahi, “A practical harmonic resonance guideline for shunt capacitor applications,” IEEE Trans. Power Del., vol. 18, pp. 1382-1387.