Georgia State University Georgia State University
ScholarWorks @ Georgia State University
ScholarWorks @ Georgia State University
Finance Dissertations Department of Finance
Fall 1-12-2012
Agency Problems in Target-Date Funds
Agency Problems in Target-Date Funds
Vallapuzha Sandhya
Georgia State University
Follow this and additional works at: https://scholarworks.gsu.edu/finance_diss
Part of the Finance and Financial Management Commons
Recommended Citation Recommended Citation
Sandhya, Vallapuzha, "Agency Problems in Target-Date Funds." Dissertation, Georgia State University, 2012.
https://scholarworks.gsu.edu/finance_diss/19
PERMISSION TO BORROW
In presenting this dissertation as a partial fulfillment of the requirements for an advanced
degree from Georgia State University, I agree that the Library of the University shall make it
available for inspection and circulation in accordance with its regulation governing materials
of this type. I agree that permission to quote from, to copy from, or publish this dissertation
may be granted by the author or, in her absence, the professor under whose direction it was
written or in his absence, by the Dean of the Robinson College of Business. Such quoting,
copying, or publishing must be solely for the scholarly purposes and does not involve potential
financial gain. It is understood that any copying from or publication of this dissertation which
involves potential gain will not be allowed without permission of the author.
NOTICE TO BORROWERS
All dissertations deposited in the Georgia State University Library must be used only in
accordance with the stipulations prescribed by the author in the preceding statement.
The author of this dissertation is:
Vallapuzha Sandhya
Department of Finance
Georgia State University
35, Broad Street, Suite 1229
Atlanta, GA 30303-3083
The director of this dissertation is:
Dr. Vikas Agarwal
Department of Finance
Georgia State University
35, Broad Street, Suite 1207
AGENCY PROBLEMS IN TARGET-DATE FUNDS
BY
VALLAPUZHA VAIDYANATHAN SANDHYA
A Dissertation Submitted in Partial Fulfillment of the Requirements for the Degree
Of
Doctor of Philosophy
In the Robinson College of Business
Of
Georgia State University
GEORGIA STATE UNIVERSITY
ROBINSON COLLEGE OF BUSINESS
Copyright by
Vallapuzha Vaidyanathan Sandhya
ACCEPTANCE
This dissertation was prepared under the direction of the Vallapuzha Vaidyanathan Sandhya’s
Dissertation Committee. It has been approved and accepted by all members of that committee,
and it has been accepted in partial fulfillment of the requirements for the degree of Doctoral
of Philosophy in Business Administration in the J. Mack Robinson College of Business of
Georgia State University.
H. Fenwick Huss, Dean
DISSERTATION COMMITTEE
Dr. Vikas Agarwal (Chair)
Dr. Gerald Gay
Dr. Jayant Kale
ACKNOWLEDGEMENT
I thank Vikas Agarwal, Jonathan Berk, Douglas Blackburn, Michael Brennan, Conrad
Ciccotello, Gerry Gay, Lixin Huang, Narasimhan Jegadeesh, Jayant Kale, Omesh Kini, Yee
Cheng Loon, Brigitte Madrian, Reza Mahani, Pedro Matos, Olivia Mitchell, David Musto,
Theo Nijman, Andy Puckett, Chip (Harley) Ryan, Vijay Singal, Laura Starks, Paula Tkac,
Isabel Tkatch, Marno Verbeek, Luis Viceira and the seminar participants at Georgia State
University, University of Tennessee, Chicago Quantitative Alliance Annual Fall Conference,
NETSPAR International Pension Workshop, and FMA Doctoral Consortium at New York
for helpful discussions and comments. I am grateful for generous financial support from
NETSPAR (an independent network for research on pensions, aging and retirement in
the Netherlands) and CEAR (a research center for economic analysis of risk promoted by
Robinson College of Business in partnership with Andrew Young School of Policy Studies
ABSTRACT
Agency Problems in Target-Date Funds
BY
Vallapuzha V. Sandhya
November 14, 2011
Committee Chair: Dr.Vikas Agarwal
Major Academic Unit: Department of Finance
Target-Date Funds (TDFs) facilitate retirement planning by varying asset allocation over
time with the goal of reducing portfolio risk. We explore potential agency problems in TDFs
by examining their return performance and flow-performance relation. We find that TDFs
under-perform balanced funds (BFs) which are also approved as a default option along with
TDFs in 401(k) plans with automatic enrollment. We show that the under-performance is
driven by TDFs that have a fund-of-fund structure and constituent funds with high expense
ratios or poor performance within the fund family. Additionally, we discover an absence of
flow-performance relation in TDFs while BFs exhibit the convex flow-performance relation
shown for mutual funds. Our evidence suggests the presence of agency problems in TDFs
arising from investor inertia, weak incentives for fund managers to outperform peers, and
Agency Problems in Target-Date Funds
“Of all the issues that the SEC is examining at the moment, our review of target date funds
is one that may most directly affect everyday Americans . . . ”
- Mary Schapiro,
Chair, Securities and Exchange Commission, at the public hearing on Target-Date Funds
and other similar investment options, held on June 18, 2009.
1.
Introduction
Target-Date Funds (TDFs) are popular retirement investment vehicles that follow a
predetermined schedule for rebalancing their mix of equity and fixed-income securities over
time. Pension Protection Act (PPA) of 2006 resulted in widespread adoption of TDFs as the
default option in 401(k) plans with automatic enrollment.1 This paper provides evidence of
agency problems in TDFs that arise when economic agents are not properly incentivized or
when agents face conflicts of interest while executing their duties to principals. Provision of
incentives in the case of mutual funds can be in the form of greater (lower) flows following
good (poor) performance while conflicts of interest manifests through self-dealing. Our
findings raise questions regarding the suitability of TDFs as a default option in 401(k) plans.
In the first part of the paper focusing on incentives facing the TDFs, we study the
flow-performance relation and find that flows do not respond to past flow-performance suggesting
1Among plans with automatic enrollment, 87% administered by Vanguard and 96% by Fidelity used
that retirement plan participants neither reward nor punish TDFs.2 This, in turn, seems to
indicate lack of incentives for TDFs to provide superior performance for their investors. In
contrast to TDFs, balanced funds (BFs), which are also approved but are not as widely used
as default option in 401(k) plans, exhibit convex flow-performance relation indicating that
its investors chase performance. The test of relative performance shows that TDFs trail BFs
by 48 (86) basis points annually based on risk-adjusted net-of-fee (gross-of-fee) performance.
In the second part of the paper, we examine different subgroups within TDFs to show
that the subgroup with the greatest scope for conflicts of interest under-performs the rest.
TDFs structured as Single Funds (SF) invest directly in stocks and bonds while those with
the fund-of-fund (FOF) structure either invest in other mutual funds within the same fund
family (InternalFOF) or in funds outside the family (ExternalFOF). Of the three structures,
Internal FOFs are likely to have the greatest potential for conflicts of interest. In particular,
they may choose to include funds with high expense ratios to increase revenues to the family.
Alternately, they may include funds with poor performance and/or low flows to sustain funds
that may be less marketable. Why would plan sponsors who have the fiduciary responsibility
allow this? A possible explanation stems from their own conflicts of interest due to a
desire to secure votes in favor of management on shareholder proposals and the prospect
to overweight securities of the firm in institutional portfolios (e.g., Davis and Kim, 2007;
Cohen and Schmidt, 2009). In this study, we do not attempt to distinguish between the
roles played by the plan sponsor and the fund family. Thus, TDFs with the Internal FOF
2Plan participants’ failure to punish poor performance is consistent with the evidence shown in prior
structure appear to face the greatest potential for agency problems in the principal-agent
relation. We investigate the relative performance of the three sub-categories of TDFs and find
that the Internal FOFs under-perform SFs by 58 (132) basis points and ExternalFOFs by
55 (63) basis points based on risk-adjusted net-of-fee (gross-of-fee) performance. In contrast,
External FOFs perform at par with the SFs.
In the third part, we provide further evidence suggestive of the channels for the manifestation
of agency problems using the holdings of TDFs with the FOF structure obtained from the
N-Q, N-CSR, and N-CSRS filings mandated by the Securities and Exchange Commission
(SEC). We find that among funds that are constituents of TDFs, those with higher expense
ratios or lower performance have a greater probability of inclusion in anInternalFOF than in
anExternalFOF. Similarly, among funds that belong to a family that offers TDFs with the
Internal FOF structure, once again funds with higher expense ratios or lower performance
have a greater probability of inclusion in their TDFs. Our results are robust after controlling
for family and fund characteristics and to other specifications including estimation of alphas
over different horizons, alternate definition of expense ratios, trends over time, and variations
in asset allocation. Furthermore, we perform bootstrap simulations using residual and factor
resampling approach of Kosowski, Timmermann, Wermers, and White (2006) to show that
the documented under-performance is not attributable to sampling variability.
Overall, the findings in this paper have important policy implications as retirement
monies are defaulted into TDFs following their approval as Qualified Default Investment
Alternative (QDIA) in 401(k) plans. During the financial crisis in 2008, investors close to
retirement lost anywhere between 3.6% and 41% among the 31 TDFs with 2010 Target Date.3
The loss prompted a joint public hearing by the SEC and the Department of Labor (DOL)
3Speech by Mary Schapiro, Chair of SEC, at the hearing on TDFs held on June 18, 2009. A transcript
leading to a regulation that requires prominent display of asset allocation in the marketing
material for TDFs. While the regulation helps in alleviating the ignorance of investors, it falls
short of addressing the potential agency problems highlighted in this paper. The findings in
our paper point to a conceivable solution that comes from understanding the difference in
the flow-performance sensitivity of BFs and TDFs resulting from their investor bases. While
TDFs are almost exclusively used by retirement investors, a major portion of BFs’ assets are
held outside retirement plans.4 Our results indicate that opening TDFs to non-retirement
accounts whose investors are performance sensitive, as is the case with BFs, may help bridge
the gap in performance of TDFs relative to BFs. In addition, closer attention could be paid
to the holdings of TDFs with the Internal FOF structure where the mutual fund families
might face conflicts of interest and therefore, may not always make investment decisions in
the best interest of their shareholders.
The remainder of the paper is organized as follows. Section 2 presents the related
literature and hypotheses. Section 3 describes the data and variables. Section 4 provides
evidence on lack of flow-performance sensitivity in TDFs followed by a discussion of the
tests of under-performance. Section 5 performs a battery of robustness checks and Section 6
concludes.
2.
Related literature and Hypotheses Development
This paper contributes to several strands of the finance literature. First, theoretical
studies analyze the life-cycle model of consumption and portfolio choice by introducing
con-4According to a report by the Investment Company Institute, 88% of TDF assets were held in retirement
accounts in the year 2007 compared to 46% of balanced fund assets. See The US retirement market, 2007
straints faced by an aging investor and deviations from the mean-variance framework (e.g.,
Bodie, Merton, and Samuelson, 1992; Viceira, 2001; Cocco, Gomes, and Maenhout, 2005;
Gomes and Michaelides, 2005; Benzoni, Collin-Dufresne, and Goldstein, 2007; Polkovnichenko,
2007; Gomes, Kotlikoff, and Viceira, 2008; Viceira, 2009; Chai, Horneff, Maurer, and Mitchell,
2009; Poterba, Rauh, Venti, and Wise, 2009; Koijen, Nijman, and Werker, 2010). In
par-ticular, Bodie and Treussard (2007) evaluate the choice of TDFs in retirement plans and
conclude that they are not appropriate for risk averse investors or for those who have a high
exposure to market risk through their human capital. Although TDFs are gaining popularity
among investors, empirical research on these funds is still in its infancy. In their pioneering
work, Mitchell, Mottola, Utkus, and Yamaguchi (2007) study the impact of inclusion of TDFs
in 401(k) plans of a single provider and find that TDFs reduce the problem of extreme asset
allocation and idiosyncratic portfolio risk. Ours is the first empirical study examining the
cross-sectional variations in the return performance as well as the flow-performance relation
of TDFs.
Second, we contribute to the strand of literature that pertains to investor behavior in
retirement plans which provides evidence that plan participants are passive (e.g., Madrian
and Shea, 2001; Agnew, Balduzzi, and Sunden, 2003; Choi, Laibson, Madrian, and Metrick,
2006; Mitchell, Mottola, Utkus, and Yamaguchi, 2006; Benartzi and Thaler, 2007) and lack
financial literacy (e.g., Hilgert, Hogarth, and Beverly, 2003; Lusardi and Mitchell, 2006,
2007a,b,c). Inertia among retirement plan participants provides captive investors leading to
potential agency problems in TDFs.
Third, we contribute to the flow-performance literature on mutual funds that documents
a convex relation between flows and past performance resulting in competition amongst
managers to outperform their peers (e.g., Chevalier and Ellison, 1997; Sirri and Tufano,
it has been shown that fund flows are affected by factors like advertising (e.g., Jain and
Wu, 2000; Gallaher, Kaniel, and Starks, 2005; Barber, Odean, and Zheng, 2005), spill over
effects from star funds (e.g., Nanda, Wang, and Zheng, 2004), name changes (e.g., Cooper,
Gulen, and Rau, 2005), and investors’ participation costs (e.g., Huang, Wei, and Yan, 2007)
to name a few. Flow-performance relation among pension funds is analyzed by Guercio
and Tkac (2002) who find that the relation is approximately linear as pension funds punish
poorly performing managers and do not disproportionately flock to winners. Given the
inertia among retirement plan participants, they are unlikely to punish poor performance
by withdrawing capital or reward good performance with more capital infusion. Hence, we
hypothesize that flows to TDFs should be unrelated to their past performance.
Finally, we contribute to the literature dealing with the agency issues in delegated
portfolio management. Some of the problems analyzed in extant literature are risk-shifting
(e.g., Brown, Harlow, and Starks, 1996; Chevalier and Ellison, 1997; Blake, Elton, and
Gruber, 2003; Hu, Kale, Pagani, and Subramanian, 2011), window dressing (e.g., Lakonishok,
Shleifer, Thaler, and Vishny, 1991; Carhart, Kaniel, Musto, and Reed, 2002; He, Ng, and
Wang, 2004; Ng and Wang, 2004; Meier and Schaumburg, 2004; Agarwal, Gay, and Ling,
2011), career concerns (e.g., Chevalier and Ellison, 1999; Brown, Goetzmann, and Park,
2001), and churning of assets (e.g., Allen and Gorton, 1993; Dow and Gorton, 1997). While
the above studies focus on issues at the fund level, Khorana and Servaes (1999), Massa (2003),
Gaspar, Massa, and Matos (2006), Guedj and Papastaikoudi (2008), and Cici, Gibson, and
Moussawi (2010) study the “strategic” decisions made in the interests of the fund family.
Given that mutual funds manage 52% of defined contribution (DC) plan assets, it is
important for fund families to attract retirement plan sponsors.5 In this context, Davis
5The US retirement market, 2007 http://www.ici.org/pdf/fm-v17n3.pdf - A report by Investment
and Kim (2007) argue that fund families may not demand good corporate governance from
firms whose 401(k) plans they manage while Cohen and Schmidt (2009) find that mutual
fund families that act as trustees systematically overweight the sponsor firms’ stock in the
families’ funds. Hence, it is conceivable that plan sponsors might benefit from favorable
voting as well as overweighting of the firm’s stock in return for letting plan trustees include
under-performing or high-fee funds in TDFs offered in the 401(k) plan. Passive principals
coupled with conflicted agents suggest that TDFs may be prone to agency problems. A
natural baseline to measure the performance of TDFs is provided by BFs.6 On one hand,
BFs are an alternate choice available to plan sponsors as QDIA and have a similar investment
universe but are less susceptible to agency problems mentioned above as they are widely used
outside retirement plans. If agency problems affect the performance adversely, we expect
TDFs to under-perform BFs. On the other hand, BFs differ from TDFs in that their asset
allocation is fixed during inception while managers of TDFs need to rebalance the allocation
from time to time based on the glide path (predetermined asset allocation schedule). If
investors are willing to pay a price for this additional service, it may be reflected as lower
expected returns. Hence, we hypothesize that TDFs should under-perform BFs on the basis
of risk-adjusted performance.
To disentangle the two explanations for the underperformance of TDFs, we first divide
TDFs into two groups, funds that invest in other mutual funds (FOFs) and those that invest
in stocks, bonds, and other asset classes (SFs).7 Next, we compare the performance of each
group with that of BFs. If the under-performance is due to time-varying reallocation of
assets, we expect both sub-categories of TDFs to under-perform BFs. Thus, we can rule out
6Similar comparison is made by Gomes, Kotlikoff, and Viceira (2008).
7Funds with SF structure might invest a small portion (less than 20%) of their assets in money market
time-varying reallocation of assets as the cause of under-performance if any one of the
sub-categories of TDFs under-performs BFs. If the under-performance is due to the potential
for conflicts of interest, we expect TDFs with the FOF structure to under-perform as this
structure is likely to provide discretion to include funds that increase revenues to the family
or redirect flows as desired. However, there are two other factors that may cause the
under-performance. Firstly, diversification across managers, a feature offered by TDFs with the
FOF structure may lower expected returns. Secondly, FOFs charge dual layer of fees which
may also reduce the net-of-fee returns. Hence, we hypothesize that TDFs with the FOF
structure should under-perform BFs while TDFs with the SF structure should perform at
par with BFs.
To disentangle the cause of under-performance of TDFs with the FOF structure, we
further analyze their subcategories. While some FOFs invest in funds offered by their own
family (Internal FOFs), others invest in funds from other families (External FOFs).8 Few
studies have examined the FOFs in the hedge fund industry (e.g., Brown, Goetzmann, and
Liang, 2002; Agarwal and Kale, 2007; Ang, Rhodes-Kropf, and Zhao, 2008) while the FOF
structure in mutual funds is largely unexplored with the exception of Bhattacharya, Lee, and
Pool (2010). If diversification across managers causes the under-performance, TDFs with
Internalas well asExternalFOF structure should under-perform those with the SF structure.
However, if dual layer of fees causes the under-performance, TDFs with Internal as well as
External FOF structure should under-perform those with the SF structure in the net-of-fee
but not in the gross-of-fee specification. However, if one of them under-performs SFs while
the other does not, then the under-performance is not attributable to diversification across
8Apart fromExternalandInternalFOFs, there are a few funds that invest in funds within the family as
funds or dual layer of fees.9
A TDF with the FOF structure may choose to invest internally due to informational
advantages or due to the flexibility to move assets across funds with minimal transaction
costs. Elton, Gruber, and Green (2007) find that investors who confine their investments
to a single fund family tend to have more risky portfolios than if they select similar funds
across different families. Another explanation for internal investing could be that it provides
greater scope for “strategic” decision making. For instance, fund families may choose
constituent funds with high expense ratio or redirect flows to funds within their stable
that are experiencing poor performance or low flows. If the costs associated with “strategic”
selection in the case of Internal FOFs exceed the benefits in the form of lower transaction
costs, InternalFOFs should under-performExternalFOFs which forms our next hypothesis.
To find direct evidence of agency problems, we examine the constituent funds ofInternal
FOFs and compare them with other funds within the family as well as the constituents of
External FOFs.10 If agency problems distort the selection process of constituent funds of
Internal FOFs, we hypothesize that constituent funds of Internal FOFs would have higher
expense ratios or lower performance or lower flows compared to other funds in the family or
those selected for ExternalFOFs.
9Systematic differences in asset allocation cannot explain the under-performance as we compare
risk-adjusted performance after explicitly controlling for differences in asset allocation.
10Gaspar, Massa, and Matos (2006) argue that from a family’s perspective, expected assets are higher
3.
Data and variable construction
We describe the data sources for our analyses and explain the main variables in this
section.
3.1.
Data Description
The main source of data for our paper is the survivor-bias-free mutual fund database
from the Center for Research in Security Prices (CRSP). While we identify BFs using the
Lipper objective code provided by CRSP, we use the target year in the fund’s name to
identify TDFs and ensure that they vary the equity/bond allocation along the glide path.
To analyze the constituent funds of TDFs with the FOF structure, we collect data from
Securities and Exchange Commission’s (SEC) quarterly filings (N-Q, N-CSR, N-CSRS) in
which the funds are required to provide a complete list of their holdings. We merge our
dataset with CRSP mutual fund database using fund names to obtain fund characteristics.
Consistent with Wermers (2000), we combine the characteristics of the share classes to obtain
the corresponding characteristic of the fund using the weighted averages in which the weights
are based on the assets in each share class. For this study, we consider the entire universe of
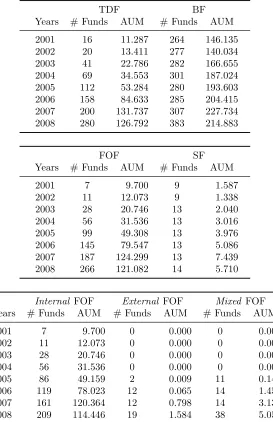
TDFs over the period January 2001 to December 2008 when the number of funds grew from
16 to 280 resulting in over 3,100 fund-quarter observations.
From the top panel of Table 1, we can see that the assets under management (AUM)
of TDFs experienced a 11-fold increase from $11.29 billion to $126.79 billion while BFs
experienced a modest increase. At year-end 2007, more than two-thirds of 401(k) plans in
the EBRI/ICI database included TDFs in their investment menu.11 From the middle panel,
we can see that TDFs with the FOF structure grew phenomenally from $9.70 billion to
$121.08 billion while TDFs with the SF structure grew marginally during the same period.
The bottom panel shows the growth of Internal FOFs from $9.70 billion in 2001 to $114.45
billion in 2008 and ExternalFOFs from $9.00 million in 2005 to $1.58 billion in 2008. Thus,
it is clear that the growth of TDFs is largely attributable to TDFs with the Internal FOF
structure.
3.2.
Key Variables
To analyze the flow-performance relation, we follow Sirri and Tufano (1998) and define
N etF lows for fund i in quartert as
N etF lowsit=
AU Mit−AU Mit−1∗(1 +Rit)
AU Mit−1
, (1)
where AU Mit is the assets under management of fund i in quarter t and Rit is the return
of fund i in quartert. Another important variable in our study isfund performance. While
it is the dependent variable for a majority of tests, we use it as an explanatory variable in
the flow-performance analysis. To measure performance, we use the risk-adjusted net-of-fee
return (alpha) obtained using an extension of Carhart (1997) four-factor model. While the
Carhart (1997) model has been used to measure the performance of domestic equity funds,
it may not be appropriate for TDFs as they also invest in bonds and international equity
(e.g., Comer, 2006; Blake, Elton, and Gruber, 2006). Failure to control for this additional
exposure attributes the excess return earned by these asset classes to alpha.
We use excess returns on Barclay’s Capital U.S. Aggregate index and MSCI EAFE
benchmarks for bond and international equity components of their portfolios.12 Thus, our
first performance measure for a fund in a given sub-period is the alpha estimated using the
following model:
ri,t =αi+β1,iM KT RFt+β2,iSM Bt+β3,iHM Lt+β4,iU M Dt+β5,iBON Dt+β6,iIN T EQt+i,t
(2)
whereri,t is the excess return earned by fundiin monthtandM KT RFtis the value-weighted
return on all NYSE, AMEX, and NASDAQ stocks minus the one-month Treasury bill rate for
month t. Additionally, SM Bt, HM Lt, and U M Dt refer to the returns on value-weighted,
zero-investment, factor-mimicking portfolios for size, book-to-market equity, and one-year
momentum in stock returns respectively. BON Dt is the return on the Barclay’s Capital
U.S. Aggregate index minus the one-month Treasury bill rate for month t, and IN T EQt is
the return on the MSCI EAFE index minus the one-month Treasury bill rate for month t.
Since our study spans a period of eight years, computing a single alpha for the whole period
might be too restrictive as it forces the funds to have constant betas over a long period.
Hence, we split the data into four time periods of two years each, estimate alphas using 24
month intervals, and run a panel regression by pooling observations in the four periods.13
A frequently cited critique of alphas is the questionable accuracy of the underlying asset
pricing model. An alternate measure of performance used in literature is the Sharpe ratio.
For each fund, we calculate the monthly Sharpe ratio for a given year by dividing the average
monthly excess returns by their standard deviation and subsequently annualize it. While
12Blake, Elton, and Gruber (2007) use a similar multifactor model except for the momentum factor to
measure the performance of stock mutual funds that have exposure to bonds and international equity.
13In specifications involvingExternalandMixedFOFs, we are restricted to using only the last four years
the six-factor alpha measures the risk-adjusted returns based on our asset pricing model,
Sharpe ratio measures the same by defining risk as the volatility of fund returns. Although,
this measure is useful to an investor that is not fully diversified, one must keep in mind that
Sharpe ratio can be inflated by reducing the volatility of returns. For robustness, we repeat
our analysis using risk-adjusted gross-of-fee performance measures. As CRSP mutual fund
database reports the net-of-fee returns, we add the expense ratios to estimate the gross-of-fee
returns. Additionally, in untabulated tests, we repeat our analysis using alphas estimated
over 18 and 36 month intervals and obtain qualitatively similar results.
3.3.
Control Variables
Our control variables based on extant literature are expense ratio (percentage of fund
assets paid for operating expenses, management fees, and 12B-1 fees excluding sales charges),
age (number of years since inception), turnover ratio (ratio of minimum of purchases and
sales made by the fund to the total assets under management), and AUM (dollar value of
assets in fund’s portfolio). Since age and AUM are known to have skewed distributions,
we take the logarithm of these variables. In the case of TDFs with the FOF structure,
the expense ratio as reported in CRSP does not include the fees paid to constituent funds.
Similarly, the turnover ratio as reported in CRSP understates the actual turnover as it does
not include the turnover of the underlying funds. Hence, we augment the values of expense
ratio and turnover ratio with the corresponding average values of the constituent funds.
To control for family effects, we include the total AUM of the family as an independent
variable. We also include the proportion of assets invested in bonds as an additional variable
to control for differences due to the asset allocation that may not be captured by our bond
factor. Finally, as our data have panel structure, we allow for clustering of standard errors
4.
Empirical Results
In this section, we examine the potential for agency problems in TDFs by analyzing
the flow-performance relation of TDFs and BFs. Since TDFs are targeted at retirement
investors who may be passive or captive, they are unlikely to reward good performance or
punish poor performance. This inaction implies that in the case of TDFs, flows may be
unrelated to performance. BFs on the other hand are not primarily targeted at retirement
plan participants. Moreover, despite being approved as QDIA, they are not prevalently used
as the default instrument. Given that they are chosen by active investors similar to those
investing in open-end mutual funds, we expect their flow-performance relation to be similar
to that of equity funds.
4.1.
Analysis of Flow-Performance Relation
While Sirri and Tufano (1998) focus on equity funds, we extend the analysis to TDFs and
BFs. To evaluate fund performance for each quarter, we use the prior 24 monthly returns
of a fund and estimate its alpha using the six-factor model as explained in Section 3.2. For
our univariate analysis, we divide the funds into deciles based on their performance for that
quarter and calculate the average net flows in the subsequent quarter for each performance
decile using the definition provided in Section 3.2. In unreported tests, we find the
flow-performance relation to be convex for BFs. However, in the case of TDFs, there is no clear
pattern in the flow-performance relation suggesting that investors fail to incentivize their
fund managers. We repeat our analysis using the four-factor model and find qualitatively
similar results.
analysis for both sub-groups using a simple linear regression given by the following model:
N etF lowsi,t+1 =β0+β1P erfi,t+β2LogAU Mi,t+β3ExpenseRatioi,t
+β4ObjF lowsi,t+1+β2RetV olati,t+i,t,
(3)
where N etF lowsi,t+1 is the net percentage growth of fund i in quarter t+ 1, P erfi,t is the
net-of-fee six-factor alpha, LogAU Mi,t is the log of assets under management of fund i in
quarter t, ExpenseRatioi,t is the expense ratio of fund i in quarter t, ObjF lowi,t+1 is the
growth of funds in quarter t+ 1 with fund i’s investment objective, and RetV olati,t is the
standard deviation of returns over the previous 24 months ending in quarter t. In the case
of TDFs with the FOF structure, expense ratio is augmented by the average expense ratio
of the constituent funds.
While the above model assumes a linear relation, we follow Sirri and Tufano (1998) and
use the following piece-wise linear model to capture the convexity of the flow-performance
relation.
N etF lowsi,t+1 =β0+β1LowP erfi,t+β2M idP erfi,t+β3HighP erfi,t
+β4LogAU Mi,t+β5ExpenseRatioi,t +β6ObjF lowsi,t+1
+β7RetV olati,t+i,t.
(4)
We define LowP erfi,t as M in(0.2, RAN Ki,t) where RAN Ki,t is defined as the percentile
performance (measured as the net-of-fee six-factor alpha) of fund i in quarter t relative
to other funds with the same investment objective. Similarly, we define M idP erfi,t as
M in(0.6, RAN Ki,t−LowP erfi,t) and the highest quintile of performance asHighP erfi,t =
RAN Ki,t−(LowP erfi,t+M idP erfi,t). Finally, all other variables are as defined in Equation 3.
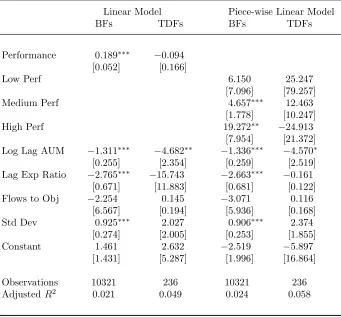
to past performance in the case of BFs while flows are unrelated to performance for TDFs.
The results from the piece-wise linear model provides evidence of a convex flow-performance
relation for BFs. We find the slopes of the performance-growth relation over the three ranges
to be significantly different from zero and based on the pairwise t-tests, we can reject the
hypothesis that performance sensitivity of the lowest quintile is the same as that of the
highest quintile as well as the middle three quintiles combined as in Sirri and Tufano (1998).
However, in the case of TDFs, we fail to reject the hypothesis that performance sensitivity
of the lowest quintile is the same as that of the highest quintile as well as the middle three
quintiles. Thus, the flow-performance relation of BFs is convex during our sample period
while there is no relation between flows and performance for TDFs. Another interesting
point is that while fund flows to mutual funds are negatively related to expense ratios in
the case of BFs, they are not sensitive to expense ratios in the case of TDFs. Thus, unlike
BFs, flows to TDFs are not related to performance or expenses and hence fail to provide
managers with incentives to outperform their peers. Instead, it incentivizes fund families to
sell poorly performing or high-fee funds which establishes the potential for agency problems
in TDFs. In unreported tests, we repeat the analysis with four-factor alphas as performance
measures as well as family fixed effects model and find qualitatively similar results.
Next, we present evidence of agency problems in TDFs and a mechanism through which
it manifests. We begin with the univariate analysis of BFs, TDFs, and their subcategories
followed by our tests for under-performance and conclude with our analysis of the determinants
4.2.
Univariate Analysis of BFs and TDFs
In Table 3, we present the average fund characteristics of TDFs and BFs in the first
two columns and the differences in the means in the third column. From the table, we
can see that TDFs under-perform BFs by 1.35% (2.52%) annually on a net-of-fee
(gross-of-fee) risk-adjusted basis. Additionally, we find lower Sharpe ratios for TDFs relative to BFs
both on net-of-fee and gross-of-fee basis. Based on average fund characteristics, BFs are of
comparable size, older, have lower net flows, lower equity allocation, higher bond allocation,
and lower volatility of monthly returns compared to TDFs. It is interesting to note that
TDFs under-perform BFs despite having greater volatility of returns and lower allocation to
bonds.
In Table 4, we provide the characteristics of TDFs having the FOF and SF structures in
the first two columns and the differences in the means in the third column. We find that
based on our risk-adjusted performance measure, FOFs under-perform SFs by 1.76% (2.96%)
annually on a net-of-fee (gross-of-fee) basis. Furthermore, we find lower Sharpe ratios for
FOFs relative to SFs both on net-of-fee and gross-of-fee basis. Additionally, FOFs tend to be
larger, younger, and have higher net flows, higher equity component, lower bond component,
and higher volatility in monthly returns compared to SFs. Once again, we find that FOFs
under-perform SFs despite having higher volatility of returns and lower bond allocation.
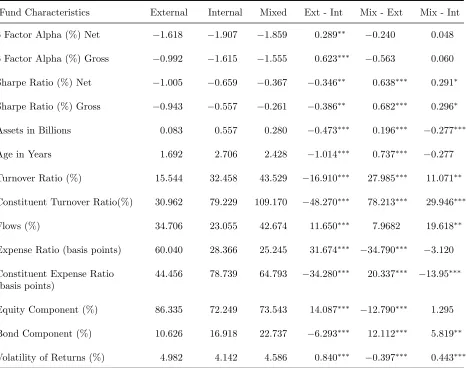
In the first three columns of Table 5, we present the fund characteristics of the three
sub-groups of FOFs namely Internal, External, and Mixed FOFs. In the remaining three
columns, we present the differences in the means. From the fourth column, we can see that
the Internal FOFs under-perform External FOFs by 29 (62) basis points annually on a
net-of-fee (gross-net-of-fee) risk-adjusted basis. However, we find higher Sharpe ratio for Internal
that Internal FOFs are exposed to greater systematic risk relative to External FOFs.
Internal FOFs are larger, older, and have higher turnover ratio, lower flows, lower
expense ratio, lower equity allocation, higher bond allocation, and lower volatility in monthly
returns. Additionally, we report the weighted average turnover ratio and expense ratio of
the constituent funds. We can see that the Internal FOFs have constituents with greater
expense ratios and higher turnover ratios. While the revenue generated from the fees paid
to constituent funds is redirected to the fund family’s coffers in the case of Internal FOFs,
it is paid to other fund families in the case of External FOFs. From the fifth and sixth
columns, we can see that the Mixed FOFs are comparable in performance to the Internal
FOFs but under-perform External FOFs. For our subsequent analysis, we combine Mixed
FOFs with the ExternalFOFs as managers of both categories have the option of including
funds from families outside. To the extent that managers ofMixed FOFs have opportunities
for “strategic” selection, it will bias our tests against finding under-performance. Our results
are qualitatively similar when we repeat our analysis after excluding Mixed FOFs from the
data.
4.3.
Performance of Target-Date Funds relative to Balanced Funds
We start our multivariate analysis by comparing the performance of TDFs with that
of BFs. Our data for this test consists of all fund-quarter observations during the period
January 2001 to December 2008. We use the following model to conduct our analysis:
P erfi,t =κ0+κ1T DFi+κ2ExpenseRatioi,t+κ3LogAgei,t
+κ4LogAU Mi,t+κ5T urnoveri,t+κ6N etF lowi,t
+κ7F amilyAU Mi,t+κ8Bondi,t+i,t,
where the dependent variable P erfi,t is the performance measure of the ith fund in the tth
quarter andT DFi is a dummy variable that takes the value 1 if theith fund is a TDF and 0
otherwise. LogAgei,tis the log of age of theithfund in thetthquarter whileT urnoveri,t is the
turnover ratio of theith fund in thetthquarter. In the case of TDFs with the FOF structure,
T urnoveri,t includes the average turnover ratio of the constituent funds. Although we use
risk-adjusted performance measures, we control for any residual impact of asset allocation
by including Bondi,t, the percentage of assets invested by fund i in fixed income securities
in the tth quarter. To control for family effects, we include F amilyAU M
i,t, the log of assets
under management of the fund family. All other variables are as defined in Equation 3.
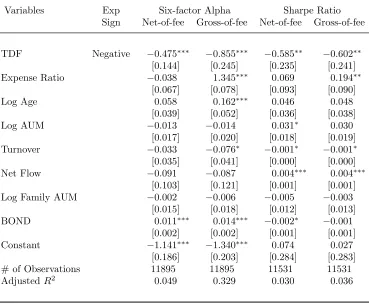
We present the results for six-factor alpha as the performance measure in columns three
and four of Table 6 while columns five and six contain corresponding results with Sharpe
ratio as the performance measure. Since our baseline case is balanced funds, the negative
sign on the TDF dummy indicates that TDFs under-perform BFs. This under-performance
ranges from 48 basis points annually based on net-of-fee alphas to 86 basis points annually
based on gross-of-fee alphas. Additionally, TDFs also have lower Sharpe ratios compared
to BFs as indicated by the negative coefficient of −0.59 (−0.60) for the net-of-fee (gross-of-fee) Sharpe ratio results. The greater under-performance of the gross-of-fee specification
indicates that BFs tend to have higher expense ratios. To compute the average six-factor
alpha for each of the category of funds, we evaluate Equation 5 using the mean values for
the control variables. Based on our calculations, the average net-of-fee (gross-of-fee) annual
six-factor alpha for TDFs is −1.27 (−0.07) while that of BFs is−0.79 (0.78).
To ensure that the under-performance that we document does not occur by chance, we
perform bootstrap simulation comparable to the residual and factoring procedure described
in Kosowski, Timmermann, Wermers, and White (2006). To start with, we estimate the
BFs in our data for each of the four sub-periods and store the coefficient estimates {βˆ1,i,
ˆ
β2,i, . . . βˆ6,i, i = 1,2, . . . , N} and the time series of the estimated residuals {ˆi,t, i =
1,2, . . . N, t = 1,2, . . . T}. Subsequently, for each bootstrap iteration b, we draw samples
with replacement from the funds’ stored residuals {ˆbi,te, te = sb1, sb2, . . . sbT}, and the factor
returns {M KT RFtb, SM Btb, HM Lbt, U M Dbt, BON Dbt, IN T EQbt, t = ub1, ub2, . . . ubT} where
sb1, sb2, . . . sbT and ub1, ub2, . . . ubT denote the time reordering imposed by the bootstrap. This
enables us to construct the time series of simulated returns for all the BFs and TDFs in each
of the sub-periods subject to zero alphas as follows:
ri,tb = ˆβ1,iM KT RFtb+ ˆβ2,iSM Bbt + ˆβ3,iHM Lbt
+ ˆβ4,iU M Dbt+ ˆβ5,iBON Dtb+ ˆβ6,iIN T EQbt + ˆbi,te
(6)
where ri,t, M KT RFt, SM Bt, HM Lt, U M Dt, BON Dt, IN T EQt, and ˆi,t are as defined in
Subsection 3.2 and b refers to the bootstrap number. The resulting simulated returns thus
generated have the same number of funds in the cross-section as well as the same number of
return observations per fund as in the data. We then reestimate the net-of-fee alphas for the
TDFs and BFs for each of the four sub-periods and repeat the analysis in Equation 5 using
the bootstrapped alphas to test whether the coefficient of the TDF dummy is negative. We
run a total of 1,000 bootstrap iterations and find the mean value of the TDF coefficient to
be smaller than 0.0001 and not significantly different from zero at the 1% confidence level
indicating that the under-performance results we obtain is not due to chance.
If agency issues do not play a role, then the difference in performance of TDFs relative
to BFs can be construed as the premium that investors are willing to pay for the automatic
rebalancing feature. To disentangle the two explanations, we compare the performance of
4.4.
Automatic-rebalancing versus strategic selection
To tease out the cause of under-performance, we investigate the performance of the
subcategories of TDFs. To this end, we estimate the following regression for all TDFs and
BFs in our data.
P erfi,t =κ0+κ1F OFi+κ2SFi+κ3ExpenseRatioi,t+κ4LogAgei,t+
κ5LogAU Mi,t+κ6T urnoveri,t +κ7N etF lowi,t+
κ8F amilyAU Mi,t+κ9Bondi,t+i,t,
(7)
where the dependent variable P erfi,t is the performance measure of the ith TDF in the tth
quarter, F OFi is a dummy that takes the value 1 if the ith TDF has FOF structure and 0
otherwise and SFi is a dummy that takes the value 1 if the ith TDF has SF structure and 0
otherwise. All other control variables are the same as defined in Equation 5.
We present the results for both performance measures in Table 7. BFs continue to be
our baseline case implying that a negative coefficient on the FOF dummy variable indicates
that BFs outperform TDFs with the FOF structure while a positive coefficient on the SF
dummy variable indicates that TDFs with the SF structure outperform BFs. From the third
and fourth columns of the table, we note that TDFs with the FOF structure under-perform
BFs by 67 basis points annually on a net-of-fee risk-adjusted basis and 117 basis points
annually on a gross-of-fee risk-adjusted basis. Similarly, from the fifth and sixth columns of
the table, we can see that the Sharpe ratio of TDFs with the FOF structure is lower than
the Sharpe ratio of BFs by 0.744, (0.764) on a net-of-fee (gross-of-fee) basis. The greater
under-performance of the gross-of-fee specification implies that expense ratios are higher for
SFs. To compute the average six-factor alpha for each of the category of funds, we evaluate
average net-of-fee (gross-of-fee) annual six-factor alpha for FOFs is−2.04 (−0.80) while that of SFs is −1.23 (0.49) and BFs is −1.35 (0.37). In the case of TDFs with the SF structure, the performance is not significantly different from that of BFs. Thus, we can rule out
time-varying re-allocation as the main driver of the under-performance of TDFs. We also find
that TDFs with the FOF structure under-perform TDFs with the SF structure by 79, (129)
basis points annually using net-of-fee (gross-of-fee) alphas and by 0.66 (0.68) annually based
on net-of-fee (gross-of-fee) Sharpe ratios. We repeat the analysis in Equation 7 using the
bootstrapped alphas to test whether the under-performance of the FOFs relative to SFs could
occur purely by chance under the assumption that all funds have zero net-of-fee alphas. Our
results indicate that the average of the relative performance differential between the FOFs
and SFs is 0.0001 which is not significantly different from zero at the 1% confidence level.
This shows that the under-performance of the FOFs that we observe in our data is not
attributable to chance and the losses suffered by TDFs as shown in the earlier analysis is
almost entirely driven by TDFs with the FOF structure.
Since TDFs with FOF structure under-perform those with SF structure in the net-of-fee
as well as the gross-of-fee specification, the performance differential cannot be attributed
to the dual layer of fees charged by TDFs with the FOF structure. However, if the
under-performance is attributed to the reduction in risk due to diversification across funds, the
shortfall of 79 to 129 basis points can be seen as the price paid by investors for this
diversification. Alternately, the under-performance might arise due to “strategic” decisions
made by the fund family. To disentangle the two explanations, we compare the performance
of the two subgroups of FOFs namely, ExternalFOFs and Internal FOFs, with that of the
4.5.
Costs and benefits of the fund-of-fund structure
As External FOFs came into existence only in 2005, our sample period for subsequent
analyses consists of all TDFs over the period January 2005 to December 2008. To compare
the performance of the Internal FOFs with that of External FOFs, we replace the FOF
dummy by two dummy variables called Internal and External. Internal takes the value 1
if the funds’ assets are invested entirely within the family and zero otherwise. Similarly,
External takes the value 1 if the funds’ assets are invested at least partially outside the
family and zero otherwise. We continue to use the same set of control variables as before
and estimate the following regression:
P erfit =κ0+κ1Internali+κ2Externali +κ3ExpenseRatioi,t+
κ4LogAgei,t+κ5LogAU Mi,t+κ6T urnoveri,t+
κ7N etF lowi,t+κ8Bondi,t+κ9F amilyAU Mi,t+i,t,
(8)
where Internali and Externali are dummy variables as defined above and the performance
measures as well as control variables are the same as in Equation 5.
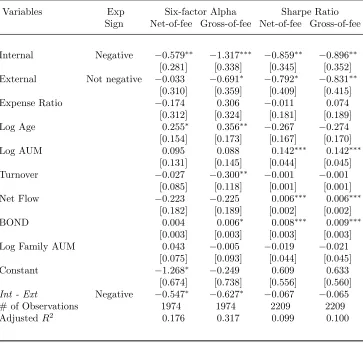
We present our results for the above model in Table 8. In this analysis, we compare
the performance of the Internal and External FOFs using TDFs with the SF structure as
the baseline case. We can see that over our sample period, TDFs with the Internal FOF
structure under-perform those with the SF structure for both net-of-fee as well as
gross-of-fee specifications while TDFs with the External FOF structure under-perform those with
the SF structure only when we use gross-of-fee alphas. This result implies that the
under-performance of the FOFs cannot be entirely due to diversification across funds.
Consistent with our hypothesis,InternalFOFs under-perform ExternalFOFs by 55 basis
However, there is no significant difference in performance based on Sharpe ratios. This might
mean that Internal FOFs are exposed to greater systematic risk relative to External FOFs
but have lower managerial ability. To compute the average six-factor alpha for each of the
category of funds, we evaluate Equation 8 using the mean values for the control variables.
Based on our calculations, the average net-of-fee (gross-of-fee) annual six-factor alpha for
Internal FOFs is −1.65 (−1.22) while that of External FOFs is −1.10 (−0.60) and SFs is
−1.07 (0.09). We use the bootstrap analysis explained in Subsection 4.4 to test whether
the under-performance could occur purely by chance under the assumption that all TDFs
have zero net-of-fee alphas. We find that the mean relative performance differential between
Internal FOFs andExternalFOFs is −0.001 which is not significantly different from zero at the 1% confidence level suggesting that our results are not attributable to chance. Based on
the results from our six-factor model, we contend that since bothInternalandExternalFOFs
have the FOF structure and carry out portfolio rebalancing at regular intervals, the
under-performance of Internal FOFs cannot be explained by reduced risk, dual layer of fees or the
timely reallocation of assets. Hence, “strategic” decisions that benefit the fund family over
the investors is the probable cause of under-performance. In the next sub-section, we turn
our attention to the selection decision of TDFs with the FOF structure. For all subsequent
analyses we use the six-factor alphas as the performance measure.
4.6.
Selection criteria of constituent funds by Internal fund-of-funds
To study the drivers of under-performance of theInternalFOFs, we analyze the selection
process by which constituent funds are determined for the Internal FOFs and test whether
fund families make these decisions to extract private benefits. To this end, we compare the
constituents of theInternal FOFs to other funds in the family that are not part of any TDF
from a family is included in an Internal FOF using the following logistic regression model:
U Fi,t =κ0 +κ1P erfi,t−1+κ2ExpenseRatioi,t−1+κ3N etF lowi,t−1+
κ4LogAgei,t−1+κ5LogAU Mi,t−1+κ6T urnoveri,t−1+
κ7Bondi,t−1+κ8LogF amAU Mi,t−1,
(9)
where the dependent variable U Fi,t = ln
prob(F undit is a constituent of an Internal FOF)
prob(F unditis not a constituent of an Internal FOF)
is the
log odds of the ith fund being selected as a constituent of an Internal FOF in quarter t
and the explanatory and control variables are as defined in Sections 3.2 & 3.3. To avoid
forward-looking bias while using performance as an independent variable, for each fund we
re-estimate the alphas for every quarter using our six-factor model for the 24 months prior
to that quarter. We use one period lagged value for all the explanatory and control variables
as these are likely to impact the selection decision of the constituent funds. We allow for
standard errors to cluster by family and quarter. We provide the results of this analysis in
Panel A of Table 9.
These results indicate that for any fund in the family, ceteris paribus, the probability
of inclusion in the TDF is positively related to the expense ratio and negatively related to
performance and net flows. In other words, funds selected by the Internal FOFs tend to
have lower performance, higher expense ratios and lower net flows relative to other funds
in the family. Additionally, these funds are likely to be smaller, older, and have greater
allocation to bonds. Moreover, the significant negative value for coefficient of performance
in the gross-of-fee specification raises questions about the ability of the managers of these
constituent funds. If selection of poorly performing, high-expense funds as constituents by
theInternalFOFs is done to derive private benefits, we expect TDFs with the FOF structure
and investing in families outside to select funds with relatively better performance and lower
the constituent funds of the Internal FOFs with those of the ExternalFOFs.
4.7.
Constituents of Internal of-funds versus those of External
fund-of-funds
To discern the determinants of including a fund in an Internal FOF versus an External
FOF, we compare their constituent funds when they are initially included in the TDF. Our
sample period for this analysis is from January 2005 to December 2008 as TDFs with the
ExternalFOF structure came into existence only in 2005. Given that a fund is a constituent
fund for some TDF, we estimate the probability that it becomes a constituent fund of a TDF
with the Internal FOF structure using the following logistic regression model:
U Fi,t =κ0+κ1P erfi,t−1+κ2ExpenseRatioi,t−1+κ3N etF lowi,t−1
+κ4LogAgei,t−1+κ5LogAU Mi,t−1+κ6T urnoveri,t−1
+κ7Bondi,t−1+κ8LogF amAU Mi,t−1,
(10)
where the dependent variable U Fi,t = ln
prob(F und
itis a constituent of an Internal FOF)
prob(F undit is a constituent of an External FOF)
is the log
odds of the ith fund being selected as a constituent of an Internal FOF in quarter t and the
explanatory and control variables are as defined in Sections 3.2 & 3.3.
We provide the results of this analysis in Panel B of Table 9. Consistent with our
expectations, we find that the coefficient of performance is negative indicating that fund
families are more likely to choose funds with poor performance in the case of TDFs with
the Internal FOF structure relative to TDFs with the ExternalFOF structure. The results
are striking given the fact that we have much fewer observations (169 vs 26812) compared
to those in Panel A in which we compare constituent funds of Internal FOFs against other
expense ratios are more likely to be included in TDFs with theInternal FOF structure than
in TDFs with the External FOF structure. However, we find the probability of inclusion of
a constituent fund in a TDF with the Internal FOF structure is not additionally influenced
by the net flows to the constituent fund relative to constituents of TDFs with the External
FOF structure. Once again we find significant negative value for coefficient of performance
in the gross-of-fee specification raising questions regarding the ability of managers of the
constituent funds of Internal FOFs.
Overall, our results suggest that the under-performance of Internal FOFs could be due
to the inclusion of constituent funds that have lower performance and higher expense ratios.
These funds also have lower flows relative to other funds in the family suggesting that
some fund families may be using TDFs as a vehicle to promote poorly performing funds,
to increase revenues to the family, and to redirect flows to funds that are not favored by
investors. Inclusion of funds with poor performance in TDFs raises the question regarding
the cause of poor performance. On one hand, funds may perform poorly due to lack of
managerial skills while on the other hand the under-performance might be a consequence of
“strategic” decision by the management to use these funds to cross-subsidize certain other
funds in the family. We follow the methodology of Gaspar, Massa, and Matos (2006) to
test whether fund families with Internal FOFs practice cross-subsidization. In untabulated
results, we find that funds in the bottom quartile of year-to-date returns within a family
that offers TDFs with the Internal FOF structure are likely to under-perform similar funds
from other families by 12 basis points per month which is suggestive of cross-subsidization.
However, we cannot rule out lack of managerial skill as the cause of poor performance and
5.
Robustness checks
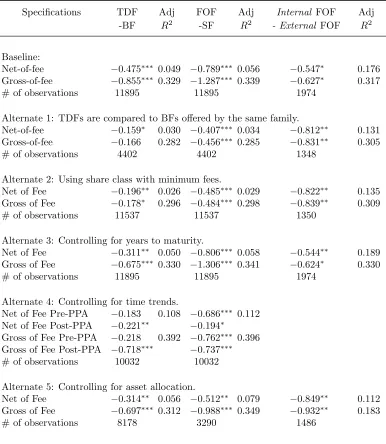
This section discusses several alternate specifications to show that the under-performance
of TDFs with the Internal FOF structure is robust and present our results in Table 10. In
untabulated results, we repeat all of our analysis using Carhart’s (1997) four-factor model
allowing for standard errors to cluster by families and quarters as well as family fixed-effects
model allowing for standard errors to cluster by quarters and obtain qualitatively similar
results. For ease of comparison, we begin with the results of our base model followed by
different alternate specifications. For brevity, we only report the extent of under-performance
for each case.
1. Base model: We compare the average performance of all TDFs with the average
performance of all BFs over the period January 2001 to December 2008. We use
net-of-fee and gross-net-of-fee risk adjusted performance measures in which risk adjustment is
done using our six-factor model. Thus, we have two measures of performance of which
the net-of-fee alphas are perhaps more pertinent to the investor.
2. An alternate way to control for family effects is to restrict the BFs to the families that
offer TDFs. While this restriction effectively controls for family effects, it reduces our
sample size. We present the results of this analysis as the first alternate specification
in Table 10. From these results, we can see that the under-performance persists after
controlling for family effects.
3. A shortcoming of our data is that in the case of TDFs with the FOF structure, we do
not know the share class of the constituent funds. Consistent with Wermers (2000), we
combine net returns, expense ratio, and other fund characteristics of all classes using
the weighted average in which weights are based on assets in each share class. Thus,
lowest fees, our estimates for expense ratio and gross-of-fee returns may be overstated.
To provide a lower bound, we repeat our analysis by choosing the lowest fees among
share classes as the fees for the fund and present the results in the second alternate
specification. We find the results to be qualitatively similar albeit a bit weaker for
all cases except the under-performance of the Internal FOFs in which the results are
stronger relative to the base-case.
4. In our analysis thus far, we have pooled funds with longer maturity along with
shorter-maturity funds. However, longer-maturity funds might be systematically different
from those with shorter-maturity. While our linear multi-factor model captures the
differences in investment styles, there might be other fundamental differences in the
two categories. Hence, we introduce an additional control variable that measures the
years remaining to the target year. Our results indicate that the documented
under-performance persists even after controlling for the number of years to maturity as
shown in the third alternate specification of Table 10.
5. Another aspect that might affect our results is the approval of TDFs as QDIA in
2006 resulting in a surge in the number of TDFs. Particularly, External FOFs were
introduced only around this period. Hence, the period before 2006 might be systematically
different from the period after 2006. To control for this possibility, we exclude the
observations in the year 2006 and include a dummy variable that takes the value 1 for
the post-PPA period (January 2007 to December 2008) and 0 for the pre-PPA period
(January 2001 to December 2005) to our regression analysis. We are unable to present
this analysis for Internal FOFs and ExternalFOFs due to lack of sufficient number of
ExternalFOFs in 2005. However, our results for under-performance persists for TDFs
6. As an additional control for the differences in asset allocation, we repeat our analysis
using subsamples that are matched by the allocation to bonds. First, for each quarter
we select up to ten BFs whose bond allocation differs by 10% from that of a given TDF
and pool them after removing repetitions. This results in 1919 observations for TDFs
and 6259 observations for BFs. Next, we construct subsamples of BFs and TDFs with
the FOF structure whose bond allocation differs by 10% from that of a given TDF
with the SF structure. In this case, our sample consists of 319 observations for TDFs
with the SF structure, 809 observations for TDFs with the FOF structure and 2162
observations for BFs. Finally, we construct subsamples of TDFs with the SF structure
and TDFs with theInternal FOF structure whose bond allocation differs by 10% from
that of a given TDF with the Exteranl FOF structure. This sample consists of 162
observations for TDFs with the External FOF structure, 1178 observations for TDFs
with theInternalFOF structure, and 146 observations for TDFs with the SF structure.
We repeat our initial analysis on the matched samples and present the results as the
fifth specification. We find that the under-performance persists for all three cases and
is even stronger in the case of TDFs with the Internal FOF structure.
To summarize, our battery of robustness checks corroborate our key findings that TDFs
under-perform BFs. Further, variation in asset allocation over time does not seem to drive
this result as TDFs with the FOF structure are the ones with poor performance and not
TDFs with the SF structure that perform at par with BFs. Finally, dual layer of fees or
diversification across funds do not seem to explain the poor performance as TDFs with the
Internal FOF structure under-perform those with the ExternalFOF structure both on
net-of-fee and gross-net-of-fee basis. These findings together point towards agency problems in the
TDFs, more specifically towards those structured as FOFs and investing in the funds within
6.
Conclusion
Retirement plan contributions to mutual funds have grown to $3.1 trillion, representing
a third of total mutual fund assets, at the end of 2008.14 During the recent financial crisis,
the significant cross-sectional variation in the performance of Target-Date Funds (TDFs),
whose assets are predominantly held in retirement accounts, led to an investigation by the
Securities and Exchange Commission (SEC). Ours is the first empirical study examining the
variation in performance across TDFs to show that agency problems may be responsible for
the poor performance of certain TDFs. In particular, we find that the problems originate in
TDFs that invest in other mutual funds within the fund family as it provides opportunities
to redirect flows to poorly performing and high-fee funds. Furthermore, we establish that
our results are not attributable to chance and are robust to alternate definition of expense
ratios, variations in family characteristics, trends over time, as well as variations in asset
allocation.
A potential reason for agency problems in TDFs is that flows do not respond to past
performance indicating that investors neither reward good performance nor punish poor
performance. However, we find that balanced funds, which is an alternate default option
available in 401(k) plans with automatic enrollment, delivers superior performance and
exhibits convex flow-performance relation indicating that its investors reward performance.
A possible reason for the convex flow-performance relation in balanced funds is that it has
considerable investor participation outside retirement plans. Hence, exposure of TDFs to
such investors might be a possible solution to mitigate agency problems. Additionally, TDFs
could be mandated to display their structure (funds investing in stocks and bonds,
fund-of-funds investing within their own family, or fund-of-fund-of-funds investing in other families).
A future area of research is to study other avenues of agency problems in TDFs. In
particular, TDFs are required to rebalance their portfolios based on a predetermined asset
allocation called the glide path. It is possible that TDFs could strategically deviate from
the glide path to serve the fund family’s incentives. These issues are part of our ongoing
References
Agarwal, V., Gay, G. D., Ling, L., 2011. Window dressing in mutual funds. Unpublished
working paper. Georgia State University.
Agarwal, V., Kale, J., 2007. On the relative performance of multi-strategy and funds of
hedge funds. Journal of Investment Management 5(3), 41–63.
Agnew, J., Balduzzi, P., Sunden, A., 2003. Portfolio choice and trading in a large 401(k)
plan. American Economic Review 93(1), 193–215.
Allen, F., Gorton, G., 1993. Churning bubbles. Review of Economic Studies 60(4), 813–836.
Ang, A., Rhodes-Kropf, M., Zhao, R., 2008. Do funds-of-funds deserve their fees-on-fees?
Unpublished working paper. Columbia Universtiy.
Barber, B. M., Odean, T., Zheng, L., 2005. Out of sight, out of mind: the effects of expenses
on mutual fund flows. The Journal of Business pp. 2095–2120.
Benartzi, S., Thaler, R. H., 2007. Heuristics and biases in retirement savings behavior.
Journal of Economic Perspectives 21(3), 81–104.
Benzoni, L., Collin-Dufresne, P., Goldstein, R. S., 2007. Portfolio choice over the life-cycle
when the stock and labor markets are cointegrated. The Journal of Finance 62(5), 2123–
2167.
Berk, J. B., Green, R. C., 2004. Mutual fund flows and performance in rational markets.
The Journal of Political Economy 112(6), 1269–1295.
Bhattacharya, U., Lee, J. H., Pool, V. K., 2010. Conflicting family values in mutual fund
Blake, C. R., Elton, E. J., Gruber, M. J., 2003. Incentive fees and mutual funds. The Journal
of Finance 58(2), 779–804.
, 2006. The adequacy of investment choices fooered by 401(k) plans. Journal of Public
Economics 90, 1299–1314.
, 2007. Participant reaction and the performance of funds offered by 401(k) plans.
Journal of Financial Intermediation 16(2), 249 – 271.
Bodie, Z., Merton, R. C., Samuelson, W. F., 1992. Labor supply flexibility and portfolio
choice in a life-cycle model. Journal of Economic Dynamics and Control 16, 427–449.
Bodie, Z., Treussard, J., 2007. Perspectives:Making investment choices as simple as possible,
but not simpler. Financial Analysts Journal 63(6), 42–47.
Brown, K. C., Harlow, W. V., Starks, L. T., 1996. Of tournaments and temptations: an
analysis of managerial incentives in the mutual fund industry. Journal of Finance 51(1),
85–110.
Brown, S., Goetzmann, W. N., Park, J., 2001. Careers and survival: competition and risk
in the hedge fund industry. Journal of Finance 56(5), 1869–1886.
Brown, S. J., Goetzmann, W. N., Liang, B., 2002. Fees on fees in funds of funds. Unpublished
working paper. No. 02-33 New York University, Yale School of Management and University
of Massachusetts at Amherst.
Carhart, M. M., 1997. On persistence in mutual fund performance. Journal of Finance 52(1),
57–82.
Carhart, M. M., Kaniel, R., Musto, D. K., Reed, A. V., 2002. Leaning for the tape: evidence
Chai, J., Horneff, W., Maurer, R., Mitchell, O. S., 2009. Extending life cycle models of
optimal portfolio choice: integrating flexible work, endogenous retirement, and investment
decisions with lifetime payouts. Unpublished working paper. National Bureau of Economic
Research (NBER) WP 15079.
Chevalier, J., Ellison, G., 1997. Risk taking by mutual funds as a response to incentives.
Journal of Political Economy 105(6), 1167–1200.
, 1999. Career concerns of mutual fund managers. Quarterly Journal of Economics
114(2), 389–432.
Choi, J. J., Laibson, D., Madrian, B., Metrick, A., 2006. Saving for retirement on the path
of least resistance. in In Behavioral Public Finance: Toward a New Agenda, ed. by E. J.
McCaffrey, and J. Slemrod. Russell Sage Foundation.
Cici, G., Gibson, S., Moussawi, R., 2010. Mutual fund performance when parent firms
simultaneously manage hedge funds. Journal of Financial Intermediation 19(2), 169–187.
Cocco, J. F., Gomes, F. J., Maenhout, P. J., 2005. Consumption and portfolio choice over
the life cycle. Review of Financial Studies 18(2), 491–533.
Cohen, L., Schmidt, B., 2009. Attracting flows by attracting big clients. Journal of Finance
64(5), 2125 – 2151.
Comer, G., 2006. Hybrid mutual funds and market timing performance. The Journal of
Business 79(2), 771–797.
Cooper, M. J., Gulen, H., Rau, P. R., 2005. Changing names with style: mutual fund name