R E S E A R C H A R T I C L E
Open Access
Effect of microbial cell preparation on renal
profile and liver function among type 2
diabetics: a randomized controlled trial
Somayyeh Firouzi
1, Barakatun-Nisak Mohd-Yusof
1,2*, Hazreen-Abd Majid
3, Amin Ismail
1,2and Nor-Azmi Kamaruddin
4Abstract
Background:The beneficial effect of probiotics on renal profile and liver function has been reported among patients with chronic kidney disease and fatty liver respectively. However, its effect on renal profile and liver function among type 2 diabetic individuals has not been fully understood. To investigate the effect of microbial cell preparation on renal profile and liver function tests among type 2 diabetic individuals.
Methods: A randomized, double-blind, parallel-group, controlled clinical trial was conducted on a total of 136 type 2 diabetics age 30-70 years old in a teaching hospital in Kuala Lumpur, Malaysia. Subjects were randomly assigned to receive microbial cell preparation (N= 68) or a placebo (N= 68) for 12 weeks. The outcomes measured at baseline, week 6, and week 12 and included changes in renal profile (Sodium, Potassium, Urea, Creatinine, Glomerular Filtration Rate), and liver function tests (Albumin, Total Protein, Alkaline Phosphatase, Alanine Aminotransferase, Aspartate Aminotransferase). Intention to treat (ITT) analysis was performed on all the recruited subjects, while per protocol (PP) analysis was conducted on those who completed the trial with good compliance.
Result: The urea levels significantly declined in the probiotic group. Serum urea levels reduced from 4.26 mmol/L to 4.04 mmol/L in Probiotic Group while it increased in Placebo Group from 4.03 mmol/L to 4.24 mmol/L. These changes were significant between groups in ITT analysis (p= 0.018). Other parameters did not change significantly between groups.
Conclusion:12 weeks supplementation with daily dosage of 6 × 10¹⁰Colony Forming Units of multi-strain microbial cell preparation significantly improved urea levels.
Trial registration:(Clinical trials: #NCT01752803)
Keywords:Microbial cell preparation, Probiotics, Urea, Renal profile, Liver function tests, Type 2 diabetes, Lactobacillus, Bifidobacterium
* Correspondence:[email protected] 1
Department of Nutrition and Dietetics, Faculty of Medicine and Health Sciences, University Putra Malaysia, 43400 Serdang, Selangor, Malaysia 2
Research Centre of Excellence for NCD (Nutrition and Non-communicable Diseases), Universiti Putra Malaysia,, 43400 UPM Serdang, Selangor, Malaysia Full list of author information is available at the end of the article
Background
Type 2 diabetes individuals are at risk of chronic kidney [1] and liver diseases [2]. Recent literature proposed that modulation of gut microbiota with probiotics have the potential to improve renal profile and liver function. Proof for the above purport is that, gut microbiota is al-tered in patients with Chronic Kidney Disease (CKD) [3] and non-alcoholic steatohepatitis [4] as compared with healthy subjects. Different small-scaled clinical trials in hemodialysis patients [5, 6], or stage 3 and 4 of CKD [7, 8], reported a non-significant improvement on different indi-ces of renal profiles following a period of probiotic con-sumption ranging from 2 to 6 months. In terms of liver function, a meta-analysis of four randomized controlled trials, comprising of 134 alcoholic fatty liver and non-alcoholic steatohepatitis patients, demonstrated significant improvements in well-recognized clinical markers of liver damage including Alanine Aminotransferase (ALT), Aspar-tate Transaminase (AST) and Tumor Necrosis Factor Alpha (TNFα) [9].
Liver damage is partly attributed to the increased sys-tematic inflammation by trans-locating gut harmful bac-teria into the blood stream. Probiotics has a beneficial role in liver diseases through diminishing proliferation of harmful bacteria in the gut and improving the integ-rity of gut mucosa [10]. Indeed, gut microbiota is altered in CKD. The reason might be due to uremia which im-pairs intestinal barrier function and promotes inflamma-tion throughout the gastrointestinal tract. This alterainflamma-tion may interfere with the normal functions of the gut, caus-ing disturbances in renal parameters. Therefore, ma-nipulation of gut microbiota may positively impact renal profiles [3].
Despite promising findings from the above studies, it is still uncertain whether data from hemodialysis, CKD patients or non-alcoholic fatty liver and non-alcoholic steatohepatitis patients can be extrapolated to type 2 di-abetics who are at risk of CKD or chronic liver diseases. Therefore, this randomized controlled trial is aimed to investigate the effect of a multi-strain microbial cell preparation on renal profile and liver function among type 2 diabetic individuals.
Methods
Subject selection
This study was a double blind randomized parallel-group, placebo controlled trial which was conducted at the diabetes clinic of a teaching hospital in Kuala Lum-pur, Malaysia. Type 2 diabetic individuals with stabilized dose of medication, age 30 to 70, with Glycated Hemoglobin A1c (HbA1c) between 6 and 12 %, Fasting Blood Glucose (FBG) <15 mmol/l and Body Mass Index (BMI) between 18.5 and 40 kg/m2, were eligible to join the study (the levels of BMI and HbA1c extended from
the initial plan due to the difficulties fulfilling the sample size). Exclusion criteria include subjects who were treated with insulin, antibiotics and/or other medication which might interfere with the results of the study and having any acute or chronic disease other than diabetes, hyperlipidemia, and hypertension.
All the patients attending the diabetes clinic from February 2012 to December 2013, comprising 6967 subjects, were screened for the study. A total number of 456 eligible subjects, whose contact numbers were available at the hospital system, were approached by phone contact. During the conversation, the benefits and risk of the study was briefly explained to the eli-gible subjects. Those who were willing to join the study had an appointment with the main researcher to describe the details of the study and to double check inclusion and exclusion criteria in a face to face interview. Subjects were given adequate time to consult with their doctors and families and in order to stop taking any probiotic or prebiotic source. Among them, 136 subjects agreed to join the study and were randomly allocated to receive either pro-biotic (refers to microbial cell preparation) or placebo for a 12-week period with the allocation ratio of one. The subjects signed the consent form before recruitment. The study protocol was approved by the Clinical Research and Ethics Committee of Universiti Kebangsaan Malaysia Medical Center according to the regulations of declaration of Helsinki. The protocol of the study was registered at the U.S. National Institute of Health website (http:// www.clinicaltrials.gov) #NCT01752803. Data collection finished on May 2015.
A 0.6 mmol/L difference in urea level with 1.1 mmol/L standard deviation yields a significant difference with a power of 80 % [7]. Using Lemeshow et al. equation [11], the number of subjects per group became 57, and consider-ing a 20 % drop out rate, this number reached 68 subjects per group.
Intervention procedure
conducted at baseline and week 12 with at an interim analysis at week 6. The main researcher was in charge of recruitment, allocation, data collection, educating MNT and statistical analysis.
Blinding
The probiotic and placebo sachets were identical in weight, appearance, texture, nutritional value (except hav-ing probiotic in probiotic sachets), as well as smell. They were only recognizable by a code on them (A or B). The researchers and the subjects were blinded to the content of the sachets throughout the study and during the statis-tical analysis. After conducting statisstatis-tical analysis, the database was locked and the codes were revealed to the researchers at the present of a representative from the company and a witness from the department.
Adverse effects
The incidence of adverse effects was checked at each visit and by additional phone calls between each visit. Subjects were asked to report any symptom that oc-curred after commencing probiotic consumption or any changes in the severity of their ongoing conditions. The expected adverse effects were minor gastrointestinal turbances. Subjects who had severe gastrointestinal dis-turbances or any other adverse effects were asked to stop the supplement and referred to the physician. Those who stopped taking the supplement due to the adverse effects were requested to continue the trial in order to enter the respective data into the Intention To Treat (ITT) analysis.
Supplementation and compliance
Microbial cell preparation composed of six viable freeze dried microorganism strains including Lactobacillus acidophilus,Lactobacillus casei,Lactobacillus lactis, Bifi-dobacterium bifidum, Bifidobacterium longum and Bifi-dobacterium infantis with a daily dose of 6 × 10¹⁰ (Hexbio® B-Crobes Laboratory Sdn Bhd. Ipoh; Malaysia). Sachets were kept at a dry place below 25 °C away from direct sunlight and subjects were also asked to do so. The shelf life of sachets was 2 years and the sachets were delivered to the study site at 4-month intervals. Subjects were asked to pour the contents of the sachets in one glass of water (approximately 250 ml) and drink twice per day (morning and evening) with or without a meal. Subjects were asked to bring their remaining sachets at each follow up visit. Sachet count method was used to determine subject compliance, with a rate of 85–100 % considered acceptable [14].
Measurements of outcomes
Primary outcome measures were parameters of renal profile and liver function tests. Secondary measurements
including anthropometry, BMI, Energy, macronutrient and micronutrient intake as well as physical activity and sedentary behavior were also assessed in order to ensure the comparability between two groups in terms of base-line characteristics and changes throughout the study. The measurements were done at baseline, week 6 and week 12.
The weight was taken using a digital weighing scale (SECA; London British Indicators, UK). Height was measured only at baseline with a height attachment on the same weighing scale (SECA; London British Indica-tors Ltd). Waist Circumference was measured with a flexible tape. All anthropometric measurements were done twice to the nearest one decimal and the average of the measurements was considered as the final figure. BMI was then calculated. Subjects were categorized as normal weight or Overweight and Obese (OW/OB) ac-cording to the WHO classification [15].
Energy, macronutrient and micronutrient intake were measured by 3-Day Diet Records (3DDR) from each visit. Nutrient analysis was performed using a computer-ized dietary analysis program (Nutritionist Pro Version 2.0; First Data Bank, The Hearst Corp., New York). Physical activity level was assessed using a short version of the International Physical Activity Questionnaire (IPAQ) [16].
Blood samples were drawn by trained laboratory tech-nicians through the antecubital arm vein and analyzed immediately. Sodium and potassium levels were detected through ion selective electrode ion dissolved assay. Urea levels were measured by urease method. Creatinine levels were detected by Jaffe method. Total protein levels were determined by Biuret reaction. Albumin levels were detected through Bromocresol Green Dying method. Total bilirubin was measured by a 2, 4-dichlorophenyl diazonium method. The levels of ALT and AST were de-tected using a modified method of the International Fed-eration of Clinical Chemistry. The levels of Alkaline Phosphatase (ALP) were detected through Adenosine Mono Phosphate buffer. All the measurements were done using the Cobas® 8000 modular analyzer, series 702 (Roche Diagnostics, Mannheim, Germany). The ex-pected normal values were 135–150 mmol/L for sodium, 3.5 to 5 mmol/L for potassium, 2.5–6.4 mmol/L for urea, and 44 to 80 μmol/L for creatinine. Total protein: 67–88 g/L, albumin: 3.5 to 5 g/L, bilirubin: <23μmol/L, ALT :< 44U/L, ALP: 32–104 U/L, and AST: >45 U/L.
Assessment of probiotics recovery in stool
Recovery of the supplement in stool was assessed by quantification of Lactobacillus and Bifidobacterium spe-cies at baseline and week 12 on a subsample of 40 sub-jects. The Colony Forming Units (CFUs) ofLactobacillus
andBifidobacteriumspecies were counted by plate count-ing method. The accuracy of counted colonies was con-firmed through Polymerase Chain Reaction (PCR) (for the details of the procedure see Additional file 1).
Statistical analysis
Statistical analyses were performed using SPSS version 22 (SPSS Inc. Chicago, USA). The differences between tests were considered significant if the two-tailed pvalues was <0.05. Normality was confirmed by Shapiro-wilk test. Log transformation was used to obtain normal data from skewed variables. The variables are reported as mean and Standard Deviation (SD) as well as 95 % confidence inter-val. Independent samplettest and Man WhitneyUtest as well as Chi-square test were used to determine the differ-ences between groups at baseline.
ITT analysis was conducted on the full set of data with imputing method where needed. Last observation carried forward was used for imputing missing data. Per Protocol (PP) analysis was conducted on those subjects who suc-cessfully finished the third visit with more than 85 % com-pliance. The changes in variables over the course of the study were analyzed - within each group and between groups - by General Linear Model Analysis of Variance (GLM ANOVA). In this study, the results from the ITT analysis are presented in the tables and graphs, while the PP analysis results are demonstrated bypvalues only. Ef-fect size was detected for variables with significant im-provements between groups, and classified as: 0.01–0.05 considered small, 0.06–0.13 medium, and ≥0.14 consid-ered large [18].
Results
Socio-demographic characteristics and compliance rate
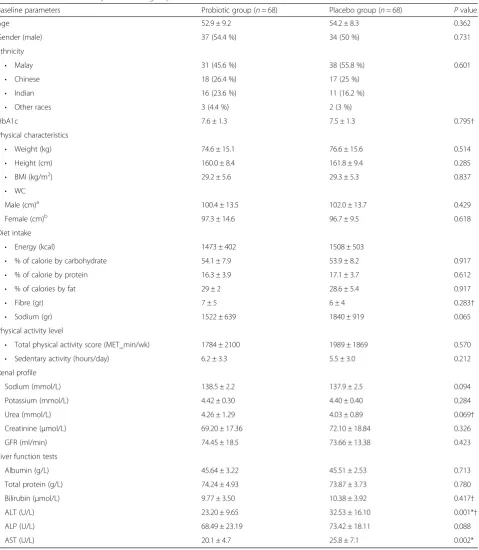
A number of 136 type 2 diabetic subjects (52.2 % male) -with mean age of 53.5 ± 8.5- agreed to join the study and were randomly allocated to probiotic (n= 68) or pla-cebo (n= 68) groups. The mean compliance rate was 86.1 % in the Placebo Group and 89.0 % in the Pro-biotic Group, which was comparable between groups (p= 0.319). The two groups were comparable at base-line in terms of age, BMI, dietary intake, physical activity level (Table 1), treatment modalities and co-morbidities (Table 2), renal profile and liver function tests (except for ALT and AST) (Table 1).
Attrition rate and incidence of adverse effects
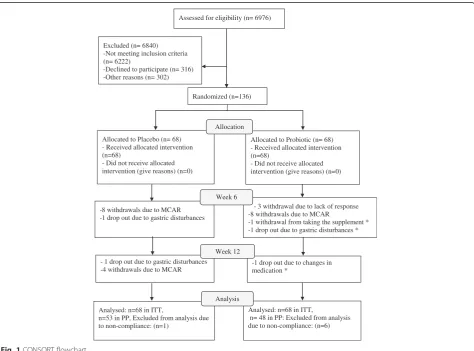
The attrition rate was 20.6 % at the end of 12 weeks and with considering non-compliance this number
reached 25.7 % (Fig. 1). Despite higher incidence of adverse effects in the Probiotic Group (8.7 %) com-pared with the Placebo Group (3.7 %), it was compar-able between groups (p= 0.156). Most of the observed adverse effects were those of expected minor gastric disturbances. Besides, Carbuncle and sexual impo-tency each happened in one of the subjects from the Probiotic Group. Two subjects (1.5 %) in the Pro-biotic Group discontinued the proPro-biotic supplement due to the adverse effects.
Recovery of probiotics in stool
TheLactobacillus andBifidobacteriumspecies increased significantly in the probiotic group as compared to the placebo group (Refer to Additional file 2).
Changes in dietary intake and physical activity levels over the course of study
The levels of physical activity, intake of energy and the percentage of energy derived from macronutrients as well as fiber intake did not change significantly over the course of the study between groups (Add-itional file 3). There was a significant change in the sodium intake between groups. A correlation analysis was carried out between sodium levels and all the pa-rameters at each visit. No significant correlation was found between sodium levels and biochemical param-eters, meaning that changes in sodium levels did not affect biochemical parameters. Thus, the subsequent analysis did not adjust for energy intake, percentage of macronutrients derived from energy, fiber, sodium intake as well as physical activity levels.
Changes in renal profile parameters over the course of study
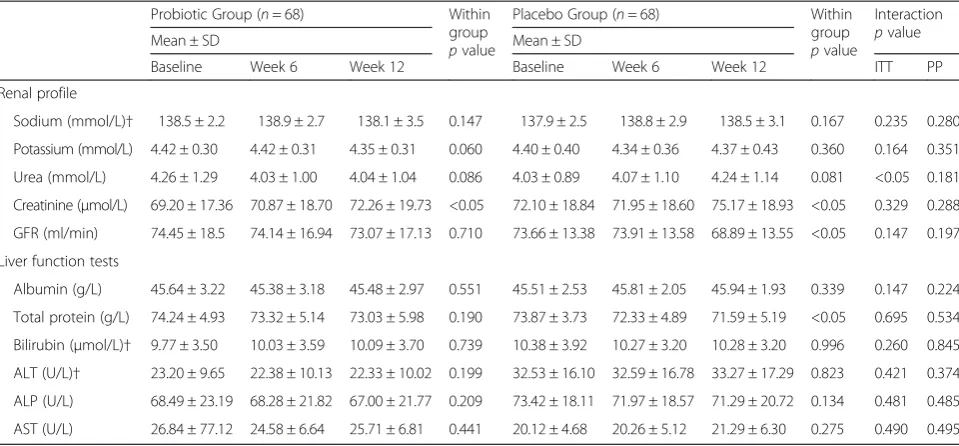
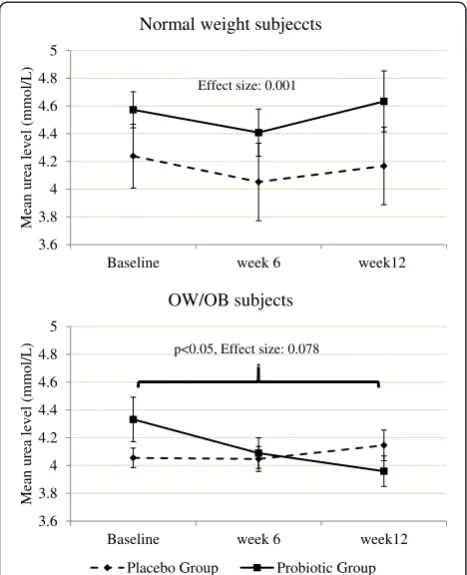
The levels of sodium and potassium did not change signifi-cantly within each group or between groups. The creatinine levels significantly decreased within each group while this decrease was not significant between groups. GFR, also, sig-nificantly decreased in the Placebo but the changes between the two groups were not statistically significant (Table 3). The levels of sodium, potassium, creatinine and GFR did not change significantly between groups in the sub-analysis of BMI categories. The changes in urea levels between groups were significant in the ITT analysis (small effect size of 0.031) but not PP (Table 3). This changes was significant from baseline to week 12 (p< 0.05) (Fig. 2).
Placebo Group (only in ITT analysis). This difference was only significant between baseline and week 12 (p< 0.05) (Fig. 3).
[image:5.595.60.540.97.648.2]Further analysis was aimed to demonstrate whether changes in urea concentrations in blood depend on the baseline urea levels. The average of the urea level
Table 1Baseline data of subjects in each group
Baseline parameters Probiotic group (n= 68) Placebo group (n= 68) Pvalue
Age 52.9 ± 9.2 54.2 ± 8.3 0.362
Gender (male) 37 (54.4 %) 34 (50 %) 0.731
Ethnicity
• Malay 31 (45.6 %) 38 (55.8 %) 0.601
• Chinese 18 (26.4 %) 17 (25 %)
• Indian 16 (23.6 %) 11 (16.2 %)
• Other races 3 (4.4 %) 2 (3 %)
HbA1c 7.6 ± 1.3 7.5 ± 1.3 0.795†
Physical characteristics
• Weight (kg) 74.6 ± 15.1 76.6 ± 15.6 0.514
• Height (cm) 160.0 ± 8.4 161.8 ± 9.4 0.285
• BMI (kg/m2) 29.2 ± 5.6 29.3 ± 5.3 0.837
• WC
Male (cm)a 100.4 ± 13.5 102.0 ± 13.7 0.429
Female (cm)b 97.3 ± 14.6 96.7 ± 9.5 0.618
Diet intake
• Energy (kcal) 1473 ± 402 1508 ± 503
• % of calorie by carbohydrate 54.1 ± 7.9 53.9 ± 8.2 0.917
• % of calorie by protein 16.3 ± 3.9 17.1 ± 3.7 0.612
• % of calories by fat 29 ± 2 28.6 ± 5.4 0.917
• Fibre (gr) 7 ± 5 6 ± 4 0.283†
• Sodium (gr) 1522 ± 639 1840 ± 919 0.065
Physical activity level
• Total physical activity score (MET_min/wk) 1784 ± 2100 1989 ± 1869 0.570
• Sedentary activity (hours/day) 6.2 ± 3.3 5.5 ± 3.0 0.212
Renal profile
Sodium (mmol/L) 138.5 ± 2.2 137.9 ± 2.5 0.094
Potassium (mmol/L) 4.42 ± 0.30 4.40 ± 0.40 0.284
Urea (mmol/L) 4.26 ± 1.29 4.03 ± 0.89 0.069†
Creatinine (μmol/L) 69.20 ± 17.36 72.10 ± 18.84 0.326
GFR (ml/min) 74.45 ± 18.5 73.66 ± 13.38 0.423
Liver function tests
Albumin (g/L) 45.64 ± 3.22 45.51 ± 2.53 0.713
Total protein (g/L) 74.24 ± 4.93 73.87 ± 3.73 0.780
Bilirubin (μmol/L) 9.77 ± 3.50 10.38 ± 3.92 0.417†
ALT (U/L) 23.20 ± 9.65 32.53 ± 16.10 0.001*†
ALP (U/L) 68.49 ± 23.19 73.42 ± 18.11 0.088
AST (U/L) 20.1 ± 4.7 25.8 ± 7.1 0.002*
Results are expressed as Mean ± SD orn(%) where appropriate
Abbreviation: OAD: Oral Anti-Diabetic Agent, OW/OB: Overweight and obese, HbA1c: Hemoglobin A1c
†log transformed independent samplet-test
*significant difference between two groups a
n= 34 in Placebo Group,n= 31 in Probiotic Group,b
at baseline (4.2 mmol/L) were used as cut off and the data split to those with lower levels of 4.2 mmol/L and those with higher levels of 4.2 mmol/L. Interest-ingly, in the group with urea levels of higher than 4.2 mmol/L, the changes in the urea levels between the Probiotic and Placebo Group was significant, while it did not show any significance in the other group (Fig. 4).
Changes in liver function tests over the course of study
The mean of all the liver function tests did not change significantly between or within groups (Table 3). Except for total protein which was significantly reduced in the Placebo Group in within group analysis (p= 0.006).
Discussion
Changes in renal profile parameters over the course of study
Results of this study showed that probiotics have the po-tential to improve urea levels especially among OW/OB subjects and those with elevated levels of urea. However, other parameters of renal profile as well as liver function tests have not been affected by probiotics.
[image:6.595.56.291.101.234.2]The mean levels of sodium and potassium in the blood have not changed after probiotic supplementation. The creatinine levels increased significantly within each group. This rise may be attributed to the intake of Angiotensin-Converting Enzyme inhibitor (ACE inhibi-tor) in the subjects of this study as previous literature had demonstrated that chronic ACE inhibitor adminis-tration increases the creatinine levels [19]. Surging levels
Table 2Treatment modalities at baseline
Baseline parameters Probiotic group (n= 68)
Placebo group
(n= 68) P
value
n (%) n (%)
Diet alone 6 (8.8 %) 1 (1.4 %) 0.660
Single OAD 19 (28.0 %) 16 (23.6 %) 0.589
Dual OAD 37 (54.4 %) 40 (58.8 %) 0.912
>2 types OAD 6 (8.8 %) 11 (16.2 %) 0.486
On Antihypertensive 47 (69.2 %) 48 (70.6 %) 0.943
On Anti-hyperlipidemic 54 (79.4 %) 58 (85.4 %) 0.610
Obesity 18 (26.5 %) 14 (20.6 %) 0.419
Assessed for eligibility (n= 6976)
Excluded (n= 6840) -Not meeting inclusion criteria (n= 6222)
-Declined to participate (n= 316) -Other reasons (n= 302)
Analysed: n=68 in ITT,
n=53 in PP, Excluded from analysis due to non-compliance: (n=1)
-8 withdrawals due to MCAR -1 drop out due to gastric disturbances
Allocated to Placebo (n= 68) - Received allocated intervention (n=68)
- Did not receive allocated intervention (give reasons) (n=0)
- 3 withdrawal due to lack of response -8 withdrawals due to MCAR
-1 withdrawal from taking the supplement * -1 drop out due to gastric disturbances *
Allocated to Probiotic (n= 68) - Received allocated intervention (n=68)
- Did not receive allocated intervention (give reasons) (n=0)
Analysed: n=68 in ITT,
n= 48 in PP: Excluded from analysis due to non-compliance: (n=6) Allocation
Analysis Week 6 Randomized (n=136)
- 1 drop out due to gastric disturbances -4 withdrawals due to MCAR
-1 drop out due to changes in medication *
Week 12
[image:6.595.62.537.374.725.2]of creatinine has led to subsequent significant decrease in GFR in the Placebo Group in this study. However, the mean creatinine levels did not show any changes be-tween groups. This is in line with the study by Alatriste et al. [7], whereby eight weeks of supplementation with
L. casei shirotadid not contribute to any changes in cre-atinine levels in patients who were suffering from stage 3 and 4 of CKD.
In the current study, the ITT analysis found 5.2 % significant reduction in the urea levels in the Probiotic Group. In a study using subjects with stage 3 and 4 of chronic renal disease, a non-significant reduction of up to 3.4 % in urea level was noted after supplementation for two months with dose of 8 × 10⁹L. casei shirota and a significant reduction of up to 11 % with the dosage of 16 × 109[7]. Despite higher dosages of up to 7.5-fold and
3.5-fold in the current study compared with 8 × 10⁹ and 16 × 109 dosage used in the Alatriste et al. study [7], re-spectively; the reduction noted in our study was lower than the former. In addition, the duration of supplementa-tion in the current study was four weeks longer than the Alatriste et al.’s [7] study. The reason for the higher de-cline in their study can be due to the higher baseline levels of urea in their study (approximately 4.53 mmol/L) com-pared with the present study (4.3 in Placebo Group and 4.26 in Probiotic Group). Similarly, this study showed that probiotic supplementation has better outcomes among those with high urea levels.
[image:7.595.58.538.100.323.2]The amount of protein intake may influence urea levels [20]. However, the protein intake of the subjects in both group were comparable at baseline and did not change significantly over the course of the study.
Table 3Renal profile and liver function tests throughout the study in Probiotic and Placebo Groups
Probiotic Group (n= 68) Within
group pvalue
Placebo Group (n= 68) Within
group pvalue
Interaction pvalue
Mean ± SD Mean ± SD
Baseline Week 6 Week 12 Baseline Week 6 Week 12 ITT PP
Renal profile
Sodium (mmol/L)† 138.5 ± 2.2 138.9 ± 2.7 138.1 ± 3.5 0.147 137.9 ± 2.5 138.8 ± 2.9 138.5 ± 3.1 0.167 0.235 0.280
Potassium (mmol/L) 4.42 ± 0.30 4.42 ± 0.31 4.35 ± 0.31 0.060 4.40 ± 0.40 4.34 ± 0.36 4.37 ± 0.43 0.360 0.164 0.351
Urea (mmol/L) 4.26 ± 1.29 4.03 ± 1.00 4.04 ± 1.04 0.086 4.03 ± 0.89 4.07 ± 1.10 4.24 ± 1.14 0.081 <0.05 0.181
Creatinine (μmol/L) 69.20 ± 17.36 70.87 ± 18.70 72.26 ± 19.73 <0.05 72.10 ± 18.84 71.95 ± 18.60 75.17 ± 18.93 <0.05 0.329 0.288 GFR (ml/min) 74.45 ± 18.5 74.14 ± 16.94 73.07 ± 17.13 0.710 73.66 ± 13.38 73.91 ± 13.58 68.89 ± 13.55 <0.05 0.147 0.197
Liver function tests
Albumin (g/L) 45.64 ± 3.22 45.38 ± 3.18 45.48 ± 2.97 0.551 45.51 ± 2.53 45.81 ± 2.05 45.94 ± 1.93 0.339 0.147 0.224
Total protein (g/L) 74.24 ± 4.93 73.32 ± 5.14 73.03 ± 5.98 0.190 73.87 ± 3.73 72.33 ± 4.89 71.59 ± 5.19 <0.05 0.695 0.534
Bilirubin (μmol/L)† 9.77 ± 3.50 10.03 ± 3.59 10.09 ± 3.70 0.739 10.38 ± 3.92 10.27 ± 3.20 10.28 ± 3.20 0.996 0.260 0.845 ALT (U/L)† 23.20 ± 9.65 22.38 ± 10.13 22.33 ± 10.02 0.199 32.53 ± 16.10 32.59 ± 16.78 33.27 ± 17.29 0.823 0.421 0.374
ALP (U/L) 68.49 ± 23.19 68.28 ± 21.82 67.00 ± 21.77 0.209 73.42 ± 18.11 71.97 ± 18.57 71.29 ± 20.72 0.134 0.481 0.485
AST (U/L) 26.84 ± 77.12 24.58 ± 6.64 25.71 ± 6.81 0.441 20.12 ± 4.68 20.26 ± 5.12 21.29 ± 6.30 0.275 0.490 0.495
†log transformed GLM ANOVA
-0.4 -0.3 -0.2 -0.1 0 0.1 0.2 0.3
Chang
es
in urea
leve
l
from baseline
(mmol/L
)
Changes in week 6
Changes in week 12 p<0.05
Placebo Group Probiotic Group
[image:7.595.67.494.542.719.2]Thence, the changes in urea levels cannot be contribute to changes in protein intake. In the quest of linking pro-biotic supplementation with renal status, it is worth mentioning that patients with renal diseases usually have impaired intestinal microbiota. Majority of uremic pa-tients have disturbances in gastrointestinal tract mucus and the intestinal ecosystem. Most of these patients have
[image:8.595.57.291.89.377.2] [image:8.595.58.540.524.717.2]higher levels of aerobic bacteria such asEscherichia coli (E.Coli) and lower levels of anaerobic microorganisms such asLactobacillus andBifidobacterium. The increase in the levels ofE.coliwill contribute to a high production of urea and an increase in pH levels. By introducing lactic acid bacteria such as Lactobacillus and Bifidobacterium, the pH decreases through fermentation of carbohydrates [3, 7, 21]. Thence, these bacteria prevent proliferation of aerobic bacteria in the gut and promote a balanced micro-biota in the gut [22]. Another possible explanation is deg-radation of urea by urease activity of selected probiotic species, e.g.Bacteroides[22].
Urea levels significantly improved after probiotic sup-plementation in OW/OB subjects. Yet, how changes in urea levels differ between normal weight and OW/OB cannot be explained easily. One possible theory may be related to the different proportion of the bacteria phyla found in OW/OB compared with normal weight sub-jects. Interestingly, obese people have higher proportions of E. coli [23]. Therefore, it can be hypothesised that probiotic supplementation induces more decline in the amount of E. coli in OW/OB subjects compared with normal weight subjects. This may partly explain why there is significant decrease in urea levels in OW/OB subjects compared with normal weight subjects. Overall, the results of the present study showed that probiotics are effective therapies for decreasing urea levels in OW/ OB subjects.
Changes in liver function tests over the course of study
In this study, the albumin and total protein levels were within the normal range at baseline and did not change significantly between groups over the course of the study. In within group comparison, total protein de-creased in both groups while this decline was significant 3.6
3.8 4 4.2 4.4 4.6 4.8 5
Baseline week 6 week12
Mean urea level
(mmol/L
)
Normal weight subjeccts
Effect size: 0.001
3.6 3.8 4 4.2 4.4 4.6 4.8 5
Baseline week 6 week12
Mea
n
urea level
(mmol/L
)
OW/OB subjects
Placebo Group Probiotic Group p<0.05, Effect size: 0.078
Fig. 3Mean urea levels between study groups in week 6 and week 12 among normal weight and OW/OB subjects
-1 -0.8 -0.6 -0.4 -0.2 0 0.2 0.4 0.6
Chang
es in
Urea levels from
B
aseline (mmol/L
)
Urea>4.2 Urea<4.2
Placebo (n=23, 33.8%)
Probiotic (n=30, 44.1%)
Placebo (n=41,60.3%)
Probiotic (n=32, 47.1%)
Effect size: 0.131, p<0.05 Effect size: 0.014
in the Placebo Group. The reason for within group changes remained unclear. Two human studies have shown some improvements in albumin and total protein levels after probiotic consumption among ulcerative colitis patients [24] and elderly hospitalised subjects [25]. How-ever, these increases are contributed for protecting the in-tegrity of the gut mucosa and overall well-being of the subjects due to the probiotics role in defecting infection, and thus cannot be generalized to diabetic individuals.
In the current study, no significant improvements were found with regard to other liver function parame-ters including bilirubin, ALT, ALP, and AST. The base-line values of ALP and AST were significantly higher in the placebo group. However, the GLM ANOVA auto-matically adjusts the analysis for baseline values. In terms of changes after supplementation, there is a grow-ing body of evidence which shows improvements after probiotic supplementation in subjects with alcoholic [26–28] or non-alcoholic fatty liver disease [29, 30]. Overall, from the findings of this study it can be con-cluded that, probiotics are not effective in improving liver parameters among type 2 diabetic individuals with healthy liver status.
Despite the potential impact of probiotics on liver function, another aspect of determining liver function is predicting the safety of probiotic supplementation. Conventional liver function tests are determinants of drug-induced liver toxicity. The extent of liver injuries due to drug-induced liver toxicity varies from mild asymptomatic liver injuries to acute hepatocellular hepatitis which is detectable through changes in ALT [31]. In addition, each component of liver function tests represents a special function of the liver [32]. Therefore, not inducing any significant increase in these parameters in the current study indicates that the daily dose of 6 × 10¹⁰ CFUs of bacteria for three months have not contributed to any drug-induced liver injury among type 2 diabetic individuals.
The current study has several limitations which should be taken into account before generalization of the results. First of all, the recovery of the probiotic in the stool was tested among a subsample of the population. Although PCR method showed significant increase in the quantities of the Lactobacillus and
Bifidobacterium, it would be more precise if 16S rRNA gene sequencing would have been used. Main researcher was in charge of randomization, while it would have had an added advantage if disclosing randomization sequence would have performed by a third person at the recruitment time. Indeed, stool analysis was conducted on a subsample of the subjects. The last is the small sample size and short duration of study. Larger sample size and longer dur-ation of study would have been more appropriate to
observe an improvement in the renal and liver func-tion. Looking at the upside, this study is one of its kinds which assessed the impact of probiotic supple-mentation on healthy status of renal and liver among type 2 diabetes individuals who are at risk of renal failure or kidney injuries. Besides, in this study the subjects were matched in terms of diet intake and physical activity levels and had a high compliance to the supplement.
Conclusion
Overall, this study showed that a multi-strain probiotic supplement consisting ofLactobacillusandBifidobacterium
with a dosage of 6 × 10¹⁰it was beneficial in improving urea levels particularly among overweight and obese subjects and it did not induce any liver toxicity among type 2 dia-betics. It is of utmost importance in the context of prevent-ing chronic renal failure among type 2 diabetic individuals. Future research should target to demonstrate the mechan-ism behind this effect.
Additional files
Additional file 1:Method of quantifying Lactobacillus spp. and
Bifidobacteriumspp.(DOCX 133 kb)
Additional file 2:Quantities ofLactobacillusspp. and
Bifidobacteriumspp. before and after intervention in both groups.(XLSX 10 kb)
Additional file 3:Changes in Dietary intake and physical activity level at baseline, week 6 and week 12.(XLSX 11 kb)
Abbreviations
CKD:Chronic Kidney Disease; ALT: Alanine Aminotransferase; AST: Aspartate Transaminase; TNFα: Tumor Necrosis Factor Alpha; HbA1c: Glycated Hemoglobin A1c; FBG: Fasting Blood Glucose; BMI: Body Mass Index; MNT: Medical Nutrition Therapy; ITT: Intention To Treat; OW/OB: Overweight/ Obese; WHO: World Health Organization; 3DDR: Three Day Diet Record; IPAQ: International Physical Activity Questionnaire; ALP: Alkaline Phosphatase; GFR: Glomerular Filtration Rate; CFUs: Colony Forming Units; PCR: Polymerase Chain Reaction; SD: Standard Deviation; PP: Per Protocol; GLM ANOVA: General Linear Model Analysis of Variance; ACE inhibitor: Angiotensin-Converting Enzyme inhibitors;E. Coli:Escherichia Coli..
Competing interests
The authors declare no conflict of interest. The Hexbio® B-Crobes Laboratory Sdn. Bhd. provided the supplement and partly fund the research project. This company did not interfere with the decision to exploit research results.
Authors’contributions
The authors’responsibilities were as follows: SF (PhD student): conceived and coordinate the study, carried out the laboratory testing and statistical analysis, and draft the manuscript; B-N M-Y: served as principle investigator, participated in the design of the study and reviewed the manuscript; AI: reviewed the manuscript; HAM: conceived of the study, participated in its design and critically reviewed the manuscript; NAK: conceived of the study, and participated in its design and coordination. All the subjects were responsible for the study design. All authors read and approved the final manuscript.
Acknowledgement
Funding
The study was funded by internal grant of Universiti Putra Malaysia and research grant of B-Crobes Laboratory Sdn. Bhd. The supplements were provided by “B-Crobes Laboratory Sdn. Bhd.”
Author details
1Department of Nutrition and Dietetics, Faculty of Medicine and Health
Sciences, University Putra Malaysia, 43400 Serdang, Selangor, Malaysia. 2Research Centre of Excellence for NCD (Nutrition and Non-communicable
Diseases), Universiti Putra Malaysia,, 43400 UPM Serdang, Selangor, Malaysia. 3Centre for Population Health and Department of Social and Preventive
Medicine, Faculty of Medicine, University of Malaya, Kuala Lumpur, Malaysia. 4Department of Medicine, Faculty of Medicine, University Kebangsaan
Malaysia, Kuala Lumpur, Malaysia.
Received: 2 July 2015 Accepted: 27 November 2015
References
1. Afkarian M, Sachs MC, Kestenbaum B, Hirsch IB, Tuttle KR, Himmelfarb J, et al. Kidney Disease and Increased Mortality Risk in Type 2 Diabetes. J Am Soc Nephrol. 2013;24:302–8.
2. Tolman KG, Fonseca V, Dalpiaz A, Tan MH. Spectrum of liver disease in type 2 diabetes and management of patients with diabetes and liver disease. Diabetes Care. 2007;30:734–43.
3. Vaziri ND, Wong J, Pahl M, Piceno YM, Yuan J, DeSantis TZ, et al. Chronic kidney disease alters intestinal microbial flora. Kidney Int. 2012;83:308–15. 4. Miele L, Valenza V, La Torre G, Montalto M, Cammarota G, Ricci R, et al.
Increased intestinal permeability and tight junction alterations in nonalcoholic fatty liver disease. Hepatology. 2009;49:1877–87. 5. Nakabayashi I, Nakamura M, Kawakami K, Ohta T, Kato I, Uchida K, et al.
Effects of synbiotic treatment on serum level of p-cresol in haemodialysis patients: a preliminary study. Nephrol Dial Transplant. 2011;26:1094–8. 6. Simenhoff ML, Dunn SR, Zollner GP, Fitzpatrick ME, Emery SM, Sandine WE,
et al. Biomodulation of the toxic and nutritional effects of small bowel bacterial overgrowth in end-stage kidney disease using freeze-dried Lactobacillus acidophilus. Miner Electrolyte Metab. 1996;22:92. 7. Alatriste PVM, Arronte RU, Espinosa COG, Cuevas M d LÁE: Effect of
probiotics on human blood urea levels in patients with chronic renal failure. Nutr Hosp. 2014;29:582–590.
8. Ranganathan N, Ranganathan P, Friedman EA, Joseph A, Delano B, Goldfarb DS, et al. Pilot study of probiotic dietary supplementation for promoting healthy kidney function in patients with chronic kidney disease. Adv Ther. 2010;27:634–47.
9. Ma YY, Li L, Yu C-H, Shen Z, Chen L-H, Li Y-M. Effects of probiotics on nonalcoholic fatty liver disease: A meta-analysis. World J Gastroenterol WJG. 2013;19:6911.
10. Rishi P, Mavi SK, Bharrhan S, Shukla G, Tewari R. Protective efficacy of probiotic alone or in conjunction with a prebiotic in Salmonella-induced liver damage. FEMS Microbiol Ecol. 2009;69:222–30.
11. Lemeshow S, Hosmer DW, Klar J, Lwanga SK. Adequacy of Sample Size in Health Studies. Chichester: Wiley; 1990.
12. Cole HS, Camerini-Davalos RA. Diet therapy of diabetes mellitus. Med Clin North Am. 1970;54:1577–87.
13. Malaysian Dietitians’Association. Medical Nutrition Therapy Guideline for Type 2 Diabetes Mellitus. Ministry of Health, Kuala Lumpur; Malaysia 2013. 14. Krueger KP, Felkey BG, Berger BA. Improving adherence and persistence: a review and assessment of interventions and description of steps toward a national adherence initiative. J Am Pharm Assoc. 2003;43:668–79. 15. WHO: Obesity. Preventing and Managing the Global Epidemic Report of a
WHO Consultation (WHO Technical Report Series 894). World Health Organization; Geneva 2000.
16. Craig CL, Marshall AL, Sjöström M, Bauman AE, Booth ML, Ainsworth BE, et al. International physical activity questionnaire: 12-country reliability and validity. Med Sci Sport Exerc. 2003;35:1381.
17. Levey AS, Bosch JP, Lewis JB, Greene T, Rogers N, Roth D. A more accurate method to estimate glomerular filtration rate from serum creatinine: a new prediction equation. Modification of Diet in Renal Disease Study Group. Ann Intern Med. 1999;130:461–70.
18. Fritz C, Morris P, Richler J. Effect size estimates: current use, calculations, and interpretation. J Exp Psychol Gen. 2012;141:2–18.
19. Cirit M, Toprak O, Yesil M, Bayata S, Postaci N, Pupim L, et al. Angiotensin-converting enzyme inhibitors as a risk factor for contrast-induced nephropathy. Nephron Clin Pract. 2006;104:c20–7.
20. Goldring W, Razinsky L, Greenblatt M, Cohen S. The influence of protein intake on the urea clearance in normal man. J Clin Invest. 1934;13(5):743–8. 21. Vaziri ND. CKD impairs barrier function and alters microbial flora of the
intestine: a major link to inflammation and uremic toxicity. Curr Opin Nephrol Hypertens. 2012;21:587–92.
22. Parvez S, Malik KA, Ah Kang S, Kim H-Y. Probiotics and their fermented food products are beneficial for health. J Appl Microbiol. 2006;100:1171–85. 23. Rajkumar H, Mahmood N, Kumar M, Varikuti SR, Challa HR, Myakala SP. Effect
of probiotic (VSL#3) and omega-3 on lipid profile, insulin sensitivity, inflammatory markers, and gut colonization in overweight adults: a randomized, controlled trial. Mediators Inflamm. 2014;2014:348959. 24. Ishikawa H, Akedo I, Umesaki Y, Tanaka R, Imaoka A, Otani T. Randomized
Controlled Trial of the Effect of Bifidobacteria-Fermented Milk on Ulcerative Colitis. J Am Coll Nutr. 2003;22:56–63.
25. Fukushima Y, Miyaguchi S, Yamano T, Kaburagi T, Iino H, Ushida K, et al. Improvement of nutritional status and incidence of infection in hospitalised, enterally fed elderly by feeding of fermented milk containing probiotic Lactobacillus johnsonii La1 (NCC533). Br J Nutr. 2007;98:969–77. 26. Kirpich IA, Solovieva NV, Leikhter SN, Shidakova NA, Lebedeva OV, Sidorov PI,
et al. Probiotics restore bowel flora and improve liver enzymes in human alcohol-induced liver injury: a pilot study. Alcohol. 2008;42:675–82. 27. Wang Y, Kirpich I, Liu Y, Ma Z, Barve S, McClain CJ, et al. Lactobacillus
rhamnosus GG treatment potentiates intestinal hypoxia-inducible factor, promotes intestinal integrity and ameliorates alcohol-induced liver injury. Am J Pathol. 2011;179:2866–75.
28. Bang CS, Hong SH, Suk KT, Kim JB, Han SH, Sung H, et al. Effects of Korean Red Ginseng (Panax ginseng), urushiol (Rhus vernicifera Stokes), and probiotics (Lactobacillus rhamnosus R0011 and Lactobacillus acidophilus R0052) on the gut–liver axis of alcoholic liver disease. J Ginseng Res. 2014; 38:167–72.
29. Ma X, Hua J, Li Z. Probiotics improve high fat diet-induced hepatic steatosis and insulin resistance by increasing hepatic NKT cells. J Hepatol. 2008;49: 821–30.
30. Velayudham A, Dolganiuc A, Ellis M, Petrasek J, Kodys K, Mandrekar P, et al. VSL#3 probiotic treatment attenuates fibrosis without changes in steatohepatitis in a diet-induced nonalcoholic steatohepatitis model in mice. Hepatology. 2009;49:989–97.
31. Kaplowitz N. Drug-induced liver injury. Clin Infect Dis. 2004;38 Suppl 2:S44–8. 32. Seyama Y, Kokudo N. Assessment of liver function for safe hepatic resection.
Hepatol Res. 2009;39:107–16.
• We accept pre-submission inquiries
• Our selector tool helps you to find the most relevant journal
• We provide round the clock customer support
• Convenient online submission
• Thorough peer review
• Inclusion in PubMed and all major indexing services
• Maximum visibility for your research
Submit your manuscript at www.biomedcentral.com/submit