www.hydrol-earth-syst-sci.net/18/1349/2014/ doi:10.5194/hess-18-1349-2014
© Author(s) 2014. CC Attribution 3.0 License.
Hydrology and
Earth System
Sciences
Recent evolution of China’s virtual water trade: analysis of selected
crops and considerations for policy
J. Shi1,2, J. Liu1, and L. Pinter2,3
1School of Nature Conservation, Beijing Forestry University, Beijing, 100083, China
2Department of Environmental Sciences and Policy, Central European University, Budapest, Hungary
3International Institute for Sustainable Development, 161 Portage Avenue East, Winnipeg, MB R3B 0Y7, Canada
Correspondence to: J. Liu ([email protected]; [email protected])
Received: 22 July 2013 – Published in Hydrol. Earth Syst. Sci. Discuss.: 17 September 2013 Revised: 19 February 2014 – Accepted: 28 February 2014 – Published: 8 April 2014
Abstract. China has dramatically increased its virtual
wa-ter import over recent years. Many studies have focused on the quantity of traded virtual water, but very few go into analysing geographic distribution and the properties of China’s virtual water trade network. This paper provides a calculation and analysis of the crop-related virtual water trade network of China based on 27 major primary crops between 1986 and 2009. The results show that China is a net importer of virtual water from water-abundant areas of North America and South America, and a net virtual water exporter to water-stressed areas of Asia, Africa, and Europe. Virtual water import is far larger than virtual water export, and in both import and export a small number of trade part-ners control the supply chain. Grain crops are the major con-tributors to virtual water trade, and among grain crops, soy-beans, mostly imported from the US, Brazil and Argentina, are the most significant. In order to mitigate water scarcity and secure the food supply, virtual water should actively be incorporated into national water management strategies. And the sources of virtual water import need to be further diver-sified to reduce supply chain risks and increase resilience.
1 Introduction
Studies on virtual water trade have been carried out at differ-ent scales. At a global level, Hoekstra and Hung (2005) cal-culated the volume of crop-related international virtual wa-ter flows from 1995 to 1999 and found that, conservatively, 13 % of the water used in crop production is for export in virtual water form. Chapagain et al. (2005, 2006) estimated
that virtual water trade has saved 6% of global agricultural water use, which equals 28% of the total amount of virtual water flows associated with international agricultural trade. Further research by Hoekstra (2010) has also shown that cur-rent water use in agriculture is reduced by 5 % through in-ternational virtual water trade. Dalin et al. (2012a) used a network approach to analyse the evolution of the global vir-tual water flows from 1986 to 2007. Their findings support the argument that global virtual water trade associated with international food trade has increased global water use ef-ficiency and thus contributes to global water resource sav-ing, although both regional and national virtual water trade patterns have changed a lot. Also, despite efficiency im-provements, global and in many cases regional water with-drawals continue to increase in absolute terms, due to the combined effect of population growth and increasing afflu-ence (Ozkaynak et al., 2012).
resources. Other studies on Mediterranean countries such as Spain have shown that its virtual water import associated with grain trade is consistent with relative water scarcity, but the evolution of grain exports does not match the variations in resource scarcity, which suggests other factors including quality, product specification or the demand for a standard-ized product also influences virtual water trade (Novo et al., 2009).
China is a water-poor country in terms of water resource per capita and faces a trend of exacerbating water inequali-ties between water-abundant south and water-stressed north in general (Jiang, 2009; Liu et al., 2013). Studies (Liu et al., 2007; Liu and Savenije, 2008) have shown that the virtual water trade of China, which is influenced by both micro-and macro-economic conditions micro-and weather fluctuations, has developed unconsciously, and they have suggested that active virtual water strategy could play a more important role in food security and sustainable water use, as China’s agricultural commodity markets are liberalized. Yang and Zehnder (2001) analysed water scarcity in the North China Plain and pointed out that virtual water import should be taken as an additional measure in contrast with the conven-tional wisdom of “opening up new sources and economizing on the use of resources” to meet growing water demand.
Literature is available on the amount of virtual water traded between China and other countries, but there is a lack of research on the geographic distribution of China’s virtual water trade network, how it has evolved over time, and what its implications for global and national water resources are. Also, the network properties of a China-centred virtual water trade network have never been analysed. This study aimed at reconstructing the evolution, geographic distribution and patterns of China’s crop-related virtual water trade network over the last 2 decades and drawing corresponding policy implications.
2 Methods
2.1 Selection of crops studied
In order to portray the representative profile of crop-related virtual water trade network of China, we selected 27 primary crops which constitute around 80 % of the total harvested area of the primary crops in China from 1986 to 2009 by average (FAOSTAT, 2014). They were categorized in four groups including eight grain crops, six fruit crops, six veg-etable crops and seven cash crops. The categorization of se-lected crops followed Liu et al. (2007) to make the results comparable, which incorporated soybeans in grain crops as the traditional way of Chinese statistics and separated fruits and vegetables from cash crops.
2.2 Crop yields
Crop yields data were extracted from FAOSTAT (2014). Yields of all selected crops showed a general increasing trend over the studied period, with complicated oscillating patterns due to the mutual impacts from improvement of technolo-gies, climate fluctuations, a warming trend possibly due to climate change, the associated growing concentration of at-mospheric CO2, and changes in relevant social and economic policies.
2.3 Virtual water content
Virtual water content here is defined as the volume of water used in order to produce a unit of a crop. For primary crops, it is calculated by directly dividing the national average crop water requirement by corresponding crop yield in each year such as in Renault (2003), Zimmer and Renault (2003) and Liu et al. (2007). In this study, the same virtual water con-tent of a type of commodity was used for China and other countries. This is in light of the fact that food export is a pro-cess of transferring virtual water from China to trade part-ners abroad, while food import can mitigate China’s water scarcity by reducing water use in domestic food production. Table 1 shows the crop category, crop water requirement, crop yield and virtual water content of selected crops be-tween 1986 and 2009.
2.4 Virtual water trade
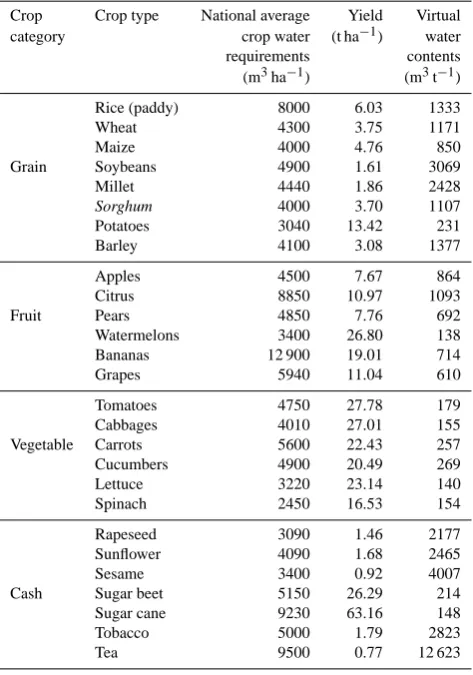
Table 1. National average crop water requirements, crop yields (av-erage between 1986 and 2009) and virtual water contents (av(av-erage between 1986 and 2009) for selected crops. Data source for national average crop water requirements was Liu et al. (2007); data source for crop yields was FAOSTAT (2014).
Crop Crop type National average Yield Virtual category crop water (t ha−1) water requirements contents (m3ha−1) (m3t−1) Rice (paddy) 8000 6.03 1333 Wheat 4300 3.75 1171 Maize 4000 4.76 850 Grain Soybeans 4900 1.61 3069 Millet 4440 1.86 2428
Sorghum 4000 3.70 1107
Potatoes 3040 13.42 231 Barley 4100 3.08 1377 Apples 4500 7.67 864 Citrus 8850 10.97 1093 Fruit Pears 4850 7.76 692 Watermelons 3400 26.80 138 Bananas 12 900 19.01 714 Grapes 5940 11.04 610 Tomatoes 4750 27.78 179 Cabbages 4010 27.01 155 Vegetable Carrots 5600 22.43 257 Cucumbers 4900 20.49 269 Lettuce 3220 23.14 140 Spinach 2450 16.53 154 Rapeseed 3090 1.46 2177 Sunflower 4090 1.68 2465 Sesame 3400 0.92 4007 Cash Sugar beet 5150 26.29 214 Sugar cane 9230 63.16 148 Tobacco 5000 1.79 2823 Tea 9500 0.77 12 623
Note: Liu et al. (2007) used National Bureau of Statistics of China (NBSC) data in the calculation of national average crop water requirements. The reasons are as follows. The national and provincial data are sufficient to analyse the virtual water trade patterns in China in this paper. Although more spatially explicit data sets are available, we do not need grid-based data for the virtual water trade analysis (and it is also difficult to do such analyses because trade data are not available at a grid cell level). For the national and provincial data, NBSC is the most commonly used data source. As yearly crop water requirement data are not available, we assume the same water requirement for a certain crop in different years in the same producing region.
2.5 Virtual water trade network
The virtual water trade relationships between China and “vir-tual water trade partners” (VWTPs) can be viewed collec-tively as a directed and weighted virtual water trade network (Dalin et al., 2012a). Each trade partner forms a node in the trade network in a given year, and virtual water flows as-sociated with corresponding agricultural commodities form the links between nodes with the direction pointing to China as net virtual water import and the direction pointing from China as net virtual water export, respectively. The volume of traded virtual water between each pair of trade partners is the weight of the link. The number of trade partners is
described by the node degreek, and the sum of weights is denoted by node strengths. The data reported by China were solely used irrespective of any divergence from the data re-ported by the other trade partners as the impact of such data divergence is assumed negligible, if any. It is also assumed that no direct trade was taking place if no data were reported between China and a certain country in a given year.
3 Results
3.1 Crop-related virtual water trade of China
China’s crop-related VWTPs are from all six continents, but most are located in Asia, Europe and Africa. The total num-ber of VWTPs has increased significantly since 1986, though the geographic distribution of VWTPs by continent has re-mained unchanged. In 1986, there are 24 VWTPs from Asia, Europe and Africa while there are 10 from North Amer-ica, South America and Oceania. And in 2009, there are 125 VWTPs from Asia, Europe and Africa, and there are 34 from the Americas and Oceania. Note that, generally, Asia, Europe and Africa are net VWEPs while the Ameri-cas and Oceania are net VWIPs, from whom China imported much larger volumes of virtual water than that exported to net VWEPs. However, the patterns of import–export rela-tionships have changed significantly over recent years, as the number of net VWIPs keeps rather steady, but the number of net VWEPs has drastically increased. Figure 1 shows the evolution of crop-related VWTPs of China over the period 1986–2009. Although there are more countries in Asia, Eu-rope and Africa in total, there is no evidence showing that a simple relationship exists between the number of coun-tries in one certain continent and the growth rate of the num-ber of trade partners in that same continent. The building of trade partnership is driven by multiple factors including ge-ographic distance, economic comparative advantage, inter-national relationship etc. The correlation between the geo-graphic location of the trade partners by continent and water endowment of the corresponding continent implies water en-dowment might be an important factor driving to form such a pattern.
Fig. 1. (a) The evolution of geographic distribution in number of China’s VWTPs by continent over the period of 1986–2009; (b) the evolution of import–export relationship in number of China’s VWTPs over the period of 1986–2009. Net VWIPs (blue) represent trade partners from whom China imported virtual water, and net VWEPs (pink) represent trade partners to whom China exported virtual water.
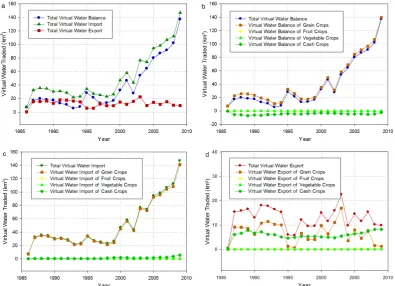
Fig. 2. Crop-related virtual water trade of China over the period of 1986–2009: (a) total virtual water trade of China; (b) contributions of different crops to total virtual water balance; (c) contributions of different crops to total virtual water import; (d) contributions of different crops to total virtual water export.
3.2 Geographic distribution of virtual water trade
network of China
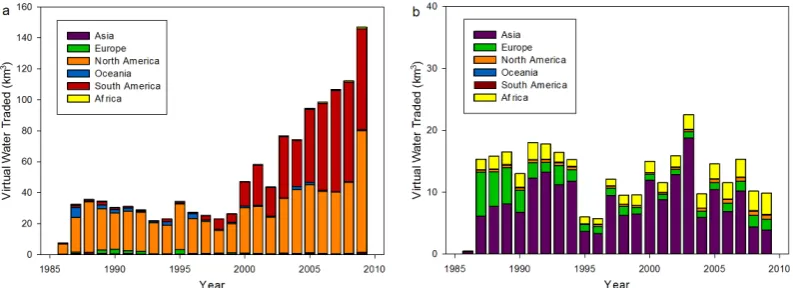
China mainly imported virtual water from North America be-fore 2000 but added South America as another major trade partner of virtual water import afterwards. In 1986, China imported 6.70 km3 virtual water from North America, and in 2009 this number increased to 78.7 km3but with another
[image:4.595.101.497.265.551.2]Fig. 3. The evolution of geographic distribution of China’s virtual water trade over the period of 1986–2009: (a) geographic distribution of virtual water import; (b) geographic distribution of virtual water export.
export among these three continents has become even larger since 2008 (see Fig. 3).
Figure 4 combines the numbers of VWTPs and geographic distribution of virtual water trade to give a holistic view of the evolution of China’s virtual water trade network over 1986– 2009.
3.3 Properties of virtual water trade network of China
Considering trade links and the total amount of virtual wa-ter traded, the number of VWTPs generally grew from 35 in 1986 to 160 in 2009, an increase of four times, which mainly came from the increase of the number of net VWEPs from 18 in 1986 to 125 in 2009, most of which are located in Asia, Europe and Africa. But the number of net VWIPs remained rather steady, growing from 17 in 1986 only to 35 in 2009, which are mainly located in North America, South Amer-ica and Oceania. In contrast to the relatively small number, net VWIPs contributed 81.15 % of the total net virtual water traded with a percentage of 28.14 % in number on yearly av-erage. Also, the pattern of a small number (less than 30 %) of net VWIPs contributing to a large percentage (greater than 70 %) of total net virtual water traded has been unchanged over the studied period.
Further network analysis confirms that the virtual water trade network of China is heterogeneous and highly polar-ized. A few “big partners” (defined as trade partners who traded larger than average volumes of virtual water) domi-nated China’s virtual water trade (see Fig. 5a and b). In terms of net virtual water import, the number of “big partners” was relatively small and rather steady. The yearly average num-ber of “big partners” is 3.1, with an absolute deviation (refer-ring to the absolute difference between an element in a data set and the mean value of that data set) of 0.45, constitut-ing 12.98 % of the total number of net VWIPs. But they ac-counted for 95.97 % of total net virtual water import. “Other partners” contributed mostly to the increase of the number of trade partners. The polarity is also prominent within net
virtual water export. In net virtual water export, “big part-ners” have a yearly average number of 11.7, with an absolute deviation of 3.6, constituting 18.97 % of the total number of VWEPs. They took up 83.55 % of the total net virtual water export.
Note that strength exceedance probability distribution of virtual water trade reconfirmed the highly polarized charac-teristics of China’s virtual water network. The probability distribution shows the feature of a “fat tail” in each net vir-tual water trade network, net virvir-tual water import network, and net virtual water export network, which highlights the fact that trade among a very small group of partners dominate the whole (see Fig. 5c). In fact, there are in total six countries which have traded more than 100 km3virtual water each with China over 1986 and 2009. Among them, the US and Brazil each exported more than 500 km3 to China, and Argentina and Canada each exported 100 to 400 km3; while Japan and South Korea each imported over 100 km3from China. There-fore any change in the trade with these “big partners” would impact on the whole trade pattern fundamentally. This is a disadvantage in terms of food security and resilience.
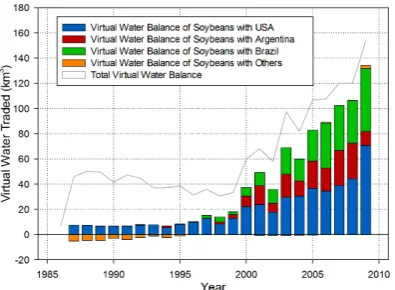
3.4 A case in focus: soybeans
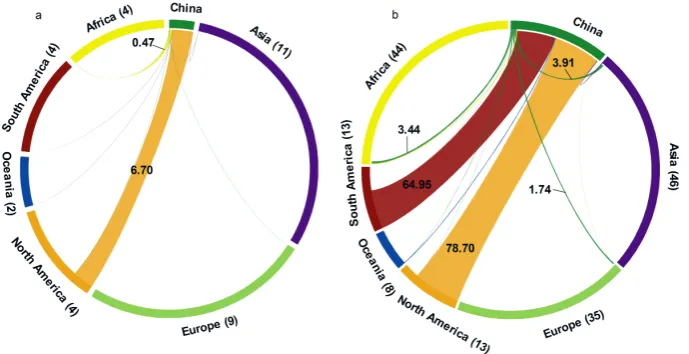
Fig. 4. Geographic distribution of China’s virtual water trade in 1986 and 2009. The size of the segment represents the number of VWTPs in corresponding continent with labels in the brackets (the size of China is not in proportion); the size of the contribution track represents the volumes of virtual water traded with label unit of km3. Note that contribution track with the same colour as its connected segment shows that the virtual water is exported from the corresponding continent represented by that segment. (a) for 1986 and (b) for 2009. Figures produced with Circos (Krzywinski et al., 2009).
suppliers. These three countries altogether exported 886 km3 of soybean-related virtual water to China over the period of 1986–2009 while all the other countries imported 29 km3 from China. The accumulated virtual water balance associ-ated with soybeans accounted for 56.97 % in the total virtual water balance of China between 1986 and 2009, and 78.26 % between 2000 and 2009.
4 Discussion
4.1 Comparison and analysis
China has significantly raised its net virtual water import from 7.02 km3 in 1986 to 137.14 km3 in 2009. The pat-terns of historic trend of virtual water trade are essentially the same, and values of traded virtual water are slightly smaller but comparable with Liu et al. (2007), which could be expected as more types of crops were used to calculate China’s virtual water trade in their study. This dramatic rise in China’s net virtual water import is mostly due to a major food trade policy shift in 2001 (Carter and Rozelle, 2001). China’s virtual water import is far larger than virtual wa-ter export, and grain crops overwhelmingly dominate virtual water import, accounting for 97 % on yearly average, which is also comparable with the result of over 95 % from Liu et al. (2007). Grain crops are also important contributors in vir-tual water export with a share of 53 %, although not as dom-inant as in virtual water import. Virtual water export of fruits and vegetables is minor, but cash crops are significant, with a share of 46 %, among which virtual water export of tea is the most important source. This finding, again, goes along with the study of Liu et al. (2007) on China’s virtual water
trade between 1961 and 2004. The comparison suggests that the recent trend of China’s virtual water trade has been kept since the policy turning point in 2001, and there is no indi-cation its direction observed after 2004 will shift in the near future.
Fig. 5. (a) Polarization of China’s net virtual water import net-work. The size of bubbles corresponds to the sum numbers of “big partners” and “other partners” in net virtual water import respec-tively; (b) polarization of China’s net virtual water export network. The size of bubbles corresponds to the sum numbers of “big part-ners” and “other partpart-ners” in net virtual water export respectively; (c) node strength exceedance probability distribution of virtual wa-ter trade network of China. We used the accumulated amount of traded virtual water of each trade partner between 1986 and 2009.
[image:7.595.69.267.60.510.2]factor affecting virtual water flow directions at a lower scale – for example at the regional or national levels especially when considering commodities beyond food (D’Odorico et al., 2012; Tamea et al., 2013). The most prominent feature of China’s virtual water trade network is the high heterogene-ity; that is, within both import and export a small group of
Fig. 6. Virtual water trade network associated with soybeans of China over the period of 1986–2009.
VWTPs control the entire trade. This is also coherent with the global virtual water trade network characteristics that a small number of global actors control a significant portion of virtual water export, which reflects Pareto principle in the context of virtual water trade network (Carr et al., 2012a, b, 2013).
Notably, soybeans, nearly all imported from the US, Brazil and Argentina (in fact, the soybean-associated virtual water balance of other countries is minor and negative), account for 91.7 % of China’s virtual water trade on yearly average. This is similar to 90 % calculated by Dalin et al. (2012a) and driven by growing economic growth and demand and changing preferences towards a more meat-based diet (Liu et al., 2008). Together with the lifting of food trade barri-ers, it explains the dramatic increase of China’s virtual wa-ter import. The large demand for soybeans in China has not only changed China’s virtual water trade network but also has influenced the structure of agriculture in the western hemi-sphere. Despite its negative impact on worsening the de-forestation in the Amazon Basin, this trend also has trade and water-resource-sustainability-related advantages, since the Americas have comparative advantages due to higher yields. In addition, crop water productivity of soybean is higher in the Americas than in China (Liu et al., 2009). Hence, scale issues aside, China’s soybean imports from the Americas help save water resources at the global level as more water would be consumed if China produced those soy-beans domestically. Strictly speaking, this is also consistent with the goals of the General Agreement on Tariffs and Trade (GATT) to “take full advantage of the world’s resources, and expand the production and circulation of goods”.
4.2 Policy implications
[image:7.595.331.529.63.208.2]in 2001. China is facing increasingly severe water scarcity (Jiang, 2009; Liu et al., 2013). On the demand side, the need for water resources in China will continue to grow, driven by population pressure, increasing affluence (e.g. increasing role of meat in the diet) and rapid growth of a resource-intensive economy. On the supply side, water resources in China are increasingly stressed. The uneven distribution of water resources between northern and southern China is pro-jected to worsen due to further climate change, and avail-able water resources will be further reduced by expanding water pollution (Piao et al., 2010; Mountford, 2011; Wang and Zhang, 2011). Therefore, China needs a more integrated water management strategy, including an active virtual water policy.
An active virtual water trade policy could be a wise ad-ditional option to complement integrated measures that fo-cus on addressing water supply and demand issues at the na-tional level. This is not without precedent, as policy mea-sures to mitigate the water scarcity through virtual water trade policy have been successfully implemented in other water-stressed countries, especially in the Middle East and North Africa (Allan, 1998; Shuval, 2007; El-Sadek, 2010). Whether China will take virtual water strategy as an active water policy, it can be expected that China will continue to increase the import of grain crops and their associated virtual water. This may further impose pressure on the supply chain of international staple crop market and continue to drive up the food price, as being seen in the case of soybeans. In turn, this would recall the long-standing concern about the food sovereignty and security of China. There is a widely held view that China needs to maintain a relatively high level of self-sufficiency of grain crops (about 95 %). While the accel-erating integration of China into the world economy, espe-cially China’s accession to the WTO, has resulted in a loosen-ing of policies on food trade, maintainloosen-ing a high rate of self-sufficiency in grains is becoming more and more unnecessary and unfeasible, neither economically nor environmentally.
Taking the high heterogeneity of virtual water import in China via the tight coupling of the supply chain with a small group of countries into account, in order to reduce the risk of volatile international food market and increase resilience, the sources of virtual water import should be further diversi-fied. In this study, we found China has already increased ma-jor VWTPs (i.e. shifting from North America alone to both North America and South America). This helps control the supply chain risk, and China should continue to strive for diversifying major trade partners. Furthermore, considering the fact that most of the virtual water resources available for export tend to remain concentrated in a small set of coun-tries (Carr et al., 2013), which can be also seen from our results that most of VWIPs are located in Americas with a limited number, and the projection that the future structure of global virtual water trade network will become increas-ingly heterogeneous (Dalin et al., 2012b), it is not sufficient to diversify VWIPs as an element of an improved virtual
water trade strategy. The structure of agriculture also needs to be adjusted. As discussed by Huang and Rozelle (2002), the structure of agricultural adjustment includes structural changes in the agricultural commodity mix, quality improve-ment of major commodities and the promotion of regional specialization.
Our results also indicate that cash crops may replace grain crops as the largest contributor in total virtual water export of China. Liu et al. (2007) pointed out that the goal of the struc-tural adjustment of agriculture is to achieve so-called “three-high” agriculture: high output, high quality, and high effi-ciency. They showed that most crops that turn water into high economic value are low on water intensity, and they are more suited to water-saving irrigation; thus, shifting to high water value crops can increase farmers’ incomes without increasing agricultural water consumption (Liu et al., 2007). Therefore, there also should be financial incentives to reduce export-ing highly water-intensive but low-economic-value agricul-tural products, and to increase exporting crops characterized by low water intensity but high economic value. It is cru-cial to strive for a more efficient agricultural use of water as an element of a virtual water trade strategy. Our results show that Asia, Africa, and Europe have been the main and fastest growing destinations of China’s exported virtual wa-ter. Those are also water-stressed regions in general, which implies greater potential markets for China’s virtual water export.
Acknowledgements. This study was based on the M.Sc. thesis for the Department of Environmental Sciences and Policy of Central European University, which was supervised by Junguo Liu and László Pintér. We also thank Alan Watt, Brandon Anthony, and Ruben Mnatsakanian for their support to this study. This study was supported by the International Science and Technology Cooperation Program of the Ministry of Science and Technology of China (2012DFA91530), the National Natural Science Foundation of China (91025009; 41161140353), the Special Fund for Forestry Scientific Research in the Public Interest (no. 201204204), the 1st Youth Excellent Talents Program of the Organization Depart-ment of the Central Committee of the CPC, and the FundaDepart-mental Research Funds for the Central Universities (TD-JC-2013-2).
Edited by: M. Sivapalan
References
Allan, J. A.: Watersheds and problemshed: Explaining the absence of armed conflicts over water in the Middle East, Mid. East Rev. Int. Affair., 2, 49–51, 1998.
Carr, J. A., D’Odorico, P., Laio, F., Ridolfi, L., and Seekell, D.: In-equalities in the networks of virtual water flow, EOS Trans. AGU, 93, 309, doi:10.1029/2012EO320001, 2012a.
Carr, J. A., D’Odorico, P., Laio, F., and Ridolfi, L.: Recent history and geography of virtual water trade, PLoS ONE, 8, e55825, doi:10.1371/journal.pone.0055825, 2013.
Carter, C. A. and Rozelle, S.: Will China’s agricultural trade reflect its comparative advantage? China’s Food and Agriculture: Issues for the 21st Century, edited by: Gale, F., ERS, USDA, AIB, 775, 27–30, 2001.
Chapagain, A. K., Hoekstra, A. Y., and Savenije, H. H. G.: Sav-ing water through global trade, Value of Water Research Report Series No. 17, UNESCO-IHE, Delft, the Netherlands, 2005. Chapagain, A. K., Hoekstra, A. Y., and Savenije, H. H. G.:
Wa-ter saving through inWa-ternational trade of agricultural products, Hydrol. Earth Syst. Sci., 10, 455–468, doi:10.5194/hess-10-455-2006, 2006.
Dalin, C., Konar, M., Hanasaki, N., Rinaldo, A., and Rodriguez-Iturbe, I.: Evolution of the global virtual water trade network, P. Natl. Acad. Sci., 109, 5989–5994, 2012a.
Dalin, C., Suweis, S., Konar, M., Hanasaki, N., and Rodriguez-Iturbe , I.: Modeling past and future structure of the global virtual water trade network, Geogr. Res. Lett., 39, L24402, doi:10.1029/2012GL053871, 2012b.
D’Odorico, P., Carr, J. A., Laio, F., and Ridolfi, L.: Spatial organiza-tion and drivers of the virtual water trade: a community-structure analysis, Environ. Res. Lett., 7, 034007, doi:10.1088/1748-9326/7/3/034007, 2012.
El-Sadek, A.: Virtual water trade as a solution for water scarcity in Egypt, Water Resour. Manage., 24, 2437–2448, 2010.
FAOSTAT: FAO Statistical Database, Food and Agricultural Orga-nization of the United Nations, Rome, Italy, available at: http: //faostat.fao.org/, last access: 8 February 2014.
Hoekstra, A. Y.: The relation between international trade and fresh-water scarcity, Working Paper presented in the WTO working paper series as commissioned background analysis for the World Trade Report 2010 on “Trade in Natural Resources: Challenges in Global Governance”, available at: http://www.wto.org/english/ rese/reser_e/ersd201005e.pdf (last access: 7 July 2012), 2010. Hoekstra, A. Y. and Hung, P. Q.: Globalization of water resources:
international virtual water flows in relation to crop trade, Global Environ. Change., 15, 45–56, 2005.
Huang, J. and Rozelle, S.: China’s accession to WTO and shifts in the agriculture policy, Working Paper 02-002, University of California, Davis, California, 2002.
Jiang, Y.: China’s water scarcity, J. Environ. Manage., 90, 3185– 3196, 2009.
Krzywinski, M., Schein, J., Birol, ˙I., Connors, J., Gascoyne, R., Horsman, D., Jones, S., and Marra, M.: Circos: an information aesthetic for comparative genomics, Genome Res., 19, 1639– 1645, 2009.
Liu, J. and Savenije, H. H. G.: Time to break the silence around virtual-water imports, Nature, 453, 587, 2008.
Liu, J., Zehnder, A. J. B., and Yang, H.: Historical trends in China’s virtual water trade, Water Int., 32, 78–90, 2007.
Liu, J., Yang, H., and Savenije, H. H. G.: China’s move to higher-meat diet hits water security, Nature, 454, 397, doi:10.1038/454397a, 2008.
Liu, J., Zehnder, A. J. B., and Yang, H.: Global consump-tive water use for crop production: the importance of green water and virtual water, Water Resour. Res., 45, W05428, doi:10.1029/2007WR006051, 2009.
Liu, J., Zang, C., Tian, S., Liu, J., Yang, H., Jia, S., You, L., Liu, B., and Zhang, M.: Water conservancy projects in China: achieve-ments, challenges and way forward, Global Environ. Change, 23, 633–643, doi:10.1016/j.gloenvcha.2013.02.002, 2013.
Mountford, H.: Water: the environmental outlook to 2050, presented in the OCED Global Forum on Environment: Making Water Re-form Happen, available at: https://community.oecd.org/servlet/ JiveServlet/previewBody/40641-102-1-76036/OECD (last ac-cess: 13 June 2013), 2011.
Novo, P., Garrido, A., and Varela-Ortega, C.: Are virtual water “flows” in Spanish grain trade consistent with relative water scarcity, Ecol. Econ., 68, 1454–1464, 2009.
Ozkaynak, B., Pinter, L., van Vuuren, D. P., Bizikova, L., Chris-tensen, V., Floerke, M., Kok, M., Lucas, P., Mangalagiu, D., Alkemade, R., Patterson, T., Shilling, J., Swanson, D., Bassi, A., Feldmann, F., Jager, J., Ochola, Qu, W., Ramakrishna, K., Ringler, C., Ertor, P., and Pervushina, N.: Scenarios and sustain-ability transformation, UNEP: Global Environment Outlook-5, Nairobi, Kenya, 419–456, 2012.
Piao, S., Ciais, P., Huang, Y., Shen, Z., Peng, S., Li, J., Zhou, Li., Liu, H., Ma, Y., Ding, Y., Friedlingstein, P., Liu, C., Tan, K., Yu, Y., Zhang, T., and Fang, J.: The impacts of climate change on water resources and agriculture in China, Nature, 467, 43–51, doi:10.1038/nature09364, 2010.
Renault, D.: Value of virtual water for food: Principles and features, in: Value of Water Research Report Series No. 12, edited by: Hoekstra, A. Y., UNESCO-IHE, Delft, the Netherlands, 2003. Shuval, H.: ’Virtual water’ in the water resource management of the
arid Middle East, Water Resour. Mid. East, 2, 133–139, 2007. Tamea, S., Allamano, P., Carr, J. A., Claps, P., Laio, F., and Ridolfi,
L.: Local and global perspectives on the virtual water trade, Hy-drol. Earth Syst. Sci., 17, 1205–1215, doi:10.5194/hess-17-1205-2013, 2013.
Wang, S. and Zhang, Z.: Effects of climate change on water re-sources in China, Clim. Res., 47, 77–82, doi:10.3354/cr00965, 2011.
Yang, H. and Zehnder, A.: China’s regional water scarcity and im-plications for grain supply and trade, Environ. Plan. A, 33, 79– 95, 2001.