http://www.scirp.org/journal/as ISSN Online: 2156-8561
ISSN Print: 2156-8553
Prioritization of Semi-Arid Agricultural
Watershed Using Morphometric and Principal
Component Analysis, Remote Sensing, and GIS
Techniques, the Zerqa River Watershed,
Northern Jordan
Yahya Farhan*, Ali Anbar, Nisrin Al-Shaikh, Rami Mousa
Department of Geography, University of Jordan, Amman, Jordan
Abstract
Remote sensing and GIS techniques were employed for prioritization of the Zerqa River watershed. Forty-three 4th order sub-watersheds were prioritized
based on morphometric and Principal Component Analysis (PCA), in order to examine the effectiveness of morphometric parameters in watershed priori-tization. A comparison has been carried out between the results achieved through applying the two methods of analysis (morphometric and PCA). Af-terwards, suitable measures are proposed for soil and water conservation. Topo sheets and ASTER DEM have been employed to demarcate the 43 sub- watersheds, to extract the drainage networks, and to compile the required thematic maps such as slope categories and elevation. LANDSAT 8 image (April-2015) is employed to generate land use/cover maps using ENVI (v 5.1) software. The soil map of the watershed has been digitized using Arc GIS software. Prioritization of the 43 sub-watersheds was performed using ten li-near and shape parameters, and three parameters which are highly correlated with components 1 and 2. Subsequently, different sub-watersheds were priori-tized by ascribing ranks based on the calculated compound parameters (Cp) using the two approaches. Comparison of the results revealed that prioritiza-tion of watersheds based on morphometric analysis is more consistent and serves for better decision making in conservation planning as compared with the PCA approach. The recommended soil conservation measures are pre-scribed in accordance with the specified priority, in order to avoid undesirable effects on land and environment. Sub-watersheds classified under high prior-ity class are subjected to high erosion risk, thus, creating an urgent need for applying soil and water conservation measures. It is expected that decision How to cite this paper: Farhan, Y., Anbar,
A., Al-Shaikh, N. and Mousa, R. (2017) Prioritization of Semi-Arid Agricultural Watershed Using Morphometric and Prin-cipal Component Analysis, Remote Sens-ing, and GIS Techniques, the Zerqa River Watershed, Northern Jordan. Agricultural Sciences, 8, 113-148.
http://dx.doi.org/10.4236/as.2017.81009
Received: November 11, 2016 Accepted: January 21, 2017 Published: January 24, 2017
Copyright © 2017 by authors and Scientific Research Publishing Inc. This work is licensed under the Creative Commons Attribution International License (CC BY 4.0).
http://creativecommons.org/licenses/by/4.0/
makers will pay sufficient attention to the present results/information, activate programs encouraging soil conservation, integrated watershed management, and will continue working on the afforestation of the government-owned sloping lands. Such a viable approach can be applied at different parts of the rainfed highland areas to minimize soil erosion loss, and to increase infiltra-tion and soil moisture in the soil profile, thus, reducing the impact of recur-rent droughts and the possibility of flooding hazards.
Keywords
Prioritization, Morphometric Analysis, Principal Component Analysis, Soil Conservation, Land Use/Cover, GIS
1. Introduction
Soil erosion by water is considered a major cause for land degradation in Jordan. Soil erosion is not a recent problem in the country. It was active prehistorically and historically in the rainfed highlands of the Levant region including Jordan. Geoarchaeological and geomorphological studies carried out on the acceleration and intensity of soil erosion in historical time, indicate that historical soil ero-sion, intense agriculture, and agricultural terraces, were predominant over the Levantine highlands since the Iron Age [1]. Data performed on the alluvial de-posits of the W.Wala (Central Jordan) suggest that the destruction of vegetation cover caused high soil erosion rates since the Neolithic and Chalcolithic periods. Indicators of soil erosion and the existence of agricultural terraces, denote that the highlands of Jordan experienced severe soil erosion at least since the Naba-tean period, 3000 years ago [2]. Such a conclusion was verified recently by Jebari et al. [3], where they stated that the Mejerda watershed of Tunisia has expe-rienced intense historical soil erosion over the last 3000 years. The catchment has been exposed to successive agricultural systems which caused intensive ex-ploitation of land resources, land use/land cover abuse, and soil degradation for a long period of time. Quantitative and qualitative studies have been imple-mented on soil erosion and conservation in Jordan since the 1960s. Mc Donald Partners and Hunting Technical Services LTD [4] estimated that top productive soil is eroded at a rate of 0.14 annually. Thus, in light of rapid population growth (2.8% per year), future sustainable agriculture is seriously threatened by intense soil erosion. The rainfed agricultural region of Jordan has experienced severe widespread erosion including splash, rill, gully and sheet erosion, and landslide activity. The Central Water Authority [5] and Schick [6] reported the occurrence of a heavy rainfall storm on 11 March 1966, which affected Ras En Naqb high-lands (Southern Jordan), where the average 4 hr rainfall yielded an intensity of 16 mm∙h−1. Similarly, in 1991/1992, the annual rainfall doubled in the country,
valleys, and the Ghor. Since the 1940s, Jordan was exposed to repetitive severe rainfall storms, with a maximum rainfall intensity range in 24 hr between 100 mm and 150 mm [7] [8] [9], whereas, the 48 hr maximum rainfall intensity ranges between 100 m and 180 mm. However, the maximum daily intensity (mm∙hr−1) varies between 2 and 6.6 mm∙hr−1[9]. Such high rainfall intensities
caused serious soil erosion loss and high sediment yield in wadis and rivers draining to the Jordan Rift. Harza [10] for example, estimated the total sediment inflow to King Talal Reservoir (KTR) at 1.7 Mm3∙yr−1, while Lara [11] reported
that the total sediment volume is at 3.84 Mm3∙yr−1. Earlier, Al-Sheriadeh and
Al-Hamdan [12] assessed the erosion risk over the Zerqa River watershed and proposed two types of conservation practices: terracing and plantation of trees. Erosion risk was classified as: (i) severe erosion risk by gullying and dominant in the western part of the watershed; (ii) high erosion risk by overland flow and rill erosion, affecting the north eastern part of the catchment; (iii) high gullying ero-sion risk in the middle, extending eastward; and (iv) low eroero-sion risk by gullying and overland flow dominant in the northern and southern-central part of the watershed. Moreover, using the AGNPS erosion model, Al-Sheriadeh et al. [13]
simulated the annual sediment yield at King Talal reservoir at 2.9 Mm3∙yr−1. Also,
Al-ansari and Knutsson [14] concluded that W. Alarab Dam (northern Jordan) will be filled with sediments within 38 years. The estimated soil erosion loss for W. Kufranja [15], and W. Kerak [16] catchments using the RUSLE model, indi-cate that continuous deterioration of top productive soil, and high soil erosion rates seriously endanger the future of constructed dams, and the proposed dams such as W. Kufranja Dam (northern Jordan), and W. Kerak Dam, southern Jor-dan [17][18]. Furthermore, the predicted average annual sediment yield (using the SWAT model) for W.Wala for the period 2000-2007, and 2008-2020 was 140.78 tons/year, and 123.1 tons/year respectively [19]. Similarly, the predicted average annual sediment yield for W. Mujib was 341.887 tons/years for the pe-riod 2007-2020 [20]. The results obtained using AGNPS erosion model are con-sidered a serious threat to W. Mujib and W. Wala reservoirs as a result of re-ducing the operational life of the reservoirs by decreasing their active storage.
In situ field measurements of soil erosion were carried out in different biocli-mate regions of the country (i.e., sub-humid Mediterranean (Salt, W. Kufranja and Jerash), semiarid (Muwaqar area), and arid (Azraq area), using different methods/techniques, i.e., splash, sheet, and runoff erosion [21][22]. Measuring instruments were installed on small plots of different environmental characteris-tics, i.e., farming practice, and the existence of conservation measures (i.e. tillage land, fallow land, terraced land, gradient, slope form, and aspect). The measured splash erosion at the Salt area (sub-humid Mediterranean) range from 3.24 to 21.42 ton∙ha−1∙yr−1[23], and 8 to 10 ton∙ha−1∙yr−1 at the W. Kufranja area [24]. A
maximum 12.7 ton∙ha−1∙yr−1, and a minimum 2.9 ton∙ha−1∙yr−1 were recorded for
the Jerash area [25]. The measured splash erosion for the Muwaqar area (semi arid) varies from 2.59 to 16.3 ton∙ha−1∙yr−1[26], and for the arid area, Al-Ham-
measured runoff erosion ranges from 0.581 to 2.382 ton∙ha−1∙yr−1 for the Salt area,
1.05 ton∙ha−1∙yr−1 for the Muwaqar area, and 0.14 ton∙ha−1∙yr−1 for Azraq arid
area [23][26][27].
Field measurement of soil erosion using pegs and field splash cups was also conducted in the Shawbak-Wadi Musa (Petra area) in southern Jordan. Soil ero-sion rates based on pegs range from 0.873 and 1.24 mm∙yr−1, while the measured
splash erosion for the same plots varies from 1.39 to 30.15 to ha−1∙yr−1 [28].
During the 1960s, several qualitative investigations were conducted on soil ero-sion and conservation for W. Ziqlab, north Jordan [29], the southern highlands
[30], W. Hasa, south Jordan [31], and soil conservation surveys were carried out for W. Shueib and W. Kufrein, central Jordan [32]. The final products of these surveys were restricted to mapping soil erosion features using air photos and fieldwork, slope categories (%), and physical and chemical properties of soils in-cluding soil types distribution. A conventional land capability map for W. Ziqlab was compiled, and a map illustrating the location of proposed soil conservation structures was also supplemented. Continuous human interventions, including the expansion of agriculture on steep slopes and beyond the limit of rainfed agriculture, continuous over-grazing, woodland cutting, rapid urbanization, pro- gressive land fragmentation, and agricultural intensification are the main con-tributing factors underlying soil degradation in the rainfed agricultural lands of Jordan.
In light of the predominant high soil erosion loss and sediment yield rates, specific sub-watersheds show potential areas for preferential conservation inter-vention, and must be prioritized immediately for soil and water conservation practices, so as to maintain future agricultural sustainability [33]. Quantitative analysis of drainage basin morphometry was employed recently as an efficient tool to prioritize sub-watersheds for soil and water conservation measures
[34]-[45]. Erosion risk parameters represented by linear and shape morphome-tric variables must be calculated to prioritize watersheds for soil conservation. It has been postulated earlier that linear parameters retain a direct relationship with erodibility. Thus, the highest value of the linear variables was ranked 1, the second highest value ranked 2 and so on. By contrast, the shape parameters have an inverse relation with linear parameters, consequently, the lower their values, the greater the erodibility [37] [38][46][47]. Subsequently, the lowest value of shape variable was rated as rank 1 and the second lowest as rank 2 and so on. Compound parameter (Cp) was calculated by adding up all the ranks of linear
variable, as well as shape variable, and then, dividing by the number of all para-meters. Following the rating of every single morphometric parameter, the rank-ing values for all linear and shape parameters pertainrank-ing to each sub-watershed are added up for each of the sub-watershed to attain compound parameter (Cp)
sub-watershed, thus, it is considered a potential area for applying soil conserva-tion measures [48]. However, Patel et al. [38] stated that the prioritization con-cept is found to be very helpful for understanding the fluvial and morphological characteristics of individual watersheds or sub-watersheds, and for designing ef-ficient soil conservation and water harvesting structures to control soil erosion, and conserve water over a watershed.
Recent investigations carried out on watershed prioritization, employ various methods of analysis, such as morphometric analysis combined with the sediment yield index (SYI) model, and sediment product rate (SPR) [49]. Others adopted the analysis of linear and shape morphometric parameters for prioritization [50]. In some other studies, morphometric analysis, land use/ land cover parameters, sediment yield index [42], and Snyder’s synthetic unit hydrograph method have been incorporated in analysis [51]. In several other investigations, morphome-tric aspects associated with predicted annual soil loss parameter, based on the USLE or RUSLE models, or soil erosion susceptibility analysis were employed for identifying potential sub-watersheds for conservation works planning [52]. Others utilized morphometric indices and the Fuzzy Analytical Hierarchy, in-cluding the Saaty Analytical Hierarchy Process [53] for prioritizing watersheds for appropriate control measures. The present study focused on:
1. Prioritization of 43 sub-watersheds for soil conservation based on mor-phometric analysis using GIS and RS, and Principal Component Analysis (PCA),
2. Evaluate the final priority ranks for the 43 sub-watersheds based on mor-phometric analysis and PCA,
3. Compiling spatial maps illustrating the final priority ranks for the 43 sub- watersheds, and
4. Propose suitable soil and water conservation measures for the Zerqa River watershed in northern Jordan.
Information pertaining to present land use/cover, slope, and soil type is em-ployed to help in suggesting suitable soil conservation measures for different sub-watersheds of the Zerqa River. Further, the locations of proposed soil con-servation structures were generally clarified. The results achieved are very im-portant to conserve soil and water, and to provide significant information which can assist decision-makers in formulating more reliable soil and water conserva-tion plans for the Zerqa River watershed in the future. GIS techniques have proven to be powerful tools for watershed prioritization, sustainable develop-ment and managedevelop-ment of land resources. Morphometric analysis in this context is a key to understanding the hydro-morphological processes and characteristics of drainage networks. Linear and shape parameters can be measured and com-puted using DEM’S, Arc GIS software and the mathematical formulas developed for this purpose [54][55][56][57][58].
be taken for remedial measures through conservation operations [48]. Elabora-tions have been undertaken regarding the selection of rational morphometric parameters in relation to erodibility to prioritize sub-watersheds [46][55] [56] [57][58]. Five linear morphometric parameters (bifurcation ratio, drainage den-sity (km/km2), texture ratio, length of overland flow (km), and stream
frequen-cy), and five morphometric shape parameters (compactness coefficient, circular-ity ratio, elongation ratio, shape factor, and form factor) are often utilized and employed for watershed prioritization. The chosen parameters are reported to be the most consistent variables in prioritizing sub-watersheds for conservation practice.
2. The Study Area
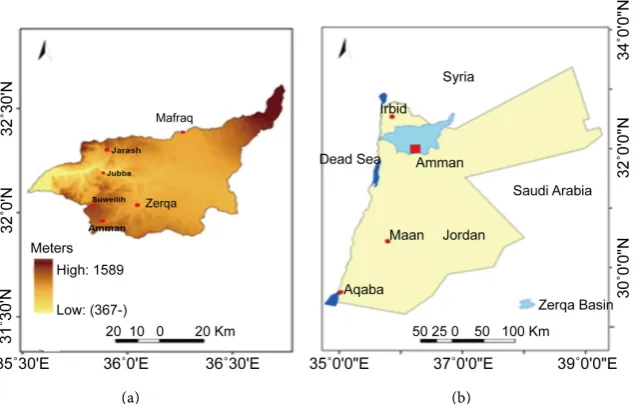
Prioritization of the Zerqa River sub-watersheds in northern Jordan was con-ducted. The catchment covers an area of 4160 km2, and lies between the latitudes
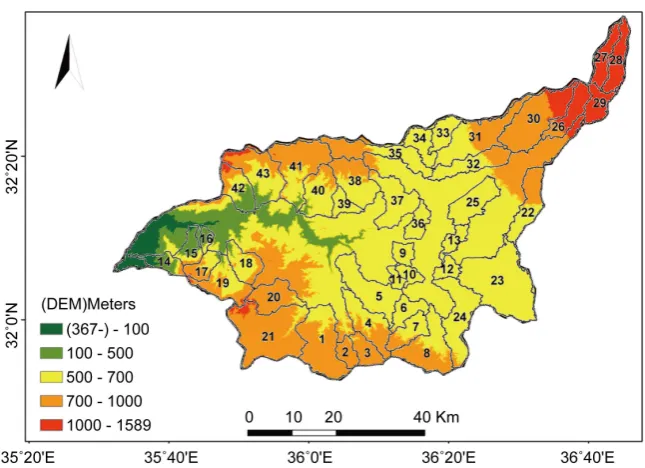
35˚32'E and 36˚45'E and 31˚51'N and 32˚35'N. The watershed extends from the western highlands and the Ghor to the eastern desert, beyond the Jordanian- Syrian border, and terminates at the piedmont of Jebel el Druz northeast (Figure 1). The catchment is drained by two major tributaries: W. Zerqa and W. Dhulil which drain the western and eastern parts of the watershed respectively. Both tributaries are joined at Sukhna town to form what is known as the “Zerqa Riv-er”. The elevation of the catchment ranges from −367 m (b.s.l) to 1589 m (a.s.l) (Figure 2).
Climato-morphogenetic processes are often controlled slope elements and slope segments [59][60]. Slope units sequence at the Zerqa River is occasionally interrupted by landslide complexes and structural benches due to progressive rejuvenation in the western part, and successive basaltic flows in the eastern part of the catchment. A prominent slope variation exists across the watershed (0˚ to 20˚ - 45˚), but higher slope categories (10˚ - 15˚, 15˚ - 20˚, and 20˚ - 45˚) domi-
[image:6.595.218.536.513.715.2]Figure 2. Digital Elevation Model and the 43 sub-watersheds of the Zerqa River.
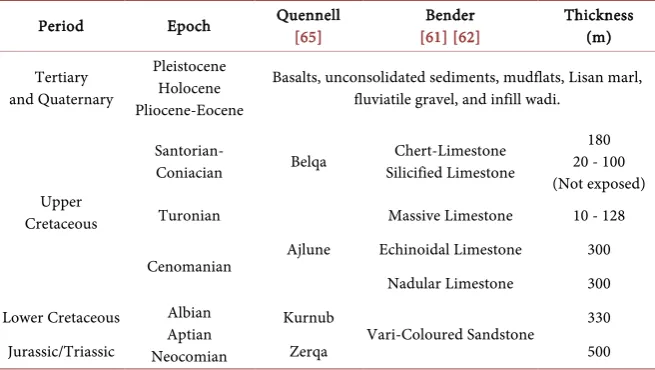
nate the rejuvenated belt, whereas, slope categories of 0˚ - 5˚, 5˚ - 10˚, and 10˚ - 20˚ characterize the eastern part of the catchment (Figure 3). The aspect of ter-rain units has a great impact on exposure to sun, precipitation patterns, wind, and thus evaporation rate and vegetation type and density. Terrain units facing north, northeast, southwest are predominant in the western part of the wa-tershed. Therefore, a higher moisture content and lower evaporation rate domi-nate. Rainfed farming is practiced here, while irrigated agriculture is employed in the lower Zerqa River floodplain and at the upper arid part of the watershed. A sequence of rocks was exposed across the watershed, ranging in age from Tri-assic to resent sediments. The northeastern part of the watershed is covered by basalt rocks ranging in age from Oligocene to Pleistocene. Table 1 displays the lithological units and structure in the study area. The Zerqa Group (sandstones, dolomites and shales) is considered the older rock unit exposed in the catchment (Triassic/Jurassic). This rock unit is overlain by Kurnub sandstone of the Lower Cretaceous age. The sandstones are overlain by the Cenomanian–Turonian Group of Upper Cretaceous age, which consists of two lithological units: the Nodular limestone unit, or the Marl-Clay unit, and the Echinoidal limestone unit (the Limestone-Marl unit).
Figure 3. Slope categories of the study area.
Table 1. Lithological units exposed in the Zerqa River Watershed (Based on: 63-64).
Period Epoch Quennell [65] [61] [62] Bender Thickness (m)
Tertiary and Quaternary
Pleistocene Holocene Pliocene-Eocene
Basalts, unconsolidated sediments, mudflats, Lisan marl, fluviatile gravel, and infill wadi.
Upper Cretaceous
Santorian-
Coniacian Belqa
Chert-Limestone Silicified Limestone
180 20 - 100 (Not exposed) Turonian
Ajlune
Massive Limestone 10 - 128
Cenomanian Echinoidal Limestone 300
Nadular Limestone 300 Lower Cretaceous Albian
Aptian Neocomian
Kurnub
Vari-Coloured Sandstone 330
Jurassic/Triassic Zerqa 500
repetitive heavy rainstorms as controlling factors in their initiation and distribu-tion. The old landslide complex close to the Zerqa River bridge, and the Bassa landslide west of King Talal Reservoir are the best examples. The lower slopes of landslide complexes are often active landslide zones due to river incision, lateral erosion, recent tectonic activity [69] and peak flooding. The old landslide com-plexes are tentatively from the Pliocene and Quaternary age [70].
The climate in the Suweileh and Jubba areas is sub-humid Mediterranean, then it shifts to semi-arid in the Baq’a depression and Jerash, whereas, arid con-ditions dominate the eastern part of the watershed. Generally, the climate is characterized by long, hot and dry summers, and relatively short and wet winters
[71]. The average annual rainfall varies from 541 mm at Suweileh (1050 m a.s.l) to 365 mm at Jerash (550 m a.s.l), whereas, the annual rainfall recorded at Zerqa is 132 mm (510 m a.s.l), and 155 mm at Mafraq (695 m a.s.l) at the northern border of the watershed. Much rainfall particularly in January, February and March, is associated with heavy rainfall storms of high intensity; these may in-duce landslides and soil erosion loss. A heavy rainstorm that occurred on March 4th, 1983 initiated dozens of shallow landslides in the Suweileh-Jerash area. The
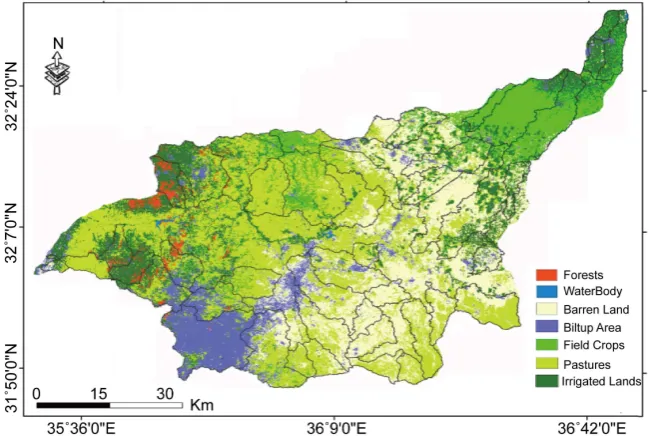
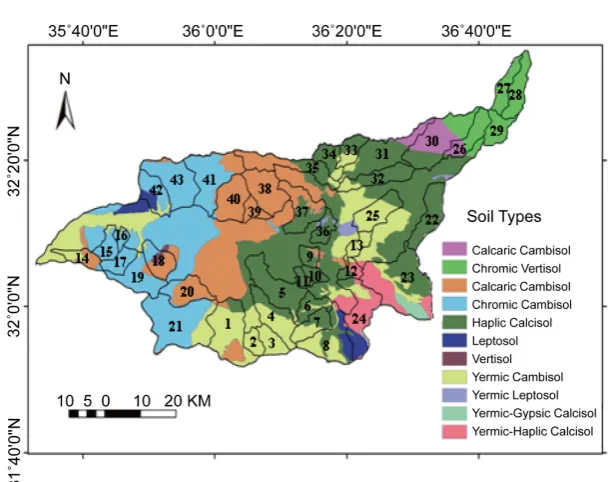
[image:9.595.210.536.496.714.2]average annual discharge of the watershed is 70.3 MCM at King Talal Reservoir. The slopes often have a poor vegetation cover, and lack conservation measures. Woods on bare slopes have been deforested in the past, and are severely over-grazed at present. Rainfed farming (i.e. cereals, fruit trees, and olive trees) do-minates the western highlands of the catchment (Figure 4), of Vertisol and Lithic subgroups soil (Figure 5), but with poor conservation measures. Irrigated agriculture is practiced along the lower Zerqa River floodplain based on the King Talal Reservoir, the bottom and the alluvial fan of W. Jerash through utilizing available water from the base flow of springs between Jerash town and the Zerqa River bridge. Further, irrigated agriculture is practiced in the northern and east-
Figure 5. Soil types and the 43 sub-watersheds.
ern arid areas around Mafraq and Hallabat, where dozens of wells are installed, and groundwater is heavily exploited for this purpose. Pinus halepensis was planted in mid-1950s and 1960s to provide protective measures against soil ero-sion and landslide activity [72] around the Zerqa river bridge, Jerash area.
3. Materials and Methodology
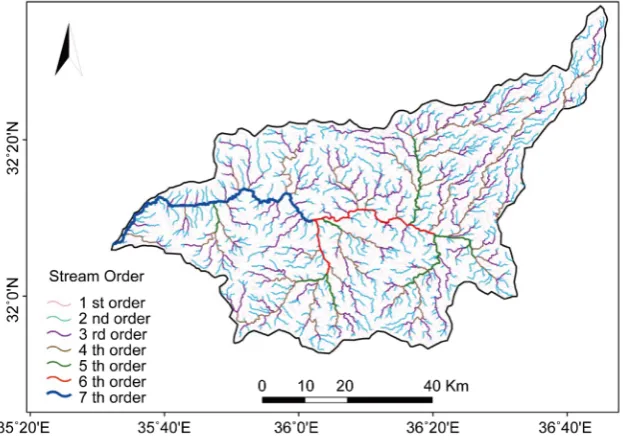
Morphometric analysis for prioritization of the Zerqa River sub-watersheds was performed using topographic maps of scale 1:50,000 (20 m contour interval) ob-tained from the Royal Jordanian National Geographic Centre (RJNGC), Amman. Then, they were scanned, geo-referenced, and converted to zone 36 N projection system using Arc GIS 10.1 and the accompanying packages. The Zerqa River catchment and the 43 sub-watersheds were demarcated initially using topo-graphic sheets. ASTER DEM (30 m spatial resolution) was employed to extract drainage networks of the Zerqa River watershed and the 43 fourth-order sub- watersheds using the Arc Hydro tool. Stream order was assigned using the stream ordering system elaborated by [54][55][56][57] [58]. The Zerqa River watershed was found to be of 7th order. Five basic morphometric parameters
such as: area (A), basin length (Lb), perimeter (P), stream order (u), and stream
length (L), were measured directly from the DEM using GIS software (Table 2). The five linear parameters which are considered in prioritization of watersheds based on morphometric analysis are: bifurcation ratio (Rb), drainage density
(Dd), stream frequency (Fs), texture ration (Tr), and length of overland flow (Lo).
Further, the shape parameter utilized in this research are: form factor (Rf), shape
factor (Bs), elongation ratio (Re), compactness coefficient (Cc), and Circularity
(Rc). The linear and shape parameters are considered to be the two dimensional
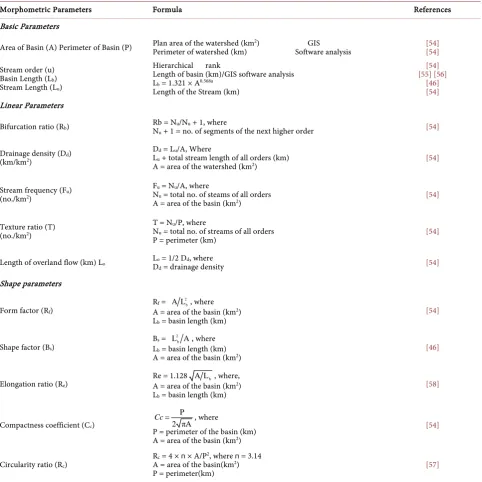
Table 2. Computation of basic, linear and shape morphometric parameters.
Morphometric Parameters Formula References
Basic Parameters
Area of Basin (A) Perimeter of Basin (P) Plan area of the watershed (kmPerimeter of watershed (km) Software analysis 2) GIS [54] [54]
Stream order (u) Basin Length (Lb) Stream Length (Lu)
Hierarchical rank
Length of basin (km)/GIS software analysis Lb = 1.321 × A0.568a
Length of the Stream (km)
[54] [55] [56]
[46] [54]
Linear Parameters
Bifurcation ratio (Rb) Rb = NN u/Nu + 1, where
u + 1 = no. of segments of the next higher order [54]
Drainage density (Dd) (km/km2)
Dd = Lu/A, Where
Lu + total stream length of all orders (km)
A = area of the watershed (km2) [54]
Stream frequency (Fu) (no./km2)
Fu = Nu/A, where
Nu = total no. of steams of all orders
A = area of the basin (km2) [54]
Texture ratio (T) (no./km2)
T = Nu/P, where
Nu = total no. of streams of all orders
P = perimeter (km) [54]
Length of overland flow (km) Lo LDo = 1/2 Dd, where
d = drainage density [54]
Shape parameters
Form factor (Rf)
Rf = 2 b A L , where A = area of the basin (km2) Lb = basin length (km)
[54]
Shape factor (Bs)
Bs = L A2b , where Lb = basin length (km)
A = area of the basin (km2) [46]
Elongation ratio (Re)
Re = 1.128 A Lb, where, A = area of the basin (km2) Lb = basin length (km)
[58]
Compactness coefficient (Cc)
P
2 πA
Cc= , where
P = perimeter of the basin (km) A = area of the basin (km2)
[54]
Circularity ratio (Rc)
Rc = 4 × ᴨ × A/P2, where ᴨ = 3.14 A = area of the basin(km2)
P = perimeter(km) [57]
using ASTER DEM as shown in Figure 3. The slope in the catchment varies from 0˚ to >25˚ catgories. The map which illustrates the 43 sub-watersheds was superimposed on the DEM, slope categories, land use, and soil maps. Principal Component analysis (PCA) was employed to explore the most influential mor-phometric parameters for prioritization of watersheds based on the parameters which are highly correlated with important components. A comparison of the results of prioritization obtained based on applying the two methods of analysis was performed.
4. Results and Discussion
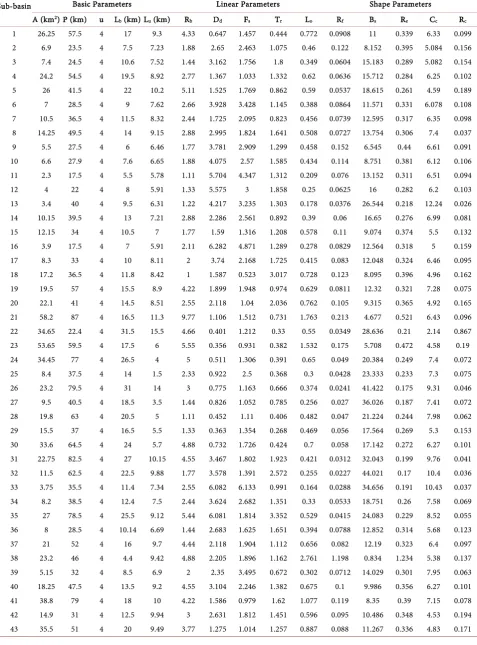
4.1. Morphometric AnalysisGeomorphometric analysis was conducted for the entire Zerqa River watershed and the 43 sub-watersheds to assess the characteristics and properties of the drainage networks. Fifteen morphometric parameters which represent basic, li-near and shape parameters were utilized to prioritize sub-watersheds for soil conservation. Table 3 displays the computed morphometric parameters. The total drainage area of the watershed is 4895.11 km2, and the drainage pattern is
dendritic to sub-dendritic in the upper catchment, and trellis type in the south-ern and westsouth-ern type. The watershed is classified as a seventh basin–order (Figure 6) with a length of 143.8 km, and perimeter of 464.7 km. The total number of streams (Nu) is 5806, and the first order streams account for 79.6% of the total number of streams in the catchment. Generally, the higher the order is, the longer the length of stream in nature. The total stream length (Lu) of the
catchment is 7148.25 km, and the first order streams represent 48.5% of the total stream length. A variation exists in stream length ratio (RL) between the streams
[image:12.595.218.530.498.718.2]for different orders of the Zerqa River catchment (0.376 - 3.4), and the 43 sub- watersheds. Such variation might be attributed to geomorphic changes in slope
Table 3. Morphometric characteristics of the 43 sub-watersheds. Shape Parameters Linear Parameters Basic Parameters Sub-basin Rc Cc Re Bs Rf Lo Tr Fs Dd Rb Lu (km) Lb (km) u
P (km) A (km2)
and relief of the catchment, the influence of compressional structures, the stage of geomorphic development, and rejuvenation processes affecting the watershed. The values of bifurcation ratio for the Zerqa River catchment and the 43 sub- watersheds are indicative of structural distortion affecting the drainage system (Rb varied from 2.7 to 5, with an average of 4.9). Relative relief and slope
steep-ness are the main morphological factors controlling drainage density (Dd). Low
drainage density occurred where the catchment relief is high [56]. Nevertheless, other factors determining Dd are: the resistance of surface materials against
ero-sion, and the infiltration-capacity of the soil. The Dd value of the entire
catch-ment is 1.46, which denotes a moderate to well-drained catchcatch-ment. The presence of dissected and steep slopes with relatively impervious underlying rocks, i.e., the marly-clay unit, and the limestone-marly unit, exposed at the middle reaches, resulted in a series of springs out flowing to the major courses of the Zerqa River. The watershed exhibits a fine drainage texture (Dt), which approaches 15.4. High
Dt values indicate the presence of fragile slope materials and soft rocks where
high sediment yield has been recorded [13]. The Fs value for the Zerqa River
catchment is 1.186, and for the 43 sub-watersheds ranges from 0.979 to 6.133. Low Fs values denote that a relatively low infiltration rate of surface water is
as-sumed; consequently, the groundwater potential is relatively low. Values of elongation ratio (Re) vary between 0.6 to 1.0 over a wide range of geological and
climatic conditions [56]. The elongation ratio (Re) for the Zerqa River watershed
is 0.248, and the values for the 43 sub-watersheds range from 0.17 to 0.234. Such values are indicative of elongated shape, and are combined with steep valley–side slopes and high relief. The Rc value for the Zerqa River catchment is 0.284,
whe-reas [57] argued that watersheds with a range of circularity ratios (Rc) of 0.4 to
0.5 are considered as strongly elongated and at the youth stage of geomorphic evolution. The form factor (Rf) value for the Zerqa River is 0.236. Low Rf values
indicate that low peak flows of long duration are expected for the catchment [73]. High basin relief (Bh) of the Zerqa River watershed (1949 m) denotes high
po-tential erosion energy of the drainage system. Due to continuous changes of base level of the Dead Sea and Jordan River, and tectonic activity, the Zerqa River en-tailed progressive down-cutting and incision through its geomorphic history, giving, rise to the present dissected and rough terrain. High rates of annual soil erosion loss and sediment yield, and landslide activity are predominant in present–day geomorphic processes. The hypsometric integral (HI) for the Zerqa River catchment is found to be 0.834 [74], which is indicative of recurrent phases of rejuvenation and youth-age stage of geomorphic development. The basic morphometric parameters calculated for the 43 sub-watersheds (Table 3) are: area (A), perimeter (P), stream order (u), basin length (Lb) and total stream
length (Lu).
4.1.1. Basic Morphometric Parameters
1) Sub-Watershed Area (A) and Perimeter (P)
drai-nage area. It reflects the volume of water that can be generated from precipita-tion. The present investigation reveals that sub-watershed no. 13 has a minimum area of 3.4 km2. The watershed perimeter represents the length of a line that
de-lineates the water divide of the sub-watersheds. P parameter can be employed as an indicator of watershed size and shape. The maximum and minimum values are 82.5 km2 for sub-watershed no. 31 and 17.5 km2 for sub-watersheds no. 11,
and no. 16.
2) Stream Order (u)
Although Gravelius [75], Horton [54], Strahler [55][56] and Scheidegger [76]
have elaborated different methods of ordering streams, Strahler’s method of stream ordering is employed due to its simplicity, and because it is the most commonly used system in hydrological studies [77][78].
3) Basin Length (Lb)
The basin length (Lb) parameter is defined as the ratio of the largest
dimen-sion of a watershed, to its main channel. Lb parameter is measured along the
main channel from the watershed outlet to the basin divide. Patel et al. [36] ar-gued that the Lb parameter is fundamental in hydrological computation and
in-creases as the drainage inin-creases and vice versa. Basin length (Lb) is considered a
watershed input parameter to compute the major shape parameters. The basin length for the 43 sub-watersheds ranges from 6 km to 31.5 km.
4) Total Length of Streams (Lu)
The number of streams pertaining to different orders for each sub-watershed was computed, and their lengths are measured (Table 3). The first-order stream has no tributary and its flow depends totally on the surface overland flow related to it. Further, the second-order stream is formed by the junction of two first- order streams and as such has a higher flow, and the third-order streams receive flow from the two second-order streams [37]. All sub-watersheds in the present study are of fourth-order, but the total stream length of all orders varies re-markably. Among the 43 sub-watersheds, sub-watershed no. 22 ha the greatest total length of streams (15.5 km), while, sub-watershed no. 25 has the lowest to-tal length of streams (1.5 km). It is notable, that the greatest toto-tal length of streams is restricted to sub-watersheds deformed by major compressional struc-tures dominating the western part of the Zerqa River Watershed.
4.1.2. Linear Parameters
The linear parameters which are considered in the prioritization process of sub- watersheds are: bifurcation ratio (Rb), drainage density (Dd), stream frequency
(Fs), texture ration (Tr), and length of overland flow (Lo).
1) Bifurcation Ratio (Rb)
Horton [54] defined the bifurcation ratio (Rb) as the ratio of the streams
number of a given order to the number of the streams of the next higher order. It is predetermine as an index of relief and dissection. Rb values of drainage
Conversely, low values of bifurcation ratio dominate catchments without any distortion of drainage systems [55] [56]. However, it is stated that negligible variation in Rb values exists among regions of different geologic and geomorphic
setting, except where geological and structural control predominate. Hydrologi-cal characteristics of watersheds can be correlated with Rb values. High Rb values
denote high overland flow and early hydrograph peak with a high potential of susceptibility to flash flooding during intense rainfall storms [79]. This in turn increases soil erosion rates and sediment discharge into the main channels. Notable variation is observed in Rb values at the Zerqa River watershed (Table 3).
Sub-watershed no. 18, for example, has a minimum Rb of 1, whereas, sub-
watersheds nos. 21, 5, 23 and 35 have maximum Rb ratios of 9.77, 5.11 and 5.44
respectively. The Rbm value for the entire Zerqa River watershed is 4.897. It is
clear that Rb values are relatively high, for sub-watersheds occupying the western
part of the catchment. 2) Drainage Density (Dd)
Drainage density emphasizes the closeness of spacing of channels. It is com-puted as the total length of streams in a catchment per unit area, therefore, it is a measure of terrain dissection and runoff potential of the watershed. A high value of Dd indicates a relatively high density of streams, high runoff, a quick stream
response, and consequently, a low infiltration rate. By contrast, low drainage density of a watershed implies low runoff and high infiltration [80]. Relative re-lief and slope steepness are major factors controlling drainage density. Thus, low drainage density occurs where basin relief (Bh) is high as in the case of the Zerqa
River catchment (Bh is 1949 m). Other fundamental factors controlling Dd are
infiltration-capacity of the soil, and initial resistance of land against erosion. Poorly drained catchments often have a Dd value of 2.74, while a well-drained
one has a lower value of 0.73, or one fourth as large [54]. Regardless of the de-graded vegetation cover, low Dd values denote the presence of highly dissected
steep topography, and impervious underlying bed rock. The Dd value for the
Zerqa River catchment is 1.477, while Dd values for the 43 sub-watersheds range
from 0.356 (sub-watershed no. 23) to 6.282 (sub-watershed no. 16) (Table 3). According to Deju [81] classification of Dd, 6 sub-watersheds are categorized as
watersheds with poordrainage density (0.5), and 11 as sub-watersheds of me-dium drainage density (0.5 - 1.5). Whereas, 26 sub-watersheds are of excellent drainage density (>1.5).
3) Stream Frequency (Fs)
Stream frequency (Fs) indicates the ratio of the total number of streams (Nu)
in a watershed to the watershed area (A). It is identified as the number of streams per unit area [54]. Generally, values of Fs vary from 3.91 to 9.99,
de-pending mainly on the underlying bedrock of the drainage basin. Thus, reflect-ing the texture of the drainage network. Fs values are positively correlated with
Dd values of the catchment. This means that any increase in stream population is
with the size of the drainage area. High stream frequency indicates more perco-lation in slope materials and bedrock, and thus more groundwater potential is expected. The values of stream frequency (Fs) for the 43 sub-watershed range
from 0.979 (sub-watershed no. 41) to 6.133 (sub-watershed 33) (Table 3), and the Fs for the Zerqa River catchment is 1.86 [74].
4) Texture Ratio (Tr)
Tr is calculated as the ratio of the total number of streams of the first order (N1)
to the perimeter of the watershed. Tr parameter is considered to be one of the
most significant factors in drainage basin morphometry. Texture ratio depends on the underlying lithology and surface materials, infiltration capacity, and the relief aspect of the terrain [82]. The value of Texture ratio for the Zerqa River watershed is 1.463, and for the sub-watersheds ranges from 0.268 (sub-water- shed no. 29) to 3.352 (sub-watershed no. 35). Such values indicate that the wa-tershed is of relatively high runoff.
5) Length of Overland Flow (Lo)
Lo refers to the length of water over the ground before it becomes
concen-trated into definite stream channels, and is equal to half of the drainage density
[54]. The length of overland flow relates inversely to the important independent parameters affecting both hydrologic and hydrographic development of drainage basins [54] [82]. The length of overland flow for the Zerqa River watershed is 0.730 km, and for the sub-watersheds ranges from 0.164 km (sub-watershed no. 33) and 2.761 km (sub-watershed no. 38).
4.1.3. Shape Parameters
Shape parameters include shape factor (Bs), form factor (Rf), elongation ratio
(Re), compactness coefficient (ratio) (Cc), and circularity ratio (Rc).
1) Shape Factor (Bs)
Shape factor refers to the ratio of the square of the basin length to the area of the basing ( 2
b
L /A). This parameter is in increase proportion to the form factor
[46][54]. Shape factor provides a conception regarding the circular character of the watershed. The greater the circular character of the catchment, the greater is the fast response of the catchment following an intense heavy rainstorm [83]. The shape factor for the entire Zerqa River watershed is 4.52, whereas, the 43 sub-watersheds exhibit a range of 0.834 to 9.986, which indicates that elongated shapes dominate the sub-watersheds.
2) Form Factor (Rf)
Rf indicates the ratio of the area of the watershed to the square of the basin
length [55] [56]. Thus, higher values of form factor indicate a more circular shape of the watershed, and, the smaller the value of Rf (<0.45), the more the
watershed will be elongated. The catchments with high Rf values are
characte-rized by high peak flow of shorter duration, while elongated sub-watersheds with low form factor, indicate a low peak flow of longer duration. The Rf value for the
flows for longer duration and as such less probability for severe flooding (Table 3).
3) Elongation Ratio (Re)
Re refers to the ratio between the diameter of the circle of the same area as
presented by the drainage basin to the maximum basin length [58]. It has been stated that Re values generally vary between 0.6 and 1.0 over a wide range of
geological and climatic conditions [56]. Re values close to 1.0 are characteristic of
regions with low relief, whereas values in the range of 0.6 - 0.8 represent water-sheds with high relief and steep slopes. The low values of Re indicate that a
par-ticular sub-watershed is more elongated than others. Where the Re value
ap-proaches 1.0, the shape of the watershed becomes a circle shape [58]. The elon-gated shape of a watershed indicates a younger stage of evolution, caused by in-tense neotectonic activity, while the intermediate shape with a tendency to cir-cularity suggests an early mature stage [84], and is more efficient in discharge runoff than elongated watersheds. Based on Re values, watersheds were
catego-rized into five groups, i.e. circular (0.9 - 1.0), oval (0.8 - 0.9), less elongated (0.7 - 0.8), elongated (0.5 - 0.7), and more elongated (<0.5). The elongated ration of the Zerqa River catchment is 0.530, whereas values of Re for the 43 sub–
water-sheds range from 0.170 to 0.521, thus, most of the sub-waterwater-sheds are more elongated, and a few of them are elongated.
4) Compactness Coefficient (Cc)
Compactness coefficient (Cc) is elaborated by Gravelius [75], thus is also
known as the Gravelius index (GI). It defined as the ratio of perimeter of
tershed to circumference of circle area, which is equal to the area of the wa-tershed. When Cc value is 1, it means that the catchment is a perfect circle. If the
Cc value is 1.28, the basin is more square-shaped, while the basin is considered a
very elongated one, when the Cc value >3.0 [85]. The Cc parameter is
indepen-dent of size of the watershed and depenindepen-dent only on slope [54]. A circular basin yields the shorter time of concentration before the peak flow realized in the wa-tershed, and Cc > 1.0 indicates more deviation from the circular nature [82].
Lower values of Cc imply more elongation and high erosion. The Cc value for the
Zerqa River watershed is 1.87, whereas the Cc values for most of the 43 sub-
watersheds are greater than 3, which reflects high erosion. 5) Circularity Ratio (Rc)
Rc is the ratio of basin area (A) to the area of circle having the same
circumfe-rence as the perimeter (P) of the watershed [57]. Circularity is the most useful shape morphometric measure in correlation with stream discharge. The general trend is that Rc value decreases with increasing stream order. Zavoianu [85]
ar-gued that the ratio is equal to unity when the watershed shape is a perfect circle, decreasing to 0.785 when the basin is a square, and continues to decrease to the extent to which the catchment becomes elongated. According to Miller [57], Rc
with low discharge of runoff and the subsoil of high permeability. The circularity ratio for the Zerqa River watershed is 0.284, whereas, the Rc values for 42
sub-watersheds are less than 0.2, and for one sub-watershed (no. 22), the Rc
val-ue is 0.867.
4.2. Prioritization of Sub-Watersheds Based on Morphometric Analysis
Morphometric analysis was recently employed extensively for prioritization of watersheds of different size (sub-watersheds, mini-watersheds, and micro- watersheds) for soil and water conservation [35][36][37][42][43][44][45][46] [56][57][58][59][86][87]. Erosion risk parameters related to linear and shape morphometric parameters were used for prioritizing sub-watersheds are: the bi-furcation ratio (Rb), stream frequency (Fs), drainage density (Dd), length of
over-land flow (Lo), and texture ratio (Tr). Additionally, the shape morphometric
va-riables include: form factor (Rf), compactness coefficient (Cc), shape factor (Bs),
elongation ratio (Re), and circularity ratio (Rc). Based on the range of calculated
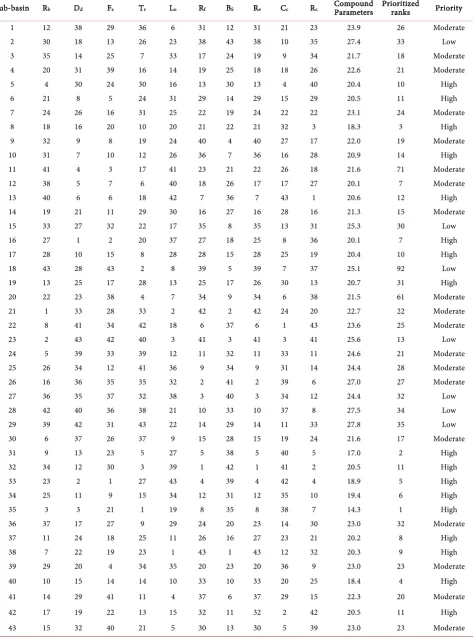
compound parameter (Cp) values (Table 4), the 43 sub-watersheds of the Zerqa
River were classified into three priority groups: (i) High priority (14.0 - 20.9)
(ii) Moderate priority (21.0 - 24.9) (iii) Low priority (25.0 - 27.9)
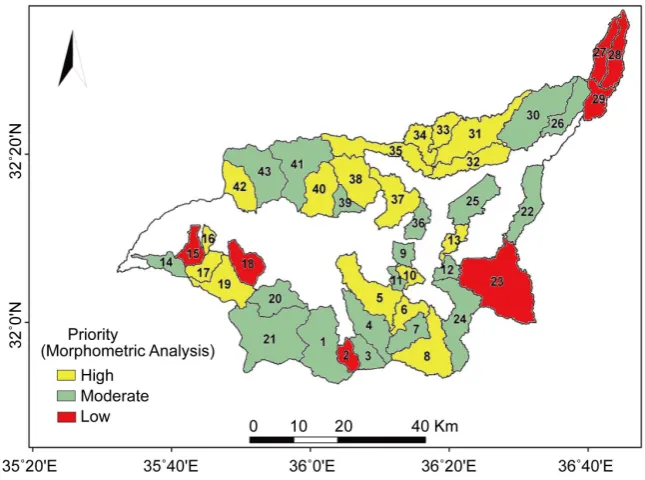
Using Arc GIS, the spatial distribution of the 43 sub–watershed groups based on the compound parameter (Cp) values was established. Figure 7 shows
[image:19.595.211.534.473.713.2]priori-ty groups of sub-watershed S for soil and water conservation. Accordingly, the highest priority indicates the greater degree of erosion risk associated with a par-ticular sub-watershed, and it becomes a potential area for adaptation of soil con-
impervious road networks [14][15]. Never the less, the estimated average annual soil loss rate in the several highland watersheds and rainfed agricultural areas was found to exceed the acceptable soil loss tolerance limits (2 - 12 ton∙ha−1∙year−1)
for the Mediterranean environments [88][89][90]. Therefore, priority must be given to the protection of sub-watersheds exposed to high soil erosion rates, and with degraded vegetation cover.
4.3. Prioritization of Sub-Watersheds Based on Principal Component Analysis (PCA)
Principal Component analysis (PCA) was conducted on 13morphometric para-meters as an efficient technique to express the physical behavior, and relation-ships between morphometric variables for a semi arid watershed with relatively poor hydrological records. Instead of using a correlation matrix, which affirms numerically the degree of association between every pairs of variables, PCA uti-lizes a “component loading” matrix, which expresses numerically the level of re-lationship between them and the original morphometric parameters. The weights of the original parameters in each component are called “loadings”, and each component is associated with a particular parameter. Besides interpreting the processes that generate the observed relationships between the chosen va-riables, PCA also provides a simplified data matrix known as the “component score” (or weightings) matrix [91]. The original 13 morphometric parameters were reduced to two significant components as illustrated by the “component loading matrix”, and the relationships between the rotated components and the original parameters are occasionally accommodated in the component loading matrix. These relationships are presented in terms of the percentage contributed to the variance in the original data. Also, it is noticeable that each component is more strongly correlated to some parameters that are considered most effective compared to others. The inter-correlation among the 13 basic, linear, and shape morphometric parameters related to the Zerqa River watershed are displayed in
Table 5. A strong correlation (correlation coefficient > 0.9) exists between elon-gation ratio (Re) and form factor (Rf). Good correlations (correlation coefficient >
0.75) exist between the elongation ratio (Re) and length of overland flow (Lo),
form factor (Rf) and length of overland flow (Lo), stream frequency (Fs) and
drainage density (Dd), bifurcation ratio (Rb) and basin area (A). Moderate
corre-lations (correlation coefficient > 0.6) also exist between compactness coefficient (Cc) and shape factor (Bs), length of overland flow (Lo) and bifurcation ratio (Rb),
basin length (Lb) and basin area (A), basin length (Lb) and perimeter (P). Table 6
shows the component loading matrix. It is obvious that the first two components whose eigen-values are greater than 1 and together account for 90.6% of the total variance in the original data are significant. The rotated component matrix (Table 7) shows that component 1 is highly correlated with bifurcation ratio (Rb), whereas component 2 is correlated satisfactorily with the shape factor (Bs)
and compactness coefficient (Cc). As indicated in (Table 7), the most important
Table 5. Inter-correlation matrix of morphomrtric parameters of the Zerqa River watershed. Morph.
Param. A P Lb Lu Rb Dd Fs Tr Lo Rf Bs Re Cc
A 1.000
P 0.710 1.000
Lb 0.604 0.684 1.000
Lu 0.394 0.283 0.420 1.000
Rb 0.837 0.649 0.448 0.441 1.000
Dd −0.578 −0.365 −0.476 −0.101 −0.287 1.000
Fs −0.592 −0.482 −0.538 −0.276 −0.255 0.753 1.000
Tr −0.219 −0.004 −0.137 0.174 −0.193 0.568 −0.042 1.000
Lo 0.652 0.361 −0.015 0.257 0.628 −0.356 −0.364 −0.110 1.000
Rf 0.150 0.008 −0.323 0.101 0.238 −0.055 −0.055 −0.014 0.828 1.000
Bs −0.160 0.235 0.578 0.091 −0.170 0.061 0.061 0.007 −0.512 −0.423 1.000
Re 0.209 −0.029 −0.427 0.088 0.276 −0.076 −0.083 −0.004 0.868 0.961 −0.636 1.000
Cc −0.247 0.403 0.114 −0.138 −0.127 0.311 0.292 0.154 −0.319 −0.202 0.603 −0.333 1.000
Table 6. Total variance explained of Zerqa River watershed.
Component
Initial Eigenvalues Extraction Sums of Squared Loadings Rotation Sums of Squared Loadings
Total Variance % of Cumulative % Total Variance % of Cumulative % Total Variance % of Cumulative %
1 498.368 71.858 71.858 498.368 71.858 71.858 485.937 70.066 70.066 2 129.980 18.741 90.600 129.980 18.741 90.600 142.411 20.534 90.600
3 49.864 7.190 97.789
4 6.671 0.962 98.751
5 5.237 0.755 99.506
6 1.799 0.259 99.766
7 0.874 0.126 99.892
8 0.443 0.064 99.956
9 0.202 0.029 99.985
10 0.067 0.010 99.994
pactness coefficient (Cc). Thus, these parameters are employed for prioritization
of the 43 sub-watersheds of the Zerqa River. Table 8 illustrates the compound parameter (Cp) values and the final priority ranks calculated based on the three
morphometric parameters (Rb, Bs, and Cs) elaborated by applying the PCA
tech-nique. On the basis of compound parameter (Cp), values, sub–watersheds were
[image:23.595.60.540.368.584.2]Table 7. Rotated component matrix.
Morph. Param. Component
1 2
A 0.905 −0.288
P 0.940 0.282
Lb 0.681 0.480
Lu 0.358 0.014
Rb 0.794 −0.251
Dd −0.500 0.152
Fs −0.582 0.102
Tr −0.099 0.110
Lo 0.543 −0.566
Rf 0.090 −0.415
Bs 0.023 0.953
Re 0.104 −0.624
Cc 0.106 0.746
Table 8. Final priority of the 43 sub-watersheds based on the PCA approach.
Sub-watershed Rb Bs Cc
Compound parameter
(Cp)
Final
Priority Sub-watershed Rb Bs Cc
Compound parameter
(Cp)
Final Priority
1 12 12 21 15 9 23 2 3 3 2.6 1
2 30 43 10 27.6 25 24 5 32 33 23.3 19
3 35 24 9 22.6 18 25 26 34 31 30.3 29
4 20 25 18 21 16 26 16 41 39 32 30
5 4 30 4 12.6 7 27 36 40 34 36.6 32
6 21 14 15 16.6 12 28 42 33 37 37.3 33
7 24 19 22 21.6 17 29 39 29 11 26.3 24
8 18 22 32 24 21 30 6 28 19 17.6 13
9 32 4 27 21 16 31 9 38 40 29 27
10 31 7 16 18 17 32 34 42 41 39 34
11 41 21 26 29.3 28 33 23 39 42 34.6 31
12 38 26 17 27 25 34 25 31 35 30.3 29
13 40 36 43 39.6 35 35 3 35 38 25.3 23
14 19 27 28 24.6 22 36 37 20 14 23.6 20
15 33 8 13 18 14 37 11 16 23 16.6 12
16 27 18 8 17.6 13 38 7 1 12 6.6 2
17 28 15 25 22.6 18 39 29 23 36 29.3 28
18 43 5 7 16.6 12 40 10 10 20 13.3 8
19 13 17 30 20 15 41 14 6 29 16.3 11
20 22 9 6 12.3 6 42 17 11 2 10 4
21 1 2 24 9 3 43 15 13 5 11 5
[image:24.595.57.544.357.735.2]Figure 8. Priority of 43-sub-watersheds based on PCA analysis.
classified under moderate priority. Further, sub-watersheds 2, 11, 12, 13, 25, 26, 27, 28, 29, 31, 32, 33, 34, 35, and 39 (34.9% of the total sub-watersheds) are ca-tegorized as low priority.
4.4. Comparison of Sub-Watershed Prioritization Based on Morphometric Analysis and PCA Analysis
Linear and shape parameters are employed to calculate the compound parameter (Cp) for the Zerqa River sub-watersheds, and the final priority ratings for sub-
watersheds along with their placement in each prioritization category is illu-strated in Table 4. It is found that 17, 19, and 7 sub-watersheds are classified under high, moderate, and low priority respectively. Similarly, after applying the PCA analysis based on three parameters (Rb, Bs, and Cc) which are highly
Table 9. Comparison of sub-watersheds for prioritization (morphometric and PCA ap-proaches).
Study Approach
Priority Rank
Low
High Moderate
Morphometric analysis
5, 6, 8, 10, 13, 16, 17, 19, 31, 32, 33, 34, 35, 37, 38,
40, 42
1, 3, 4, 7, 9, 11, 12, 14, 20, 21, 22, 24, 25, 26, 30, 36,
39, 41, 43
2, 15, 18, 23, 27, 28, 29
PCA analysis
5, 20, 21, 23, 38, 40, 41, 42, 43
1, 3, 4, 7, 8, 9, 10, 14, 15, 16, 17, 18, 19, 22, 24, 30,
36, 37, 41,
2, 11, 12, 13, 25, 26, 27, 28, 29, 31, 32, 33, 34, 35,
39 Common Sub
–watersheds 4 11 4
*The bold figures represent the common sub-watersheds.
and northern Jordan. However, further comparative research must be carried out in different environments to verify the conclusion arrived by Gajbhiya and Sharma [48]. Thus, it is still more appropriate to conduct watershed prioritiza-tion research based on morphometric linear and shape parameters, and other approaches developed for this purpose, and to concentrate on elaborating the morphometric parameters employed.
4.5. Proposed Soil and Water Conservation Measures
Linear and shape parameters were employed to ascribe the priority of the 43 sub-watersheds. Information on land use/cover, soil type and slope has been uti-lized to help in proposing appropriate soil and water conservation measures. In the western part of the Zerqa River catchment, sub-watersheds nos. 5, 6, 8, 10, 13, 16, 17, 19, 31, 32, 33, 34, 35, 37, 38, and 40 are classified under high priority for soil conservation measures. These sub-watersheds represent typical rainfed areas which are subjected to intense rejuvenation, landslide activity, and severe soil erosion, past and present abuse of land resources, recurrent droughts, overgraz-ing, and expansion of settlements at the expense of the fertile agricultural lands. It is worth noting that farmers of rainfed cultivation are aware of the soil erosion problem and its prospective consequences. For example, 27% of the farmer’ who lived across W. Kufranja (northern Jordan)and received a questionnaire de-signed to assess farmer’ perception of soil erosion and conservation, believe that efficient land management is urgently needed to recover intensively exploited land resources [33]. Further, 40.8% of respondents were convinced that affore-station and tree plantation are crucial for reducing soil loss. Expected advantages of enhancing soil and water conservation measures over the highland, which accommodate considerable areas of rainfed cultivation, could be illustrated in the following: control of soil erosion in fragile terrain units, reduction in sedi-ment load of the Jordan Rift wadis, and reduced peak flows across these wadis
structures. Twenty years following this construction and tree–planting, the esti-mated average soil loss decreased considerably to an average of 33 ton∙ha−1∙year−1
(35.76%). Moreover, it is postulated that in the years 1987-90, the estimated se-diments yields were less than the actual ones in the KTD reservoir of the Zerqa River. This was attributed to the execution of a conservation practice program (Lower the Zerqa River watershed) conducted by the government of Jordan, in cooperation with the German government [12]. Such encouraging results em-phasize the need to perform intensive research in order to reduce soil erosion loss, to improve the soil and water conservation techniques practiced, and to modify RUSLE parameters (i.e., C, P, and LS factors which are considered key factors in soil erosion). It has been stated that RUSLE parameters can be mod-ified significantly through altering farmers environmental practices [94] with the support of local governments, where the farmers are aware of soil erosion prob-lems. Cover and management factor (C), conservation practice factor (P), and slope length and steepness factor (Ls) can be improved noticeably to reduce soil
of the installation of efficient conservation structures, improvement of cropping practice is fundamental in order to mitigate soil erosion on flat, gently sloping, moderately sloping or sloping rainfed farming areas. Contour strip intercrop-ping cultivation at a proper planting density (i.e., 350 plants m−2) was found to
be a promising farming practice to reduce runoff and soil erosion [97]. Similarly, experimental results on soil erosion control and moisture conservation, revealed that the presence of rock fragments on the surface were highly effective in re-ducing runoff and soil loss. Traditionally, farmers tend to clear land surface of stone and rock fragments which should not be the case, at a certain level of sur-face coverage (i.e., 5% - 15%) [95]. Sub-watersheds nos. 9, 12, 21, 24, 25, 36, and 39 as an example are categorized as of moderate priority for soil conservation measures. All these sub-watersheds occupied semi-arid rangeland, and marginal cultivation, where the average annual rainfall is200 mm approximately. These marginal areas are termed locally “tenth land”, i.e., producing crops every ten years because of low rainfall. Continuous cultivation of marginal lands accele-rates soil erosion. Furthermore, ploughing these areas has eradicated the natural grasses, thus making them unsuitable for grazing. Overgrazing together with re-current drought, has gradually damaged the grazing capacity of the land. Con-sequently, the protection of present vegetation cover, and redeveloping of the natural vegetation by means of seeding selected areas/sub-watersheds with ap-propriate grasses, and planning for efficient rangeland management [98]. Ex-panding tree-planting of drought-resistance species is also recommended. Sub- watersheds nos. 23, 27, 28 and 29 are examples of low priority sub-watersheds for soil conservation measures. Most of the land surface here is covered by basal-tic boulders, cobbles, and basalt rock fragments of different sizes, depending on the rate of weathering and the geological age of basalt. These lands constitute poor rangeland. Field experiments under natural rainfall conditions revealed that the presence of cobbles, stone and rock fragments in the field decreases ru-noff and soil loss from the field and increases infiltration and natural vegetation cover [95]. Application of stone at 5% and 15% surface coverage caused reason-able reduction in runoff by an average of 17% and 30% respectively. Moreover, the corresponding reductions in soil loss for both stone treatments were as large as 35% and 53% respectively. Growth of trees also is found to be better with a reasonable stone coverage due to the increase of infiltration and decrease in soil loss. The optimal utilization for these sub-watersheds is to rehabilitate the vege-tation cover as a first step toward improving grazing potential.
5. Conclusion
sustainability. In the present investigation, integrated remote sensing, GIS, mo-phometric analysis, and principal component Analysis (PCA) techniques were employed to prioritize the sub-watersheds, and then to recommend efficient conservation measures. The prioritized sub-watersheds are located in three dif-ferent bio-climatic zones which are varied in terms of physical conditions. These are: the rainfed agricultural areas; the rangelands, and poor grazing areas which are partially covered with basalt boulders and cobbles. Prioritization of sub- watersheds was performed through analyzing ten linear and shape morphome-tric parameters related to the 43 sub-watersheds, and Principal Component Analysis. Then all sub-watersheds were assigned a rank on the basis of priority for adopting appropriate soil conservation measures. Additionally, supplemen-tary information on land use, slope, and soil types was utilized to help in pro-posing proper soil and water conservation structures particularly for sub-wa- tersheds as being categorized under high priority, and highly vulnerable to soil erosion loss. Appropriate soil conservation measures are suggested, taking into consideration land use/land cover in each sub-watershed, i.e., rainfed agricul-ture, limited irrigated farming, rangeland, soils, bare ground covered partially with basalt boulders and cobbles, and slopes which vary between 0 and 25˚. Re-levant soil conservation measures were proposed in accordance to priority as-cribed in order to minimize the adverse effect on land and environment. Fur-thermore, the priority assigned for the sub-watersheds was evaluated with refer-ence to morphometric properties, predominant environmental conditions, and Principal Component Analysis (PCA). The results of prioritization based on morphometric analysis indicate that sub-watershed no. 35 has been ranked 1 with lowest compound parameters (Cp) at 14.3, while sub-watershed no. 31 and
GIS techniques in prioritization of the Zerqa River sub-watersheds, and proves the capacity of morphometric parameters (computation and analysis) in priori-tization research within GIS platform, for the Zerqa River and other comparable watersheds in central and northern Jordan.
References
[1] Christopherson, G. and Guertin, D. (1995) Soil Erosion, Agricultural Intensifica-tion, and Iron Age Settlement in the Region of Tall el-Umeiri. Unpublished Paper Presented at the Annual Meeting of the American Schools of Oriental Research, Philadelphia.
[2] Cordova, C.E. (2000) Geomorphological Evidence of Intense Prehistoric Soil Ero-sion in the Highlands of Central Jordan. Physical Geography,21, 538-567.
[3] Jebari, S., Berndtsson, R., Labdi, F. and Bahri, A. (2012) Historical Aspects of Soil Erosion in the Mejerda Catchment, Tunisia. Hydrological Sciences Journal,57, 901- 912. https://doi.org/10.1080/02626667.2012.685741
[4] Mcdonald Partners and Hunting Technical Services LTD (1965) East Bank Water Resources Summary Report. Central Water Authority, Amman.
[5] Central Water Authority (1966) Hydrological Division. Floods in Southern Jordan on 11 March 1966, Amman, Jordan.
[6] Schick, A. (1971) A Desert Flood: Physical Characteristics, Effect on Man Geomor-phic Significance, Human Adaptation—A Case Study in the Southern Arava Wa-tershed. Jerusalem Studies in Geography,2, 91-155.
[7] Farhan, Y. (1986) Landslides in Central Jordan with Special Reference to the March 1983 Rainstorm. Singapore Journal of Tropical Geography,7, 80-96.
https://doi.org/10.1111/j.1467-9493.1986.tb00174.x
[8] Farhan, Y. (1999) Geomorphic Impacts of Highway Construction, Their Causes and Remedies: A Case Study from Aqaba, Southern Jordan. Arab World Geographer,2, 1-25.
[9] Farhan, Y. (2002) Slope Stability Problems in Central and Northern Jordan. Arab
World Geographer,5, 265-290.
[10] Harza (1980) Report on Dam Heightening. Jordan Valley Authority, Amman. [11] Lara, J.M. (1980) The 1980 Sedimentation Survey of King Talal Dam. Jordan Valley
Authority, Amman, Jordan.
[12] Al-Sheriadeh, M.S. and Al-Hamdan, A.Z. (1999) Erosion Risk Assessment and Se-diment Yield Production of King Talal Watershed, Jordan. Environmental Geology, 37, 234-242. https://doi.org/10.1007/s002540050381
[13] Al-Sherideh, M.S., Malkawi, A., Al-Hamdan, H. and Abdulrahman, N. (2000) Eva-luating Sediment Yield at King Talal Reservoir from Landslides along Irbid-Am- man Highway. Engineering Geology,56, 361-372.
https://doi.org/10.1016/S0013-7952(99)00119-2
[14] Al-Ansari, N. and Knutsson, S. (2010) Reduction of the Storage Capacity of Two Small Reservoirs in Jordan. Journal of Earth Science and Geotechnical Engineering, 2, 13-37.
[16] Farhan, Y. and Nawaiseh, S. (2015) Spatial Assessment of Soil Erosion Risk Using RUSLE and GIS Techniques. Environmental Earth Sciences,74, 4649-4669. https://doi.org/10.1007/s12665-015-4430-7
[17] Ministry of Water and Irrigation, Jordan (2010) Final Design of the Construction of Kufranja Dam. Energoprojekt, Belgrade.
[18] Ministry of Water and Irrigation, Jordan (2011) Final Design Report of Kerak Dam. Engicon, Amman.
[19] Ijam, A. and Tarawneh, E. (2012) Assessing of Sediment Yield for Wala Dam Cat-chment Area in Jordan. European Water,38, 43-58.
[20] Ijam, A. and Al-Mahamid, M. (2012) Predicting Sedimentation at Mujib Dam Re-servoir in Jordan. Jordan Journal of Civil Engineering,6, 448-463.
[21] Morgan, R. (1977a) Soil Erosion: Topics in Applied Geography. Longman, London. [22] Morgan, R. (1977b) Soil Erosion in the United Kingdom: Field Studies in the Silsoe
Area 1973-1975. Occasional Paper No. 4 National College of Agricultural Engi-neering, London.
[23] Dabbas, I. (1994) Soil Erosion Measurements in the Salt Area, Jordan. M.A. Thesis, University of Jordan. Amman. (In Arabic)
[24] Ananzeh, A. (1986) Sediment Yield of Wadi Kufranja Basin. M.A. Thesis, Universi-ty of Jordan, Amman. (In Arabic)
[25] Beni Taha, Q. (2004) Soil Erosion in Jerash Area. M.A. Thesis, University of Jordan, Amman. (In Arabic)
[26] Jawabreh, A. (1995) Soil Erosion Measurements in the Muwaqar Area, Jordan. M.A. Thesis, University of Jordan, Amman. (In Arabic)
[27] Al-Hamdan, A. (1996) Soil Erosion Measurements in the Azraq Area, Jordan. M.A. Thesis, University of Jordan, Amman. (In Arabic)
[28] Al-Shabatat, A. (2005) Environmental Deterioration and Land Management in the Petra-Showbak Area, Jordan. Ph.D. Dissertation. University of Jordan, Amman. (In Arabic)
[29] Beaumont, P. and Atkinson, K. (1969) Soil Erosion and Conservation in Northern Jordan. Journal of Soil and Water Conservation,24, 144-147.
[30] Willimott, S.G., Birch, B.P., Mckee, R.F., Atkinson, K. and Nimry, B.S. (1964) Con-servation Survey of the Southern Highlands of Jordan. Unpublished Report, De-partment of Geography, University of Durham, Durham.
[31] Willimott, S.G., Gilchrist-Shirlaw, D.G., Smith, R.A. and Birch, B.P. (1963) The Wadi Hasa Survey, Jordan. Unpublished Report, Department of Geography, Uni-versity of Durham, Durham.
[32] Atkinson, K., Beaumont, P., Bowen-Jones, H., Fisher, W.B. and Gilchrist-Shirlaw, D.W. (1967) Soil Conservation Survey of Wadi Shueib and Wadi Kufrein, Jordan. Unpublished Report, Department of Geography, University of Durham, Durham. [33] Farhan, Y., Zreqat, D. and Anbar, A. (2015) Assessing Farmers' Perception of Soil
Erosion Risk in Northern Jordan. Journal of Environmental Protection, 6, 867-884. https://doi.org/10.4236/jep.2015.68079
[34] Biswas, S., Sudhakar, S. and Desai, V.R. (1999) Prioritization of Sub-Watersheds Based on Morphometric Analysis of Drainage Basin: A Remote Sensing and GIS Approach. Journal of the Indian Society of Remote Sensing,27, 155-166.
https://doi.org/10.1007/BF02991569
Sensing and GIS Approach. Journal of the Indian Society of Remote Sensing,37, 261-274. https://doi.org/10.1007/s12524-009-0016-8
[36] Javed, A., Khanday, M.A. and Rias, S. (2011) Watershed Prioritization Using Mor-phometric and Land Use/Land Cover Parameters: A Remote Sensing and GIS Ap-proach. Journal Geological Society of India,78, 63-75.
https://doi.org/10.1007/s12594-011-0068-6
[37] Patel, D., Dholakia, M., Naresh, N. and Srivastava, P. (2012) Water Harvesting Structure Positioning by Using Geo-Visualization Concept and Prioritization of Mini-Watersheds through Morphometric Analysis in the Lower Tapi Basin. Journal
of the Indian Society of Remote Sensing,40, 299-312.
https://doi.org/10.1007/s12524-011-0147-6
[38] Patel, D., Gajjar, C. and Srivastava, P. (2013) Prioritization of Malesari Mini-Wa- tersheds through Morphometric Analysis: A Remote Sensing and GIS Perspective.
Environmental Earth Sciences,69, 2643-2656.
https://doi.org/10.1007/s12665-012-2086-0
[39] Gajbhiya, S., Mishra, S.K. and Pandey, A. (2014) Prioritizing Prone-Area through Morphometric Analysis: An RS and GIS Perspective. Applied Water Science, 4, 51-56. https://doi.org/10.1007/s13201-013-0129-7
[40] Abdul Rahaman, S., Abdul Ajeez, S., Aruchamy, S. and Jegankumar, R. (2015) Pri-oritization of Sub Watersheds Based on Morphometric Characteristics Using Fuzzy Analytical Hierarchy Process and Geographical Information System—A Study of Kallar Watershed, Tamil Nadu. Aquatic Procedia,4, 1322-1330.
https://doi.org/10.1016/j.aqpro.2015.02.172
[41] Kubit, O.E., Pluhar, C.J. and De Graff, J.V. (2015) A Model for Prioritizing Site and Reclamation Methods at Abandoned Mines. Environmental Earth Sciences, 73, 7915-7931. https://doi.org/10.1007/s12665-014-3949-3
[42] Khanday, M.Y. and Javed, A. (2016) Prioritization of Sub-Watersheds for Conser-vation Measures in a Semi Arid Watershed Using Remote Sensing and GIS. Journal
Geological Society of India,88, 185-196. https://doi.org/10.1007/s12594-016-0477-7
[43] Makwara, J. and Tiwari, M. (2016) Prioritization of Agricultural Watersheds in Semi Arid Middle Region of Gujarat Using Remote Sensing and GIS.
Environmen-tal Earth Sciences,75, 137-159. https://doi.org/10.1007/s12665-015-4935-0
[44] Gopinath, G., Nair, A.G., Ambili, G.K. and Swetha, T.V. (2016) Watershed Prioriti-zation Based on Morphometric Analysis Coupled With Multi Criteria Decision Making. Arab Journal of Geosciences,9, 129-146.
https://doi.org/10.1007/s12517-015-2238-0
[45] Fallah, M., Kavian, A. and Omidver, E. (2016) Watershed Prioritization in Order to Implement Soil and Water Conservation Practices. Environmental Earth Sciences, 75, 1248-1265. https://doi.org/10.1007/s12665-016-6035-1
[46] Nooka Ratnam, K., Srivastava, Y.K., Venkateshwara Rao, V. Amminedu, E. and Murthy, K.S.R. (2005) Check Dam Positioning and Prioritization of Micro-Water- sheds Using SYI Model and Morphometric Analysis-Remote Sensing and GIS Perspective. Journal of the Indian Society of Remote Sensing,33, 25-38.
https://doi.org/10.1007/BF02989988
[47] Patel, D.P. and Dholakia, M. (2010) Feasible Structural and Non-Structural Meas-ures to Minimize Effect of Flood in Lower Tapi Basin. International Journal WSEAS
Transactions of Fluid Mechanics,3, 104-121.