An Analysis of the Correlation between the Changes in
Satellite DNA Methylation Patterns and Plant Cell
Responses to the Stress
Darina A. Sokolova, Galina S. Vengzhen, Alexandra P. Kravets
Department of Plant Biophysics and Radiobiology, Institute of Cell Biology and Genetic Engineering, National Academy of Science of Ukraine, Kiev, Ukraine
Email: [email protected]
Received July 25,2013; revised August 22, 2013; accepted August 29, 2013
Copyright © 2013 Darina A. Sokolova et al. This is an open access article distributed under the Creative Commons Attribution Li-cense, which permits unrestricted use, distribution, and reproduction in any medium, provided the original work is properly cited.
ABSTRACT
The differences in satellite DNA methylation pattern of corn seedlings with various spontaneous chromosome aberra-tion yields and changes in methylaaberra-tion pattern of these DNA sequences under different exposure modes of acute UV-C and chronic gamma-irradiations have been investigated. The obtained experimental data and the conducted correlation analysis demonstrated the significant correlation between the satellite DNA methylation pattern varieties and chromo-some aberration yields under various stress exposure modes. The role of satellite DNA methylation pattern variability and its changing in key responses to stress such as mobile elements’ activation, cell’s passage of checkpoints, and homological repair was discussed.
Keywords: Stress Response; Plant Resistance; Satellite DNA Methylation Pattern; Brave-Pirson Linear Correlation
1. Introduction
Changing organism’s resistance to stress factors, various reactions, which role in this process depends on factor’s acting rate, duration and/or periodicity. Complexity of interactions in stress reactions can also be attributed to hierarchical-structural and functional, organism organi- zation, where different processes have various sensitivi-ties and times of development.
DNA methylation is one of the most important and polyfunctional mechanisms of biological regulation, which has a great significance in such epigenetic processes as genomic imprinting, differentiation, apoptosis and mor- phogenesis, aging of an organism, regulation of mobile elements’ activity [1-3].
It is also known that methylation of cytosine is the natural factor of mutagenesis [2] and at the same time it is a factor affecting regional DNA structure’s organiza- tion that is necessary for successful passage of enzymatic reactions, related to reading-out of information and repa- ration.
Plants contain most of methylated cytosine (up to 30%); the DNA methylation of these organisms is the result of functioning four groups of methyltransferases [2] that provide a great methylation sites’ variety.
It may be claimed that various methylation pathways can play important roles in stress response reactions and rearrangements of their resistance, whereas in alternative “to run or to fight” these organisms choose “fighting” at all levels of organization. A number of last investigations show some changes in level and pattern of DNA methy-lation under biotic [3,4] and different forms of abiotic stress—dryness [3], salinization [3-6], radiation expo-sures with various dose rates [7-9] and duration [8,10].
Polyfunctional of DNA methylation process also al-lows different ways of its participation both in failure (e.g. activization of mobile elements, initialization of genome instability) and/or formation of active protective reactions, associated with metabolism reorganization. Thus changes in DNA methylation level and/or pattern under different stress exposure [3-10] still require speci-fication oftheir biological significance.
In parallel with studying the majority of changes in transcribed DNA methylation pattern in their respon-siveness under stress exposures, great changes in satellite DNA methylation pattern have been detected [14].
It is known that satellite DNA is true to type compo-nent of eukaryotic genome. It consists of tandem organ-ized repeats, and it is never transcribed or encoded pro-teins and is located in heterochromatin part of chromo-some [15]. A high methylation level of satellite DNA’ cytosine has been shown but satellite DNA’s biological importance still hasn’t been understood. A question about biological role of changes in DNA methylation pattern under stress exposures and subsequent changes of cell resistance is also unexplored now.
The paper is dedicated to investigate the connection between variability of satellite DNA methylation pattern and spontaneous chromosome aberration’ rate as well as changes in methylation pattern of satellite DNA under different modes of acute UV-C and chronic gamma-ex- posure of seedlings. The study of DNA methylation pat-tern is performed by comparing the chromosomal aberra-tions yielded in meristematic tissues as the independent index that allowed to estimate the plant cell resistance.
2. Material and Method
The investigation of connection between satellite DNA methylation statuses with plant cell resistance to stress exposure was carried out in three series of experiments:
1) Acute UV-C exposure of epigenetically different corn seedlings (EDS). Preliminary three groups of corn’ seedlings with different germination rates were empiric selected: fast germinating (F-G), middle germinating (M- G), and slowly germinating (S-G). A great connection between germination rates and differences in transcribed DNA methylation pattern has been preinstalled;
2) Acute UV-C exposure in the mode of “adaptive ex- posure-challenge exposure” with different ranges be- tween the adaptive UV-C irradiation and challenge one (different mode UV-C exposure). The adaptive dose was 1 kJ/m2 and the challenge one—6.2 kJ/m2;
Combined exposure: preliminary chronic gamma-ex- posure of dry seeds with various accumulative dose and subsequent seedlings acute UV-C exposure.
Two intervals between the adaptive UV-C irradiation and challenge one were investigated: 4 hours and 24 hours. The necessity to expose seedlings in challenge dose (6.2 kJ/m2) and whole dose (7.2 kJ/m2) in the same
physiological state was taken into account. Thus such variants of irradiation were used:
1) Non UV-C irradiated seedlings; 2) Adaptive exposure (1 kJ/m2);
3) Adaptive exposure, in 4 hours-challenging one (6.2 kJ/m2);
4) Whole dose exposure (7.2 kJ/m2); exposure
simul-taneously with the challenging irradiation of variant 3; 5) Adaptive exposure, in 24 hours—challenging one (6.2 kJ/m2);
6) Whole dose exposure (7.2 kJ/m2); irradiation simul-
taneously with the challenging irradiation of variant 5. Such ways of irradiation were conducted both with seedlings from non preliminary gamma-irradiated seeds (NPI) and with seedlings from preliminary gamma-ir- radiated seeds (PI).
The study was performed using 3 - 7-days maize seed- lings, sort Titan. Seeds’ sprouting was conducted on bot- tom plates with wet filter paper, in thermostat under the temperature +23˚C - +24˚C. Bactericidal irradiator of the open type OBN-150М (Ukraine) with Philips Special TUV 30 W lamps was used. Three-day seedlings were exposed by UV-C in whole doses of 7.2 kJ/m2 (dose rate
was 6.2 W/m2) in the range 4 hours and 24 hours be-
tween adaptive and challenging irradiation as described above.
A glass container with 137CsCl
2 was used for investi-
gation of chronic exposure effects; dry seeds were ex- posed with dose rate 30 mR/h, accumulated dose reached 3.5 Gy.
The apical root meristems were used as an object for cytogenetic analysis. Sampling was carried out on the 4th day after irradiation. Detached apexes have been put to the Brodsky’ fixative (acetic acid: ethanol: formalin = 0.3:1:3) for two hours with following washing by 70% ethanol (3 - 4 times). Maceration has been performed by alkaline hydrolysis with 20% NaOH over two hours. Then prepa-rations have been washed in distilled water for 15 minutes. Staining was carried out by acetoarsein and hydrochloric acid mixture (acetoarsein: 1M HCl = 1:1) over 16 - 18 hours. Stained samples have been washed in 45% CH3COOH with following preparation the crushed
specimens. Ten alternative apexes were used and 5 - 10 thousands of cells were analyzed for every variant. The unstable chromosomal aberrations were detected using anaphase-telophase technique due to plant tissue speci-ficity. In spite of this cells’ sampling has averaged over 300 - 350 chromosomal aberrations during the anaphase in each preparation. A cytogenetic analysis was conducted
on the light microscope “Jenaval” (Germany).
Inde-pendent cytogenetic analisis was performed 8 times. Sig-nificance level (α) of assessment is 0.05.
Isolation of DNA was performed from the 6-day-old corn seedlings with the set of reagents DiatomTMDNA
Prep100 based onNucleoS-sorbent. The standard protocol for DNA extraction provided by the manufacturer was used. The concentration of DNA solution was measured by BioPhotometer Plus Eppendorf v.1.35 using standard technique [16,17].
amplifier “Tercik” (“DNA-Technology”, Moscow). One primer has been used: inter simple sequence repeat- ISSR (15-soro, sequence-5’-АС-АС-АС-АС-АС-АС-АС-
АС-<C>-3’), were synthesized by company “Metabion” (Germany) [18].
The restriction analysis as well as the PCR was carried out in the four-channel DNA-amplifier “Tercik” (“DNA- Technology”, Moscow). Two types of restriction en- zymes-isoschizomers were used: HpaII (5’.C CGG.3’), MspI (5’.C CGG.3’) and restrictase MboI (“Fermentas”, Germany). Reactions were performed according to the conventional manual by the supplier (Table 1).
The reaction mixture for the HpaII-analysis (total volume 25 µl) contained: 0.2 µl HpaII, 2.0 µl 10хBuffer Tango, 1.5 µg total DNA and 17.7 µl deionized water. The mixture has been covered with the 20 µl of mineral oil.
The reaction mixture for the MspI-analysis (total volume 25 µl) contained: 0.6 µl MspI, 2.0 µl 10хBuffer Tango, 1.5 µg total DNA and 17.1 µl deionized water. The mixture has been covered with the 20 µl of mineral oil.
The reaction mixture for the MboI-analysis (total volume 25 µl) contained: 0.2µl MboI, 2.0 µl 10хBuffer Tango, 1.5 µg total DNA and 17.7 µl deionized water. The mixture has been covered with the 20 µl of mineral oil.
The conditions for restriction reactions were: 16 hours under 37˚C, then 20 min under 65˚C (for HpaII and MboI) and 20 min under 80˚C (for MspI) to stop the reactions.
Products of PCR and restriction analysis were sepa- rated in 1.0% agarose gel with TBE-buffer at the pres- ence of ethidium bromide, and visualized in UV-transil- luminator. The same volume of PCR and restriction products (10 µl) was brought into the gel pockets. The FastRuler High Range DNA Ladder (“Fermentas”, Ger- many) with fragments’ length 10,000, 4000, 2000, 1000 and 500 base pairs and the FastRuler Low Range DNA Ladder (“Fermentas”, Germany) with fragment length 1500, 850, 400, 200 and 50 base pairs were used as a molecular weight markers. Independent ISSR-PCR was performed 8 times also.
[image:3.595.311.537.198.306.2]Experimental findings statistical analysis–the variance value and the Brave-Pirson’s correlation coefficient- were calculated with traditional method [19].
Table 1. Restriction enzymes and their sites of recogni-tion/restriction.
Restriction enzyme Sites of recognition/restriction
MspI HpaII
MboI
5’C…C*CG, C…5’ 5’…C*CGG…3’ 3’G…G C*C…5’ 5’…C*CGC…3’ 3’…CT…AG *C…5’
3. Results and Discussion
The obtained cytogenetic data pointed out major varieties in chromosome aberrations’ yield (Ab, %) appeared among groups F-G, M-G and S-G seedling (Figure 1).
The electrophoregram of isolated DNA nativity is shown in Figure 2.
[image:3.595.308.537.368.488.2]The electrophoregram of native DNA amplification with ISSR primers (Figure 3) shows specific differences
Figure 1. The chromosome aberration yield (α = 0.05) in root meristem of corn seedlings with various germination rates; C-non–irradiated seedlings; UV-C-seedlings irradi-ated with UV-C.
[image:3.595.309.538.540.680.2]M 1 2 3 4 5 6
Figure 2. The electrophoregram of isolated DNA quality. М—high-molecular-weight marker; 1—“FG” sample; 2— “FG + UV-C” sample; 3—“MG” sample; 4—“MG + UV-C” sample; 5—“SG” sample; 6—“SG + UV-C” sample.
M 1 2 3 4 5 6
[image:3.595.56.286.657.736.2]in amplicons range of irradiated and unirradiated fast- growing seedlings (positions 1 and 2).
These data do not contradict with data about good na- tivity of isolated DNA. The most appropriate explanation is connected with appearance of damage during PCR that might indirectly evidence about low methylation level of this DNA part in fast-growing seedlings resulting to greater vulnerability of these DNA samplers 1.
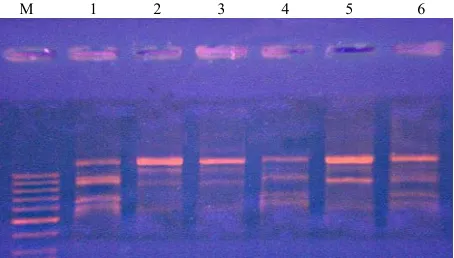
An electrophoregram of the amplification products obtained by ISSR-PCR of the MspI restriction products (Figure 4) illustrated the differences in DNA methyla- tion pattern among seedlings with various germination rates (positions 1, 3, 5).
The electrophoregram of fast-germinated seedlings (F- G, position 1) had four distinct groups of amplicons with almost the same number of DNA fragments. The groups of amplicons (positions 3 and 5) for variants “M-G” and “S-G” had the same molecular weight, but different number of DNA fragments.
The comparison of positions 1 and 2, 3 and 4, 5 and 6 of this electrophoregram (Figure 4) shows great changes of satellite DNA methylation pattern after irradiation. Positions 2, 4, 6 are also differing from each others that correspond to increased chromosome aberration’ yield after UV-C exposure (Figure 1).
Also considerable differences between methylation patterns of satellite DNA of seedlings that initially had various germination rates (positions 1, 3, 5) were ob- served in separating amplification products of MboI re- stricts with ISSR–primers (Figure 5). There was just one type of amplicons for “F-G” seedlings and great differ- ences between “M-G” and “S-G” variants. Electrophore- gram for “M-G” seedlings had four distinct groups of amplicons with comparatively more high-molecular frag- ments.
The comparison of positions 1 and 2, 3 and 4, 5 and 6 of this electrophoregram (Figure 5) shows great changes of satellite DNA methylation pattern after irradiation.
[image:4.595.311.539.86.225.2]M 1 2 3 4 5 6
Figure 4. The electrophoregram of the amplification prod- ucts obtained by ISSR-PCR of the MspI restriction prod- ucts. М—high-molecular-weight marker; 1—“FG” sample; 2—“FG + UV-C” sample; 3—“MG” sample; 4—“MG + UV-C” sample; 5—“SG” sample; 6—“SG + UV-C” sample.
[image:4.595.59.286.548.677.2]M 1 2 3 4 5 6
Figure 5. The electrophoregram of the amplification ucts obtained by ISSR-PCR of the MboI restriction prod-ucts. М—high-molecular-weight marker; 1—“FG” sample; 2—“FG + UV-C” sample; 3—“MG” sample; 4—“MG + UV-C” sample; 5—“SG” sample; 6—“SG + UV-C” sample.
Positions 2, 4 do not have major differences from each other. The greatest difference is observed between posi- tions 4 and 6. Such differences correspond to various in- creasings in the chromosome aberration’ yield after UV- C exposure (Figure 1).
Thus original difference in satellite DNA methylation pattern is connected to differences in pattern changes under irradiation exposure and chromosome aberration’ yield. This indicates both different effectiveness of repair processes or various original sensitiveness to damage.
Consider the data about acute UV-C exposure mode “adaptive-challenging irradiation” as well as combined exposure whereby seedlings growing from preliminary gamma-irradiated seeds have been exposed.
Chromosome aberration yield in root meristematic tissue (Figure 6) indicates to major differences in ap-pearance of seedlings’ adaptive reactions that have grown from unexposed and gamma-exposed seeds. Chronic radiation exposure of seeds causes increase of chromo- some aberration rate in seedlings’ root meristematic tis- sues. UV-C exposure of seedlings from preliminary un- irradiated seeds with adaptive dose leads to increasing chromosome aberration yield whereas exposure of seed- lings from preliminary irradiated seeds causes the hor-metic effect. Exposure mode “adaptive, in 4 hours-chal- lenging” causes the appearance of adaptive response for seedlings without preliminary irradiation exposure; with interval in 24 hours between adaptive and challenging exposure the adaptive response haven’t been observed. Seedlings from preliminary irradiated seeds didn’t show the adaptive response with both intervals between adap- tive and challenging irradiation.
Figure 6. The chromosome aberration yield (α = 0.05) in root meristem of corn seedlings from non preliminary gamma-irradiated seeds (NPI), and preliminary gamma- irradiated seeds, ( PI ) with UV-C irradiation mode as de-scribed in “ Material and Methods”.
ellite DNA methylation pattern.
The electrophoregrams of DNA quality checking are shown in Figure 7. These results demonstrate the absence of meaningful DNA fragmentation that would take a place in apoptosis inducing by UV-C irradiation.
The electrophoregram of native DNA amplification shows specific differences in comparison with all other variants of amplicon’s range for variant “adaptive-chal- lenge exposure in 24 hours” (Position 6). The most ap- propriate explanation is connected to appearance of ulte- rior (single-stranded) injuries during PCR. It’s essential that the features of DNA fragmentation are observed in a variant exposed with full dose at a time.
For Figures 7-11: 1. Total control (NPI and non UV-C irradiated seedlings); 2. NPI + adaptive exposure; 3. NPI + adaptive exposure, in 4 hours-challenging one; 4. NPI + whole dose exposure (7.2 kJ/m2); exposure
simultane-ously with the challenging irradiation of variant 3); 5. NPI + adaptive exposure, in 24 hours-challenging one; 6. NPI+ whole dose exposure; irradiation simultaneously with the challenging irradiation of variant 5; 7. PI + non UV-C irradiation; 8. PI + adaptive exposure; 9. PI + adaptive exposure, in 4 hours–challenging one;10.PI + whole dose exposure; exposure simultaneously with the challenging irradiation of variant 3 and 9); 11. PI + adap-tive exposure, in 24 hours-challenging one; 12. PI + whole dose exposure; irradiation simultaneously with the challenging irradiation of variants 5 and 11.
The electrophoregram of MboI restricts’ ISSR ampli- fication shows various differences in DNA methylation patterns according to exposure mode. Comparison of positions 1 (seedlings from seeds without preliminary irradiation) and 7 (seedlings from preliminary gamma- irradiated seeds) indicates to major differences in range of amplicons: as a result of dry seeds chronic exposure the satellite DNA methylation pattern of seedlings shows some complication on electrophoregram because of ap-
[image:5.595.59.288.84.224.2]M 1 2 3 4 5 6 7 8 9 10 11 12
Figure 7. The electrophoregram of isolated DNA quality.
[image:5.595.310.539.245.371.2]M 1 2 3 4 5 6 7 8 9 10 11 12
Figure 8. The electrophoregram of native DNA ISSR-am- plification.
M 1 2 3 4 5 6 7 8 9 10 11 12
Figure 9. The electrophoregram of MboI restricts’ ISSR amplification.
M 1 2 3 4 5 6 7 8 9 10 11 12
[image:5.595.311.536.410.546.2] [image:5.595.309.537.585.710.2]M 1 2 3 4 5 6 7 8 9 10 11 12
Figure 11. The electrophoregram of HpaII-restricts ISSR- amplification.
pearance of amplicons with low and middle weight. It’s essential that variants 9 - 12 show identical ranges and parallels with the same chromosome aberration yield in the variants are also possible (Figure 6).
The electrophoregram of ISSR-amplification of MspI restricts shows various changes in DNA methylation pattern according to exposure mode. Comparison of po- sitions 1 (seedlings from seeds without preliminary irra- diation) and 7 (seedlings from preliminary gamma-ex- posed seeds) indicates to major differences in amplicons range: after dry seeds’ chronic irradiation satellite DNA methylation pattern leads to great complication of elec- trophoregram because of appearing low-weight ampli- cons indicated to increase of restriction MspI sites. Major difference of 8th variant is observed, which demonstrates
hormesis effect in terms of chromosome aberration yield. It’s essential that variants 9 - 12 show identical ranges as well as MboI enzyme.
Electrophoregram of HpaII-restricts’ ISSR-amplifica- tion indicates to less dependence of amplicon range from exposure mode. The differences between positions 1 (seedlings from seeds without preliminary irradiation) and 7 (seedlings from preliminary gamma-irradiated seeds) are also visible because of less content of high- molecular weight fragments. Great difference of variants 9 and 10-12 that corresponds almost identical chromo- some aberration yield is observed (Figure 6).
Quantify connection between changes in satellite DNA methylation patterns and chromosome aberrations’ yield under various affects using Brave-Pirson’s linear correla- tion. To perform such approach we have to suggest some principals of quantifying various changes on electro- phoregrams and their degrees.
There are several significant quantitative characteris- tics of DNA methylation pattern changes that could be registered on electrophoregrams:
1) Change of general amplicons’ number; wherein following versions are possible:
a) Changes in molecular mass of amplicons, i.e. posi- tion related to ladder bands on electrophoregram but
within the amplicons’ mass of control variant; neverthe- less the number of new control bands or their disappear- ance could be various;
b) The appearance of amplicons with mass that greatly exceed the limits of control bands’ mass both in the range of more high molecular mass and;
2) Change of bands’ brightness–that indicates to changing number of amplicone’ fragments of the same mass;
3) The combination of the listed above quantitative in-dicators.
Interactions between these various indicators greatly exceed the classification possibilities of changes in DNA methylation pattern and accordingly the correlation esti-mation between their changing rates.
Consider the simplest connection type-linear correla- tion between the number of amplicons and the chromo- some aberrations’ yield for various series of experiments. The statistical analysis for each experimental series was conducted separately.
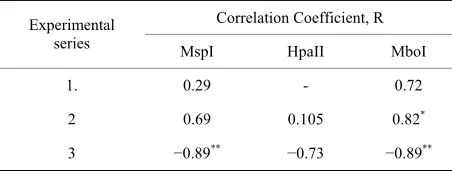
Correlation indexes shown in Table 2 indicate to exis-tence of significant (α = 0.05) positive correlation be-tween amplicons’ number and chromosome aberration yield for experiments with acute UV-C exposure and MboI enzyme and significant negative correlation (α= 0.01) just for experiments with composed radiation ex-posure and MspI ans MboI enzymes.
To continue the correlation analysis using more detail approach via determination of 5 grades (from 0 to 4) of methylation patterns’ varieties. It will be used following indexes:
0—The absence of differences according to control variant;
1—The differences in amplicons’ number, which mass is in the range of control amplicons’ mass;
2—The differences in amplicons’ number, which mass is in the range of control amplicons’ mass + differences in brightness of bands that indicates to various number of fragments in one amplicon;
3—The differences in amplicons’ number, which mass is not in the range of control amplicons’ mass;
4—The differences in amplicons’ number, which mass is not in the range of control amplicons’ mass + differ-
Table 2. The coefficient of correlation between amplicons’ number and chromosome aberration yield.
Correlation Coefficient, R Experimental
series MspI HpaII MboI
1. 0.29 - 0.72
2 0.69 0.105 0.82*
3 −0.89** −0.73 −0.89**
[image:6.595.310.536.638.724.2]ences in brightness of bands.
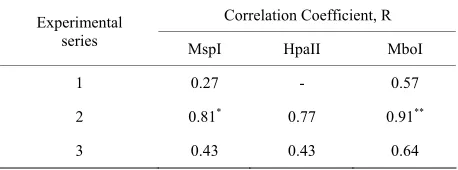
Results of this way of correlation assessment are shown in Table 3.
Thus such approach for determination the degree of methylation pattern changes increased the correlation index for some variants and decreased it for another one.
Continue the specification of approach to correlation assessment via determination of 9 grades (from 0 to 8) of methylation patterns’ varieties. It will be used following indexes:
0—The absence of differences according to control variant;
1—The differences in amplicons’ number (n), which mass is in the range of control amplicons’ mass, n ≤ 3;
2—The differences in amplicons’ number (n), which mass is in the range of control amplicons’ mass, n ≤ 3 + differences in their brightness;
3—The differences in amplicons’ number (n > 3), which mass is in the range of control amplicons’ mass;
4—The differences in amplicons’ number (n > 3), which mass is in the range of control amplicons’ mass + differences in their brightness;
5—The differences in amplicons’ number (n ≤ 3), which mass is not in the range of control amplicons’ mass;
6—The differences in amplicons’ number (n ≤ 3), which mass is not in the range of control amplicons’ mass + differences in their brightness;
7—The differences in amplicons’ number (n > 3), which mass is not in the range of control amplicons’ mass;
8—The differences in amplicons’ number (n > 3), which mass is not in the range of control amplicons’ mass + differences in their brightness.
Results of this way of correlation assessment are shown in Table 4.
[image:7.595.308.537.123.208.2]Specification of differences between electrophore- grams and number of their grades could be continued using additional characteristics of electrophoregrams and their combination. However performed correlation analysis using three approaches allows to make general
Table 3. The coefficient of correlation between 5 grades of electrophoregram varieties and chromosome aberration yield.
Correlation Coefficient, R Experimental
series MspI HpaII MboI
1 0.27 - 0.57
2 0.81* 0.77 0.91**
3 0.43 0.43 0.64
[image:7.595.58.287.639.724.2]*α = 0.05; **α = 0.01.
Table 4. The coefficient of correlation between 9 grades of electrophoregram varieties and chromosome aberration yield.
Correlation Coefficient, R Experimental
series MspI HpaII MboI
1 0.57 - 0.64
2 0.87* 0.84* 0.89**
3 0.21 0.71 0.7
*α = 0.05; **α = 0.01.
conclusion about existence of quantitative connection between chromosome aberration yield like both integral cell stress response and changes in satellite DNA methy- lation pattern.
Performed analysis also show that unique approach to quantify connection between chromosome aberration yield and their rates on electrophoregrams doesn’t exist. Such suggestion points to possible difference in mecha- nisms of cell response to exposure type (physical expo- sure, exposure rate and duration and so on).
The investigation of differential gene activity using micro array methods and changes of DNA methylation pattern indicated that according to exposure type and intensity the activity of various gene groups had changed. That’s for satellite DNA–its direct or indirect participa- tion in cell stress response could be related to different mechanisms according to exposure type.
Despite of ways of satellite DNA participation in stress reaction such mechanisms are different as well as for transcribed DNA.
It should have been emphasized that for experimental series 1 with 3 polymorphic groups of plants significant correlations weren’t obtained with any criteria. Reason for such phenomena is connected to original epigenetical polymorphism of biological material and deficient sam- pling from 6 variants for correlation assay.
4. Conclusions
Comparison of the results of cytogenetic analysis with changes in methylation patterns of satellite DNA after irradiation pointed out to their connections with different stress tolerance.
Change of the satellite DNA methylation profile may reflect the mobile elements activization, mostly associ- ated with satellite DNA [13], and indicate the damage’s progress. Such ability is especially essential for corn; it’s known that nearly 50% satellite DNA of the plant are represented with mobile elements [2,3,15].
conceptions, it was assumed to have a structural role in spatial organization of genome, and take part in homo- logous chromosomes’ conjugation during meiosis and re- plication of chromosomes’ telomeric sites [15]. Probably in this case different methylation patterns of satellite DNA, which meant various chromatin conformations, could have interactive character: specific methylation patterns of transcribed DNA may play role in transcrip- tion processes only under definite conformation of all the chromatin.
Interaction between satellite DNA methylation pattern and resistance to external exposures might have another explanation. It could result not only from efficient func- tioning of repair systems of spontaneous и inducible DNA injuries, but also from systems responsible for passing cell cycle checkpoints and complete repair of double-stranded DNA breaks. It was known, that effec- tive repair of double-stranded DNA breaks with the mechanism of homologous recombination was possible only under conditions of certain level of chromatin re- laxation [20], so it was also associated directly to the conformation of satellite DNA.
Thus conducted research provides grounds to suggest that satellite DNA methylation patterns and their changes might have various roles in cell response to stress factor. All the functions are mediated by conformation changes of these DNA sequences.
5. Acknowledgements
Funding for the study was provided by the Academy of Science of Ukraine, Grant No. III-3-08 “Epigenetic com- ponents of plant adaptation”.
We thank PhD, Head of Laboratory of Molecular Ge- netics Morgun B.V., Institute of Cell Biology and Ge- netic Engineering, National Academy of Science of Ukraine for help in method mastering.
REFERENCES
[1] R. L. P. Adams, “DNA Methylation,” Principles of Medical Biology, Vol. 5, 1996, pp. 33-66.
doi:10.1016/S1569-2582(96)80107-3
[2] E. N. Tishchenko and O. V. Dubrovnaya, “Epigenetic Re- gulation. DNA Methylation of Genes and Transgenes in Plants,” Logos, Kiev, 2004, 384 Pages.
[3] M.-T. Hauser, W. Aufsatz, C. Jonak and Ch. Luschnig, “Transgenerational Epigenetic Inheritance in Plants,” Bio- chimica at Biophysica Acta, Vol. 1809, No. 8, 2011, pp. 459-468. doi:10.1016/j.bbagrm.2011.03.007
[4] A. Agorio and P. Vera, “ARGONAUTE4 Is Required for Resistance to Pseudomonas syringae in Arabidopsis,”
The Plant Cell, Vol. 19, No. 11, 2007, pp. 3778-3790. doi:10.1105/tpc.107.054494
[5] A. Bilichak, Y. Ilnystkyy, Y. Hollunder and I. Kovalchuk,
“The Progeny of Arabidopsis Thaliana Plants Exposed to Salt Exhibit Changes in DNA Methylation, Histone Modifications and Gene Expression,” PLoS One, Vol. 7, No. 1, 2012, pp. 1-15.
[6] L. Zhong, Y. Xu and J. Wang, “DNA-Methylation Changes Induced by Salt Stress in Wheat Triticum aestivum,” Af- rican Journal of Biotechnology, Vol. 8, No. 22, 2009, pp. 6201-6207.
[7] O. Kovalchuk, P. Burke, A. Arkhipov, N. Kuchma, S. J. James, I. Kovalchuk and I. Pogribny, “Genome Hyper- methylation in Pinus silvestris of Chernobyl—A Mecha- nism for Radiation Adaptation?” Mutation Research, Vol. 529, No. 1-2, 2003, pp. 13-20.
doi:10.1016/S0027-5107(03)00103-9
[8] I. Kovalchuk, V. Abramov, I. Pogribny and O. Kovalchuk, “Molecular Aspects of Plant Adaptation to Life in the Chernobyl Zone,” Plant Physiology, Vol. 135, No. 1, 2004, pp. 357-363. doi:10.1104/pp.104.040477
[9] I. Pogribny, I. Koturbash, V. Tryndyak, D. Hudson, S. M. L. Stevenson, O. Sedelnikova, W. Bonner and O. Koval- chuk, “Fractionated Low-Dose Radiation Exposure Leads to Accumulation of DNA Damage and Profound Altera- tions in DNA and Histone Methylation in the Murine Thymus,” Molecular Cancer Research, Vol. 3, No. 10, 2005, pp. 553-561.
doi:10.1158/1541-7786.MCR-05-0074
[10] A. P. Kravets, T. A. Mousseau, A. V. Litvinchuk, Sh. Os- termiller and G. Vengzhen, “Changes in DNA Methyla- tion Pattern in Weat Plants under Chronical γ—Exposure of Seeds,” Cytology and Genetics, Vol. 44, No. 5, 2010, pp. 18-22. doi:10.3103/S0095452710050038
[11] M. A. Coleman, E. Yin and L. Peterson, “Low-Dose Irra- diation Alters the Transcript Profiles of Human Lym- phoblastoid Cells Including Genes Associated with Cy- togenetic Radioadaptive Response,” Radiation Research, Vol. 164, No. 4, 2005, pp. 369-382.
doi:10.1667/RR3356.1
[12] M. Banda, A. Bommineni, R. A. Thomas, L. S. Luckin- bill and J. D. Tucker, “Evaluation and Validation of Housekeeping Genes in Response to Ionizing Radiation and Chemical Exposure for Normalizing RNA Expres- sion in Real-Time PCR,” Mutation Research, Vol. 8, No. 649, 2008, pp. 126-134.
[13] A. M. Serebryanyi, “Radiation Adaptive Response as a Stress Reaction of a Cell,” Radiatsionnaya Biologiya. Radioekologiya, Vol. 51, No. 4, 2011, pp. 399-405. [14] A. Kravets, D. Sokolova, G. Vengzhen and D. Grodzin-
sky “Corn Plant DNA Methylation Pattern Changes at UV-C Irradiation Fractionating,” Cytology and Genetics, Vol. 47, No. 1, 2013, pp. 29-35.
doi:10.3103/S0095452713010052
[15] V. Hemleben, T. G. Beridze, L. Bakhman, Y. Kovarik and R. Torres, “Satellite DNA,” Uspehi Biologicheskoy Khimii, Vol. 43, 2003, pp. 267-306.
[16] F. M. Ausubel, “Current Protocols in Molecular Biol- ogy,” Biophotometer Operating Manual, 2004.
http://www.eppendorf.com
mana Press Incorporate, Humana, 2003.
http://www.dartmouth.edu/~eprctr/biodose2008/pdf/B10. pdf
[18] Y. M. Tikunov and L. I. Khrystaleva, “Application of ISSR Markers in the Genus Lycopersicon,” Euphitica, Vol. 131, No. 1, 2003, pp. 71-80.
doi:10.1023/A:1023090318492
[19] A. V. Lakin, “Biometry,” High School, Moskva, 1990. [20] A. I. Gaziev, “Deterioration of Critical DNA Damage