Structure and Mechanical Behavior of Cellulose Nanofiber
and Micro-Fibrils by Molecular Dynamics Simulation
Ken-ichi Saitoh1, Haruhiko Ohno1, Syunichiro Matsuo2
1Department of Mechanical Engineering, Faculty of Engineering Science, Kansai University, Suita, Japan; 2KYOCERA Corporation, Kyoto, Japan.
Email: [email protected]
Received March 30th, 2013, revised May 3rd, 2013; accepted May 12th, 2013
Copyright © 2013 Ken-ichi Saitoh et al. This is an open access article distributed under the Creative Commons Attribution License, which permits unrestricted use, distribution, and reproduction in any medium, provided the original work is properly cited.
ABSTRACT
Cellulose nanofiber (CNF) and CNF micro-fibrils (CNF-MFs) are computationally modeled by molecular dynamics with united atom (UA) methodology of polymers. Structural stability and mechanical properties of these materials are focused on. Diffusion coefficient decreases with increase of the number of shells in CNF-MF. The structure of CNF-MFs with crystalline alignment is totally stabilized with twist which is an accumulation of torsion angles at Gly-cosidic bonds between monomers inside CNFs. Unique fiber drawing simulation, where a single CNF fiber is taken out of CNF-MF structure, is first conducted. The CNF fiber which is drawn out stretches up to relatively large strain, with linear increase of tensile stress. The computation results show that, the larger the number of shell structure of CNF-MF is, the larger the stretch and the stress of drawn fibers are.
Keywords: Cellulose; Nanofiber; Molecular Dynamics; Wiredrawing; Mechanical Properties; Biomaterial;
Twist Angle
1. Introduction
Cellulose substance is known to be the elementary cons- tituent of plants and bacteria. As natural materials, plants, wood and tree are put in use with ecological benefit. A basic element of cellulose substances is a small molecu- lar chain which is composed of many pieces of a na- no-sized structure of “cellulose monomer”. As the se- cond leveled structure of cellulose molecules, cellulose micro-fibril (MF) is constructed [1]. It is interesting from mechanical engineering viewpoint that, even though plants, tree and wood are natural biomass, they are basi- cally made up of this single unit like synthetic polymers. Excellent application in engineering will be realized in the future by these natural materials, together with de- velopment of complicated hierarchical structures along the size scale [2].
Recently, exploration of cellulose nanofiber (CNF) has been developed as a new material. Some engineers are proposing that CNF may be made into an optically transparent sheet [3] and new type of composite [4]. It is supposed that strength and toughness required for these new materials will be realized by optimized design of CNF from nano-scale. However, since CNF is too small
to be observed experimentally, it is expected that theo- retical and computational modeling and simulation will provide in advance much insight and information for unknown material properties of CNF. By analyzing CNF with computational methodology, we can also approach general structure, behavior and property of other na- no-scale fibers with only the atomic or molecular size. Examples will be found in “collagen” fibers [5] in ani- mals’ hard-tissue, or inorganic “nanowire” made of me- tallic elements (e.g. gold nanowire [6] and magnesium nanowire [7]) or semiconductor elements (e.g. sili- con/carbon nanotube and nanowire [8]). In fact, the me- chanical behavior and useful properties of these nano-sized materials have to be clarified more.
a natural CNF-MF.
In order to acquire mechanical properties and behavior of CNF or CNF-MF, computational modeling and simu- lation of the material are worthwhile studying and will be necessary for future development of this field. In this paper, we should study on molecular dynamics (MD) modeling of CNF and are about to start to link the mod- eling to macroscopic behavior.
In microscopic scale, as stated above, cellulose mol- ecule is constructed from a monomer, which is called
β-D-glucose. The all-atom (AA) model of β-D-glucose and its polymerization have been considered [9]. There are intra-molecule bonding as well as hydrogen bonding and van-der-Waals bonding (intermolecular interactions). The AA model is certainly more precise, but in order to obtain dynamic behavior of molecule, we should use more coarse-grained modeling such as united atom (UA) method for polymer structure. MD studies of bulk struc- ture have been done for Cellulose I [10] and Cellulose II [11], but any CNF-MF model, to our knowledge, has not calculated yet. In this paper, we are originally developing a new UA model of CNF and are utilizing it to the MD simulation of CNF-MFs.
The purpose of this study is to clarify the mechanical behavior, such as deformation and strength, of CNF and CNF-MF. In particular, we will discuss the stability of CNF-MFs depending on shell (crystalline) structure, and will evaluate the durability of a single fiber by a unique fiber drawing (wiredrawing) test. These studies will con- tribute to the future development in the field of upcoming CNF-related research, in which experimental facts are somewhat relying on computational predictions. It is sup- posed by the authors that the simulation is advantageous in making theoretical insight and in predicting unknown behavior of CNF and CNF-MFs.
The present paper is organized as follows. In the fol- lowing section, we explain about the atomistic modeling of CNF and provide its verification. Then, the results on stability of CNF-MFs, and their tensile (fiber drawing) testing of CNF-MF structures are shown. These results are discussed, and then conclusion is made.
2. Theory and Method
2.1. Microscopic Structure of Cellulose Molecule
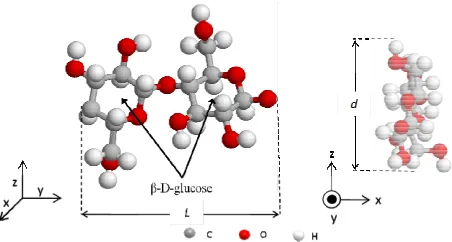
CNF is the elementary structure which is basis for all cellulose-originated materials, such as paper, plants and trees. The monomer structure of cellulose molecule has already been theoretically predicted as shown in Figure 1. A lot of cellulose monomers are polymerized and be-
[image:2.595.311.537.98.219.2]come a fiber with long chain shape. Then, these chains form a micro-fibril (CNF-MF), which usually has a crys- talline structure and is recognized as higher-order struc-
Figure 1. All-Atom (AA) model of cellulose molecule.
ture when cellulose molecules are growing and aggre- gating. However, crystalline state of cellulose is likely to present many polymorphs. For example, there exist cel- lulose I-IV, or cellulose I-α and I-β, and so on [1]. In constructing a theoretical model, we downscale our view into ultimate (the smallest) scale of the material, where a cellulose exists as a single fiber (one molecule). Then, a theoretical model of CNF-MF is built up as an aggrega- tion of these molecules with some crystalline alignment.
The atomic conformation of cellulose monomer is shown in Figure 1. Two identical hydrocarbon groups,
called β-D-glucoses, are linked each other and compose an unit of cellulose. Carbon (C) atoms are in six-mem- bered ring of each glucose group, but they are not in the same plane and they show a “chair-shaped” coordination. Being linked each other by common oxygen (O) atom (ester bond), glucose groups are polymerized into a large polymer.
Each molecule is interacting mainly by hydrogen bonding. Consequently, many molecules are aligned in the same direction to be packed into a crystal structure. The famous crystal model is called Meyer-Misch type, which presents three-dimensional monoclinic or triclinic crystal unit [12]. Since monomers are arranged in the “chair-shaped” configuration, as shown in Figure 1, a
long molecule seems to be naturally parallel to adjacent one, accompanied by slight displacement in longitudinal direction. However, the detailed three-dimensional struc- ture of CNF-MF has not been completely deterred mined yet.
2.2. United Atom Modeling of Cellulose Molecule
cellulose molecules.
However, as for potential function, we should rely on full version of interatomic interactions inside cellulose molecule. The well-established and reliable interaction theory and data are found in CHARMM (Chemistry at HARvard Macromolecular Mechanics) force field [15], and we can adopt it to the AA model. The detail of the AA model can be referred in [9], omitting here. The pre- sent UA model is useful because it can provide me- chanical properties of CNF and CNF-MFs which are comparable to those produced by more precise AA model. Based on the AA model of cellulose monomer shown in Figure 1, the UA model of cellulose monomer
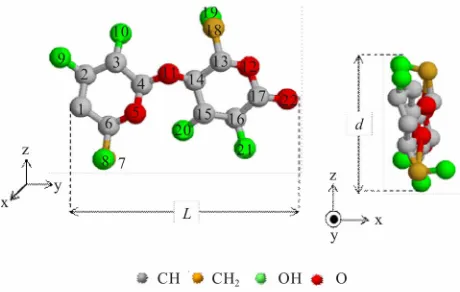
is constructed as shown in Figure 2, here. Since H atom
is relatively light weight, atomic groups, CH, CH2 and
OH, which are taking H atoms inside, are defined as a single particle as well as an O atom. Both these atomic groups and single atom are called united atom (UA). The number of UAs in the cellulose monomer is reduced to 22, from 44 in AA model. UAs are positioned at the point of center atom (C or O) of each. Geometrical pa-rameters are shown in Table 1. The potential function
and parameters for UAs are summarized in Tables 2-6,
[image:3.595.308.539.111.185.2]respectively. (These tables are including the potential function form used there.)
Figure 2. United-Atom (UA) model for cellulose molecule.
Table 1. Parameters of united atom (UA) model.
Property unit value
Length of monomer L nm 0.93
Width of monomer d nm 0.26
The number of atoms 22
The number of CH (UA) 10 The number of CH2 (UA) 2
The number of O (UA) 4
The number of OH (UA) 6
The mass of monomer kg/mol 0.320
Table 2. Stretch potential (for UA model).
Potential function form
2 0 str 21
r r K
V s ij
Pair of stretch bond r0 nm Ks kJ/nm2/mol
CH-CH, CH-CH2 0.154 3.460 × 10³
CH-O, CH2-O 0.144 3.460 × 10³
[image:3.595.309.539.213.329.2]CH-OH 0.144 3.460 × 10³
Table 3. Bending potential (for UA model).
Potential function form
2 0Bend 2 cos cos
1
K ijk V
Triplets of bending bond θ0 deg. Kθkcal/mol*) CH-CH-CH, CH-CH-CH2,
CH-CH2-CH 111.00 91.788
CH-CH-O, CH-CH2-O 110.10 107.18
CH-CH-OH,CH-CH2-OH 110.10 113.39
O-CH-O 111.50 214.08
CH-O-CH 107.50 131.93
O-CH-OH, O-CH2-OH 111.55 214.08 *)1 kcal = 4.184 × 10³ J (the same in below).
Electric charge of H is included in UA (for example, when electric charges are C = α and H = β in AA model, then the electric charge of the resulted UA (CH2) be-
comes α + 2β), so that total charge of the monomer is equivalent between AA and UA models. Note that the polarization of electric charge (electric moment) is not considered in the present model. By using this UA model, almost the same energy and conformation of monomer as the AA model is obtained in equilibrium condition.
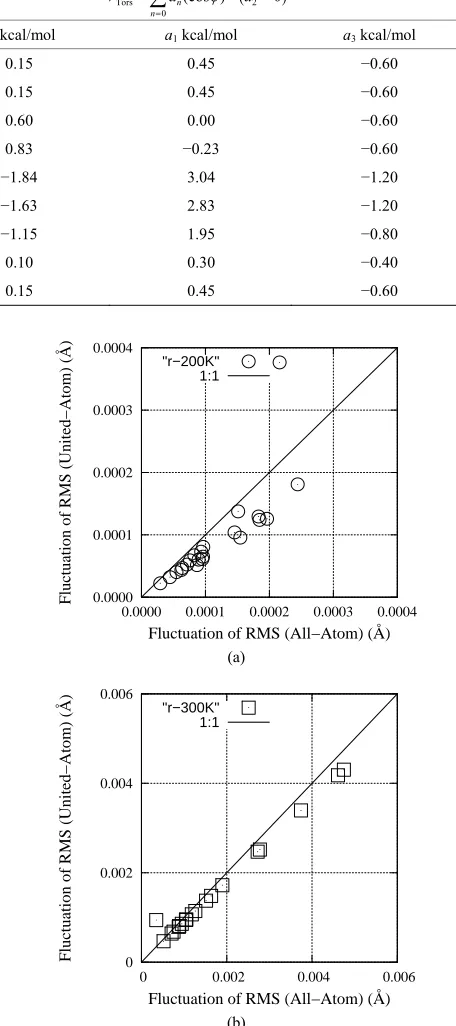
[image:3.595.57.287.410.556.2]The reason why the present UA model will be effec- tively utilized as an approximation of the AA model is that, though vibration behavior of cellulose monomer is not completely identical, but it is comparable. This is verified by normal mode analysis (NMA) performed for cellulose monomer. In NMA, by assuming harmonic vibration around the energy minimum of each atomic motion, set of eigenvalue and amplitude of atomic vibra- tion (normal modes) are calculated [16].
Figure 3 is the results of root mean square (RMS)
[image:3.595.57.287.602.736.2]Table 4. Torsion potential (for UA model).
Potential funciton form 3 (cos ) 2 0
0
Tors
a a
V n
n n
Quadruples of torsion bond a0 kcal/mol a1 kcal/mol a3 kcal/mol
CH-CH-CH-CH, CH-CH-CH2 0.15 0.45 −0.60
CH-CH-CH-O, CH2-CH-CH-O 0.15 0.45 −0.60
CH-CH-O-CH, CH2-CH-O-CH 0.60 0.00 −0.60
CH-CH-CH-OH, CH-CH-CH2-OH 0.83 −0.23 −0.60
O-CH-CH-OH, O-CH-CH2-OH −1.84 3.04 −1.20
OH-CH-CH-OH −1.63 2.83 −1.20
CH-O-CH-O −1.15 1.95 −0.80
CH-O-CH2-OH 0.10 0.30 −0.40
[image:4.595.305.533.126.639.2]O-CH-CH-O 0.15 0.45 −0.60
Table 5. Electrostatic potential (for UA model).
Potential funciton form
ij j i oul r
q q V
0 C 4
Label of UA in Figure 2 qi e**)
2, 3, 4, 14, 15, 16 0.25
6 0.20
4, 17 0.45
1 0.35
7, 18 0.25
5, 11, 12, 22 −0.50
8, 10, 19, 20, 21 −0.25
9 0.10
0.0000 0.0001 0.0002 0.0003 0.0004
0.0000 0.0001 0.0002 0.0003 0.0004
Fluctuation of RMS (United−Atom) (Å)
Fluctuation of RMS (All−Atom) (Å)
"r−200K" 1:1
(a) **)1 e = 1.602 × 10⁻¹⁹ C.
0 0.002 0.004 0.006
0 0.002 0.004 0.006
Fluctuation of RMS (United−Atom) (Å)
Fluctuation of RMS (All−Atom) (Å)
[image:4.595.57.287.307.458.2]"r−300K" 1:1 Table 6. Buckingham potential (for UA model).
Potential funciton form Buck exp 6
ij ij
r E r D
V
Pairs D kcal/mol ρ nm E kcal/mol/A6
O...O 58298.9 0.2485 192.1
O...C 42931.6 0.2755 352.8
O...H 20432.6 0.2445 98.8
C...C 31615.1 0.3025 647.8
C...H 15046.7 0.2715 181.5
2.3. Calculation Model and Condition:
Computation Model of CNF and CNF-MFs
(b)
As explained above, cellulose monomers are polymeri- zed and become a long chain structure called CNF. The polymerization in CNF is carried out by oxygen bridging with a firm covalent bond. When these CNFs aggregate, van-der-Waals and electrostatic (Coulomb) forces play an important role, though these forces produce mechani- cally weak and breakable bonding. Generally speaking, crystal alignment called Meyer-Misch structure is ob-
Figure 3. Comparison of RMS between AA and UA models. (a) 200 K. (b) 300 K.
tained [12]. The crystal shows parallelogram unit in cross section as shown in Figure 4, and its lattice constants are
[image:4.595.57.287.491.599.2]Figure 4. Meyer-Misch crystalline structure of cellulose nanofiber micro-fibrils (CNF-MFs).
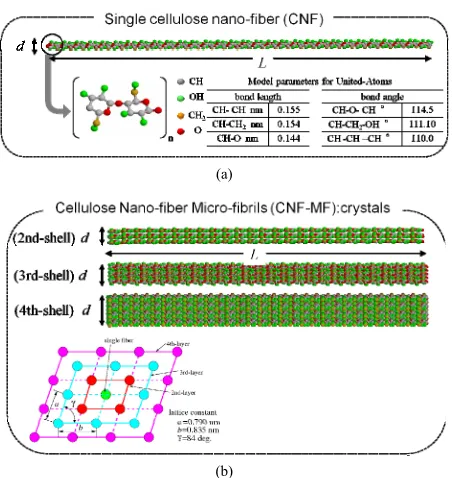
The aspect ratio (length/diameter) of CNF-MF is cho- sen around 100 in our model, so accordingly each single polymer molecule should be composed of 30 monomers. In our model, at the core of the crystal, a molecular chain is primarily placed. And then molecular chains, in 2nd-layer, 3rd-layer, ..., are sequentially located in a par- allel fashion so as to cover the centered fiber. The num- ber of molecules are 5 up to 2nd-layer, 13 up to 3rd-layer and 25 up to 4th-layer. It is true that the structural stabi- lity of CNF-MF depends on length of polymers, but our models are using the same molecular length and the pre- sent study are focusing on the effect of shell structures.
Figure 5 and Table 7 show structural parameters and
properties of computation models of CNF and CNF-MFs.
3. Results and Discussions
3.1. Structural Stability of CNF-MFs
3.1.1. Evaluation of Diffusivity by MSD
Atomic diffusivity in a molecule can be estimated from mean square displacement (MSD) of each atomic (UA) members. When molecules are moving, MSD is directly monitored from atomic displacement which is difference between the reference position and the current position , by taking into account displacement of the center of mass of the molecule as,
0i t
r
G
r
i t
r
G
t r t
0
0 2 11
MSD N i G i G i
t t t t N
r r r r
(1)where t0 is the time of origin. The MSD is directly ob-
tained from MD calculation with the condition as shown in Table 8.
According to Einstein’s law, time ratio of increase of MSD is in proportion to diffusion coefficient D [18]. That is,
molecule
1 molecule
1 1 6
N
k
D M
t N
SD (2)where Nmolecule is the number of molecules in a CNF-MF.
The result is shown in Figure 6. Plots of D in each struc-
(a)
(b)
Figure 5. Cellulose nanofiber (CNF) and micro-fibril (CNF-MF) models by United Atom method for MD.
tures can be approximated by straight line, which means that D obeys the Arrhenius relation. The linear relation is, above all, realized for single fiber. To the contrary, in the shell-structured like 2-layered or 3-layered CNF-MF, atoms in an inside molecule are restrained by forces ex-erted from atoms in surrounding molecules. Conse-quently, diffusivity of shell-structured CNF-MF is sm- aller than that of the single fiber. This means that CNF-MF is more structurally stable than single CNF fiber at the same condition.
3.1.2. Twisted Structure of CNF-MF Observed in Structural Relaxation
Here, we would like to investigate on twisted structure found in relaxed CNF-MF. Figure 7 shows structural
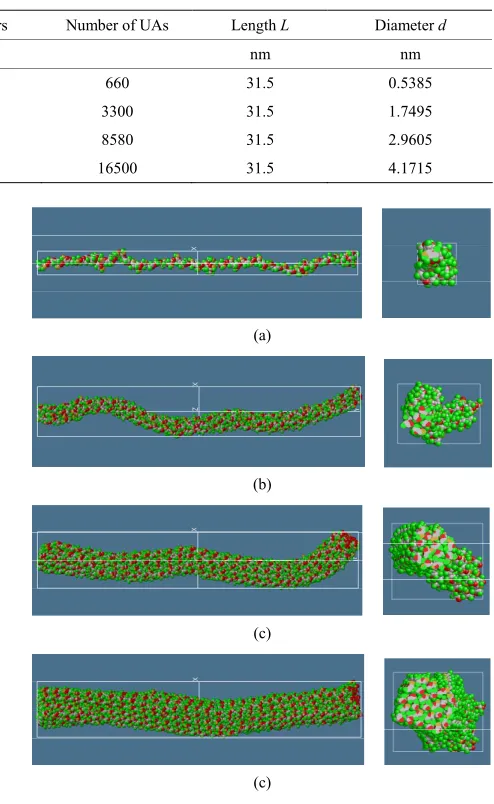
[image:5.595.62.279.93.214.2]Table 7. The structural properties of CNF fiber and CNF-MF models.
Label & Model Number of monomers Number of UAs Length L Diameter d
unit nm nm
(a) single CNF 30 660 31.5 0.5385
(b) 2 layered CNF-MF 150 3300 31.5 1.7495
(c) 3 layered CNF-MF 390 8580 31.5 2.9605
[image:6.595.57.289.234.541.2](d) 4 layered CNF-MF 750 16500 31.5 4.1715
Table 8. Calculation conditions for obtaining MSD and diff- usion simulation.
Property unit value
Time increment Δt fs 1.0
The number of steps 1 × 10⁵
Temperature T K 100.0, 200.0, 300.0, 400.0 (a)
(b)
(c)
(c)
Figure 7. Atomic and molecular configuration of CNF and CNF-MFs (after structural relaxation for 40 ps, at constant temperature of 10 Kelvin.). (a) single CNF (side view), cross-section; (b) 2-layered CNF-MF (side view), cross-sec- tion; (c) 3-layered CNF-MF (side view), cross-section; (d) 4-layered CNF-MF (side view), cross-section.
Figure 6. Diffusion coefficient of atoms (UAs) in CNF and CNF-MFs.
intermolecular force is strong between molecules. twist angle (averaged) and l is length of molecule. Fig-
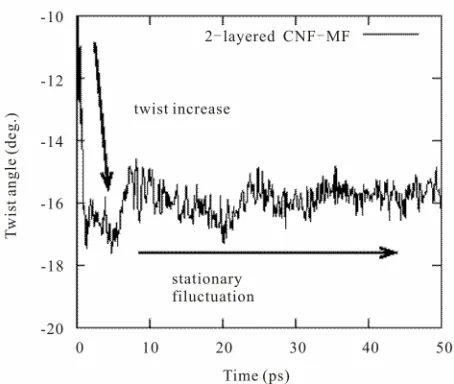
ure 8 shows the time change of θ during structural re-
laxation of the 2-layered. It shows that twist of molecules occurs in the early stage of relaxation and then that twist is retained with just a slight fluctuation.
As atomic configuration (in Figure 7) is viewed in
longitudinal direction, it is discovered that CNF-MFs are twisted from one end to another end. Although initial twist angle of molecule is zero, molecule has been col- lectively twisted and stabilized during structural relaxa- tion process. This twist is caused by finding the ener- getically lowest configuration among molecules. The to- tal twist angle averaged over all molecules is around 15 - 17 degrees, which is obtained by accumulating atomic twist angle at every glycosidic (glucose-O-glucose) bond. The specific twist angle θ’ = θ/l comes to be approxima- tely 0.5 degree per 1 nm of molecule, where θ is total
3.2. Mechanical Behavior of CNF-MF
3.2.1. Fiber Drawing Test for CNF-MF Models
Figure 8. Time transition of twist angle of CNF-MF during relaxation (2-layered CNF-MF).
in reference to an existing material testing where an ac- tual fiber (such as cotton fiber with diameter of several micrometers) is extracted from a woven textile sheet [19].
The detail of the present drawing test is as follows. As shown in Figure 9, a single cellulose molecular fiber is
drawn out of shell-structured CNF-MF. The moving ve- locity of atoms in the end region of the fiber, which are located within the length of one monomer of cellulose, is all constrained to be v = 175 m/s. On the other hand, at- oms in the other end region of the rest of CNF-MF structure are totally fixed in the space (i.e.v = 0 m/s). For example, in the case of 2-layered CNF-MF, only the centered molecule is to be pulled out of other four mo- lecular fibers. The move velocity in MD simulation is quite high compared with usual experiment, technically because the simulation is intended to be carried out in very short duration. Therefore, the dependency on draw- ing velocity is still interesting and is left for further re- search. Drawing tests for 2-, 3- and 4-layered CNF-MFs are conducted. The calculation parameters are summa- rized in Table 9.
[image:7.595.59.286.95.287.2]We would like to mention the reason why this type of testing is chosen here. Any molecular fiber never gets broken in stretching along fiber direction because in- tra-molecular potentials for stretching, bending and tor- sion are all made not to be broken in the present model. However, dissociation of molecules would occur easily in the lateral direction of CNF-MF, where hydrogen bonding, i.e. intermolecular potential, is responsible for molecular aggregation. Certainly, other behavior con- cerning fibrous material, such as tearing test of fibers into small pieces, may be interesting, but, as a mechani- cally simple testing, fiber drawing test is adopted here.
Figure 9. Schematic of fiber drawing test: a single CNF fiber is pulled out of a CNF-MF structure.
Table 9. Values for fiber drawing simulation of CNF-MFs.
Property unit value
Velocity v m/s 175.0
Temperature T K 10.0
Time increment Δt fs 1.0
Total steps 2 × 10⁵
3.2.2. Result of Fiber Drawing Test
Figure 10 shows examples of snapshots in the fiber dra-
wing test for 2-layered CNF-MF. Before pulling the cen- tered fiber, the CNF-MF structure has already curved. Pulling starts, whereas the centered fiber does not imme- diately come out of the CNF-MF shell until it regains an original straight shape. The centered fiber is stretched for the time being; finally it begins to be pulled out. The rest of fibers in the CNF-MF keep shell structure (a hollow shell is manufactured).
It is found that, while the centered fiber is being pulled, twist angle observed between monomers reduces from the equilibrium angle. Figure 11 shows the magnitude of
the change of twist angle during drawing test. As con- firmed, increase of angle is observed until the centered fiber has completely pulled out. In fact, this increase oc- curs so as to reduce equilibrium twist angle.
This fact suggests an interesting behavior of CNF-MF in loading. A certain twist angle is necessary for molecu- lar fibers to be packed themselves and the twist is “stored” inside CNF-MF structure in equilibrium condi- tion. But, when tensile force is applied to just one fiber to pull out the fiber out of the structure, the drawn fiber goes out of remaining shell structure, adjusting the twist of the structure.
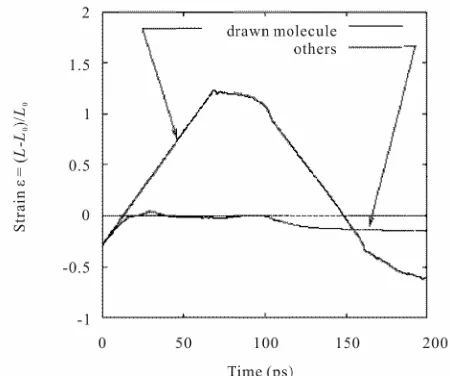
Figure 12 shows stretch of the drawn fiber. Strain of
[image:7.595.307.538.317.397.2]Figure 10. General conformation change of CNF-MF dur-ing fiber drawdur-ing process (2-layered CNF-MF model).
Figure 11. Transition of twist angle of single fiber during drawing test.
as for longitudinal component, by
fibril
1
0 fibril
1
1 A , 1 N Bi
A B
m A
l l
l N
0 Bi l
(3)
where lA and lBi are fiber lengths during drawing test, lA0
and lBi0 are those before relaxation, and Nfibril means the
number of molecules in shell (s). After the system is equilibrated, molecular fibers has already shrunk slightly. As found in Figure 12, strain εA is completely in propor-
tion to the distance moved by the end region of the drawn fiber. It is understood that friction force between the center and others acts as resistance of dissociation mo- tion. The energy of friction (as strain energy) is given by both elasticity of the drawn fiber and molecular interac- tion between fibers. On the other hand, the strain of fi-
Figure 12. Elongation of CNFs (drawn fiber and others, 2-layered model).
bers in outer shell is less than 0, which means that those remaining fibers do not stretch themselves but preserve their stable length.
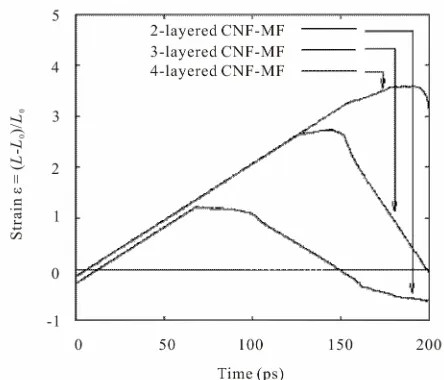
Comparison of elongation of fiber between 2-, 3- and 4-layered CNF-MFs is shown in Figure 13. When the
number of supporting fibers in shell structures is larger, the structure becomes more stable. The graph also shows that ratio of elongation to the displacement is almost the same for all models before extraction completes. The maximum elongation is found in 4-layered CNF-MF.
The Cauchy stress is straightforwardly defined as force vector divided by its cross-section at an arbitrary body surface [20]. In the present drawing test, the tensile force
Fα can be directly collected from atoms in the drawn
molecule, and then the normal component of Cauchy stress σαα is calculated by
1
, N i
i
F F F
A
(4)where A is area of the cross-section. As for CNF-MF, A
is estimated as an area occupied by the crystal unit as shown in Figure 4. Figure 14 shows the averaged stress
during drawing test. As naturally predicted, the order of maximum stress is like: (2-layered) < (3-layered) < (4-layered). It is guessed that longitudinal stiffness of the drawn fiber is identical, but total friction force between fibers is augmented in larger CNF-MFs. This result re- veals that increase of the number of shell structures leads to larger resistance to separation of a single fiber from CNF-MF structure.
4. Conclusions
[image:8.595.59.284.319.502.2]Figure 13. Elongation of CNF fiber during drawing test (comparison between 2-, 3- and 4-layered models).
Figure 14. Averaged stress in CNF-MF during fiber draw-ing test (comparison between 2-, 3- and 4-layered models).
molecular dynamics (MD) with united atom (UA) mod- eling. In particular, unique mechanical testing where the single fiber is drawn out from CNF micro-fibril (CN- F-MF) is conducted and the mechanical response is ob- served. The following results are obtained.
1) By utilizing UA method, molecular chain model of CNF structure is made from polymerization of cellulose monomers. Potential parameters of UA are derived from all-atom (AA) model and the MD calculation can be car- ried out. This UA model is verified as for vibrating mo- tion by normal mode analysis of monomers.
2) Atomic diffusion in CNF fiber and CNF-MF is basi- cally obeys Arrhenius relation. At high temperature, the diffusion coefficient of multi-layered CNF-MF reaches that of single CNF fiber.
3) CNF-MF preserves equilibrium structure with a ce- rtain twist angle (estimation is around 16 degrees, which is accumulated at every glycoside bond).
4) In fiber drawing test, where one CNF fiber is pulled out from CNF-MF structure, the equilibrium twist angle cancels. The friction between the drawn fiber and others is large. Therefore, the larger the number of shell struc- tures is, the larger the stretch and the stress of drawn fi- ber are.
5. Acknowledgements
This study is partly supported by the “Strategic Project to Support the Formation of Research Bases at Private Universities: Matching Fund Subsidy from MEXT (Min- istry of Education, Culture, Sports, Science and Tech- nology) (2012-2013)”.
REFERENCES
[1] D. Klemm, H. P. Schmauder and T. Heinze, “Cellulose,” In: S. De Baets, E. Vandamme and A. Steinbüchel, Eds.,
Biopolymers, Vol. 6, Wiley-VCH, Weinheim, 2001, pp. 275-287.
[2] Cellulose Gakkai, “Cellulose no Jiten,” (in Japanese) Asakura Syoten, Tokyo, 2000. pp. 219-253.
[3] M. Nogi, S. Iwamoto, A. N. Nakagaito and H. Yano, “Optically Transparent Nanofiber Paper,” Advanced Ma- terials, Vol. 21, No. 16, 2009, pp. 1595-1598.
doi:10.1002/adma.200803174
[4] T. Nishino, I. Matsuda and K. Hirao, “All-Cellulose Composite,” Macromolecules, Vol. 37, No. 20, 2004, pp. 7683-7687. doi:10.1021/ma049300h
[5] J. Buehler, “Nanomechanics of Collagen Fibrils under Varying Coss-Link,” Journal of the Mechanical Behavior of Biomedical Materials, Vol. 1, No. 1, 2008, pp. 59-67. doi:10.1016/j.jmbbm.2007.04.001
[6] Q. Pu, Y. Leng, L. Tsetseris, H. S. Park, S. T. Pantelides and P. T. Cummings, “Molecular Dynamics Simulations of Stretched Gold Nanowires: The Relative Utility of Dif- ferent Semiempirical Potentials,” Journal of Chemical Physics, Vol. 126, No. 14, 2007, Article ID. 144707. doi:10.1063/1.2717162
[7] L. Hui and F. Pederiva, “Helical Multishell Structures of Magnesium Nanowires,”Journal of Applied Physics, Vol. 96, No. 4, 2004, pp. 2214-2220. doi:10.1063/1.1765866 [8] D. Li, Y. Wu, P. Kim, L. Shi, P. Yang and A. Majumdar,
“Thermal Conductivity of Individual Silicon Nanowires,”
Applied Physics Letters, Vol. 83, No. 14, 2003, pp. 2934- 2396. doi:10.1063/1.1616981
[9] S. Neyertz, A. Pizzi, A. Merlin, B. Maigret, D. Brown and X. Deglise, “A New All-Atom Force Field for Crys- talline Cellulose I,” Journal of Applied Polymer Science, Vol. 78, No. 11, 2000, pp.1939-1946.
doi:10.1063/1.468791
W. Torget, J. Sugiyama, M. E. Himmel and J. W. Brady, “Computer Simulation Studies of Microcrystalline Cellu- lose I,” Carbohydrate Research, Vol. 341, No. 1, 2006, pp. 138-152. doi:10.1016/j.carres.2005.09.028
[11] H. Miyamoto, M. Umemura, T. Aoyagi, C. Yamane, K. Ueda and K. Takahashi, “Structural Reorganization of Molecular Sheets Derived from Cellulose II by Molecular Dynamics Simulations,” Carbohydrate Research, Vol. 344, No. 9, 2009, pp. 1085-1094.
doi:10.1016/j.carres.2009.03.014
[12] K. H. Meyer and L. Misch, “Positions des Atomes Dans le Nouveau Modèle Spatial de la Cellulose,” Helvetica Chimica Acta, Vol. 20, No. 1, 1937, pp. 232-244. doi:10.1002/hlca.19370200134
[13] H. Fukunaga, J. Takimoto and M. Doi, “A Coarse-Grain- ing Procedure for Flexible Polymer Chains with Bond- edand Nonbonded Interactions,” Journal of Chemical Physics, Vol. 116, No. 18, 2002, pp. 8183-8190.
doi:10.1063/1.1469609
[14] T. Kinjo and S. Hyodo, “Equation of Motion for Coar- se-Grained Simulation Based on Microscopic Descrip- tion,” Physical Review E, Vol. 75, No. 5, 2007, pp. 1-9. doi:10.1103/PhysRevE.75.051109
[15] “CHARMM force field” http://www.charmm.org/
[16] D. A. Pearlman, D. A. Case, J. W. Caldwell, W. S. Ross, T. E. Cheatham III, S. DeBolt, D. Ferguson, G. Seibel and P, Kollman, “AMBER, a Package of Computer Pro- grams for Applying Molecular Mechanics, Normal Mode Analysis, Molecular Dynamics and Free Energy Calcula- tions to Simulate the Structural and Energetic Properties of Molecules,” Computer Physics Communications,Vol. 91, No. 1-3, 1995, pp. 1-41.
doi:10.1016/0010-4655(95)00041-D
[17] J. Sugiyama, “Crystal Structure of Cellulose-Personal Overview of the Main Stream Idea,” Sen’i Gakkaishi, (in Japanese) Vol. 62, No. 7, 2006, pp. 183-187.
doi:10.2115/fiber.62.P_183
[18] M. P. Allen and D. J. Tildesley, “Computer Simulation of Liquids,” Oxford University Press, Oxford, 1989. [19] M. Valizadeh, S. A. H. Ravandi, M. Salimi and M. Sheik-
hzadeh, “Determination of Internal Mechanical Charac- teristics of Woven Fabrics Using the Force-balance Analysis of Yarn Pullout Test,” Journal of the Textle In- stitute, Vol. 99, No. 1, 2008, pp. 47-55.
doi:10.1080/00405000701567712