Study on the Spatial Pattern of Commercial Area, Based
on the Energy Electrical Distribution
Singgih Hartanto*, Soegiono Soetomo**, Broto Sunaryo**, Wisnu Pradoto**
*
Post Graduate Student, Architecture and Urban Planning Departement, Diponegoro University, Semarang Email: [email protected]
**
Urban and Regional Planning Departement,Diponegoro University
Abstract- Urban pattern describes the "pattern" and representing the spatial characteristic of the urban area. Whereas efficiency energy was one of the hottest topics related to spatial pattern. This paper presents a study about the correlation between urban pattern and distribution of electrical energy. The aim of this research is to find out the patterns of urban space that can provide efficiency in electrical energy distribution. The research method used quantitative positivist approach, while the data collection used Geographic Information System (GIS). As object of study is commercial area around Semarang city square. There are four steps analysis i.e. electric transient and analysis program to calculate losses value, nearest neighbor analysis to determine the spatial patterns, ordinary least square to determine the relationship among variables and hot spot analysis to determine the optimum distance of spatial pattern. Based on the analysis, the most suitable spatial pattern to create the most efficient in electrical distribution in commercial area was cluster. The maximum distance for each activity was 146 m for shopping complex, 165 m for trade and service area and 358 m for hotel and supermarket. In addition, to create efficiency in electrical distribution in commercial area, the proportion of business area must be higher than other areas. Then followed by shopping complex and for the last was hotel and supermarket.
Keywords :Commercial area, electrical distribution, losses, spatial pattern, urban pattern
I. INTRODUCTION
rban pattern describes a “pattern”, representing the spatial characteristic of the urban area at a certain time and also a “process”, indicating the spatial change over time [1]. Furthermore, Lu et al., [1] said that social, economic, or cultural aspect closely linked to the forming of urban patter.
Energy become a crucial topic in the urban pattern as relates to established factors (economic, social and cultural). It is known that energy consumption spread globally and concentrated in urban areas, where more than 65%-80% of the energy absorbed by urban activities, and for developing countries, energy resources still depend on the fossil fuels [2] [3]. Wolpeand Reddy [4],also said that the transport sector, made up of passenger and commercial/industrial transport, dominatesurban energy consumption, arround 60–70% of total energy.
Term of planning in uban space planning in Indonesia only based on the needs of spaceallocation. Whereas, the other aspects such as energy consumption have not been integrated in the city planning, therefore the aspects of energy efficiency in the city scale are difficult to achieve.
Energy usage pattern and the potential for optimization vary depending on urban sectors and it demands modelling[5]. Thus at the highest level into domestic, commercial, industrial, and transport sector with a number of further subdivision possible within each sector to indicate specific activities and user types.
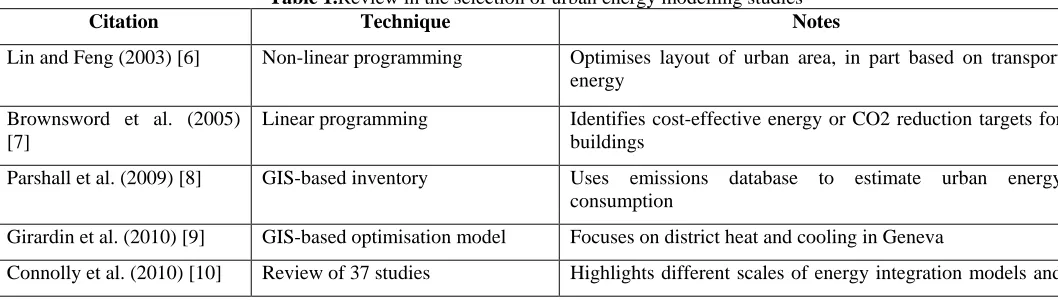
[image:1.612.38.567.589.739.2]This diversity poses a significant problem for policy-relevant urban energy modelling. A few studies of this kind, illustrating both the range of applications and the often significant data requirements or technical expertise required to use each model.
Table 1.Review in the selection of urban energy modelling studies
Citation Technique Notes
Lin and Feng (2003) [6] Non-linear programming Optimises layout of urban area, in part based on transport energy
Brownsword et al. (2005) [7]
Linear programming Identifies cost-effective energy or CO2 reduction targets for buildings
Parshall et al. (2009) [8] GIS-based inventory Uses emissions database to estimate urban energy consumption
Girardin et al. (2010) [9] GIS-based optimisation model Focuses on district heat and cooling in Geneva
Citation Technique Notes
difficulty identifying an all-purpose `ideal' model.
Keirstead (2010) [11] Integrated modelling of urban energy systems
Bring together state-of-the-art optimisation and simulation models so that urban energy use at different stages of a city's design can be examined within a single platform.
It has been argued that more dense development is likely to result in more energy-efficient and sustainable cities [12]. However Jenk dan Burgess [12], also said that compact city cant be done step by step and difficult to applied in developing countries. This is because the density in the cities in developing contries still being debated. However, very little is known about the precise magnitude of possible energy savings from more compact urban form.
Contemporary compact city approaches have become one form of achieving ‘sustainable urban development’, but that is not to say that they are coterminous with it [12]. Furthermore, there have been a number of attempts to define and clarify the concept of the compact city and its relationship to sustainable urban development, there remain questions over what should be the principal spatial point of reference in undertaking compaction [12].
Related to electrical energy efficiency, the main problem in the electrical energy is losses [13]. Furthermore, according to Ibrahim [13], losses in the system of electrical power is one of measured parameter to find out whereas the operation of power system efficient or not. The occurrence of losses also have an impact on the increase in energy consumption, that means will further increase CO2 emissi [14]. To obtain an efficient condition, the value of losses should be reduced as low as possible.
Up to date, the indicators of losses only seen based on the length of electrical network, conductors, connectors, substations, over load , load balance, voltage and power factor [13]. There are no research that studied a contributions of urban space toward losses indicator. It become a question, whether the pattern of urban space can contribute in the efficiency of electrical energy?
[image:2.612.39.569.56.136.2]Based on the previous studies, it is known that studies on the spatial aspect of urban pattern has been done. Some of them can be seen in the table 2.
Table 2. Previous studien in urban pattern
Citation Result of research
Ourng dan Rodrigues
(2012) [15]
Identify the pattern of urban growth from 1993 to 2011 in Siem reap town, Cambodia. Result shows the
development of core settlement areas in Siem Reap revealed to be concentrated along main roads and along the river in the past and still keeping the same trend in the present.Ma et al. (2008) [16] Developed research on the urban sprawl pattern in the mining area, a case study on Sunan, China. The research denoted that Sunan’s urban cluster are becoming more and more homogenous and compact and are growing along the transportation axes.
Savaranan et al. (2010) [17]
Introduced visualization approach with the help of city model-Monocentric to identify the urban sprawl pattern in Maduarai region, India. he result showed that the pattern of urban sprawl of Maduarai is identified as linear along the major roads.
Alabi (2009) [18] Measured the urban sprawl pattern in Lokoja, Nigeria. The aim of study was to measure the behaviour of sprawl. The measurement of entropy is derived based on the two location factors, distance from roads and distance from the town center to reveal and capture spatial patterns of urban sprawl. The results showed that Lokoja is experienced grow along the major highways.
Huiping et al. (2005) [19]
Proposed the study on developing urban growth prediction from spatial indicators based on multi-temporal images. The aim of the research was to detect the spatial distribution of land use and spatio-temporal pattern over the years. The resultf was integrating land use/land cover pattern with multivariate spatial model to estimate the spatial distribution of future urban expansion.
Huynh et al. ( 2016) [20]
Study the spatial pattern of cities across the globe by analysing the distribution of public transportpoints within the cities. Theanalysis reveals that different spatial distributions of points could be classified into four groups with distinct features, indicating whether the points are clustered, dispersed orregularly distributed. Furthermore,the results provide evidence for the existence of two different types of urban system: well-planned and organically grown.
Wegener dan Kuzman (1996) [21]
In spatial terms the growth of the modern city is linked to the spread of industrialisation across the continent.
Wei dan Jiang (2013) [22]
Citation Result of research
important attractors and producers of both personal and freight traffic. Feitosa et al. (2005)
[25]
Segregation measures can be regarded as useful tools for analyzing the spatial distribution of socially vulnerable families in urban areas. Using alternative spatial segregation measures, global and local, for the identification of familiesunder a socially vulnerable condition established by the combination of poverty and segregation.
Based on the review results in table 2, it is known that there has been no research that studied topic of urban pattern and efficiency in distribution of electrical energy. Therefore, we conducted a research to find out the patterns of urban space that can provide efficiency in electrical energy distribution.
II. RESEARCH METHOD AND DATA
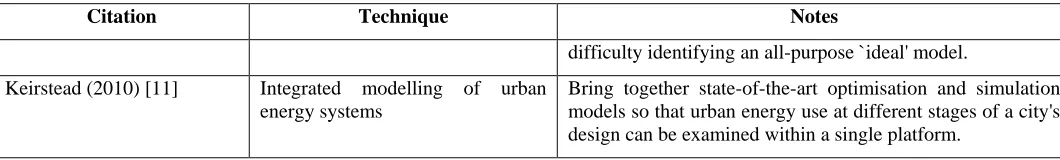
In this research, we used quantitative positivist approach. As object study is commercial sectors in the area of Semarang city square, Semarang city, Indonesia, can be seen infigure 1.
Figure 1.a). Location of Object Study-Area of Semarang City Square (Source : https://maps.google.com); b). Measurement
instrument- Global Positioning System (GPS); c). Substation
Research data devided into primary data and secondary data. The primary data were the distance between the object of study to the city squere substation in Gajah Mada street. A step-down substation 150kV/20kV, the total power capacity is 120 MVA with 2 transformers. Each transformer is 60 MVA, consists of 13 feeders that supply center of Semarang region that dominated with central business district. While the secondary data were the data of electrical load in 2016. Data were collected using a Global Positioning System (GPS). Therea are three variables used in this study :
1. Independent variable : spatial urban pattern, position of substation. 2. Dependent variable : losses
3. Control variable : distance, load of electrical energy consumption. Whereas data analysis devided into four steps, i.e. :
a. Losses calculation using Electric Transient and Analysis Program (ETAP). The calculation of lossescan be seen in % (percen). Geographic Information System (GIS systems) can provide good information that can be beneficial in evaluating when and where losses were occured.The bigger losses value, the more inefficient.
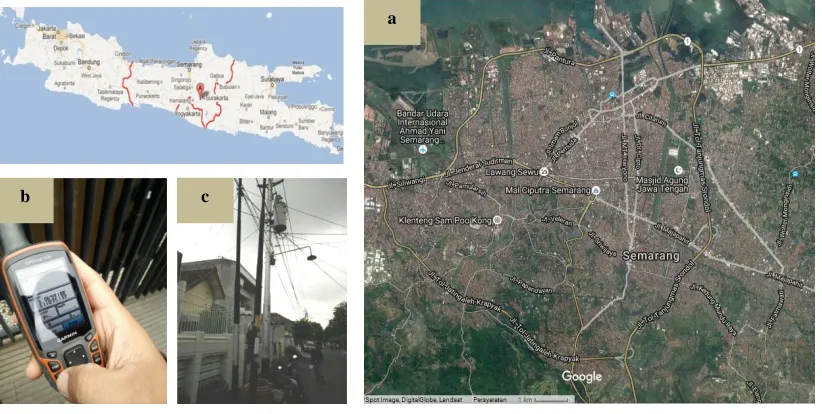
b. As for the spatial analysis used Nearest Neighbor analysis whichdisplays the distribution pattern of space location based on the calculation of distance, number of point location and region. The results of Nearest Neighbor analysis are Z-Score and P-Value, indicating whether the area cluster, random or dispersed [26]. There are three standart of Nearest Neighbor analysis, i.e. :
Nearest Neighbor analysis result 1: spatial pattern random.
Nearest Neighbor analysis result < 1 spatial pattern cluster.
Nearest Neighbor analysis result > 1 spatial pattern dispersed
The Area Of Semarang City Squere
a
[image:3.612.99.510.242.449.2]Figure 2 : Simulation Nearest Neighbor analysis
c. Hot spot analysis based on the Block and Block [27]. Before performing the hot-spot analysis, we used “distance band”as analysis parameter. Distance band will determine how losses grouped based on the similarities and closeness. Using “Calculate Distance Band from Neighbor Count”, searching in every activity calculated maximum distance limit. Value of distance band will be included in the spatial autocorrelation. Calculation of spatial autocorrelation needs initial of distance value and interval of distance. Initial of distance value was obtained from maximum value calculated in the “distance band”, whereas interval of distance was obtained from observed mean distance (nearest neighbor analysis). Based on the spatial autocorrelation analysis will be obtained peak of Z-score in the certain distance for hot spot analysis.
d. Ordinary Least Square (OLS) analysis was the first right step for all spatial regression analysis [28] [29] [30] [31]. Ordinary Least Square (OLS) analysis provided overall of variable model to understand or predicted and created regression equation. In the Ordinary Least Square (OLS) analysis also describe a correlation between dependent and independent variable. In this analysis we were searching the correlation between losses and Z-score. If scaterplot diagram from left rise to the top right, then the model has a strong positive relationship. In case scaterplot diagram from left down to the top right, then the model has a strong negative relationship. However, if the line diagrams tend to approach the straight lines and the observation object randomly stay away from the line, it shows no correlation between variables.
Figure 3 : Ordinary Least Square analysis, scaterplot diagram
III. RESULT AND ANALYSIS
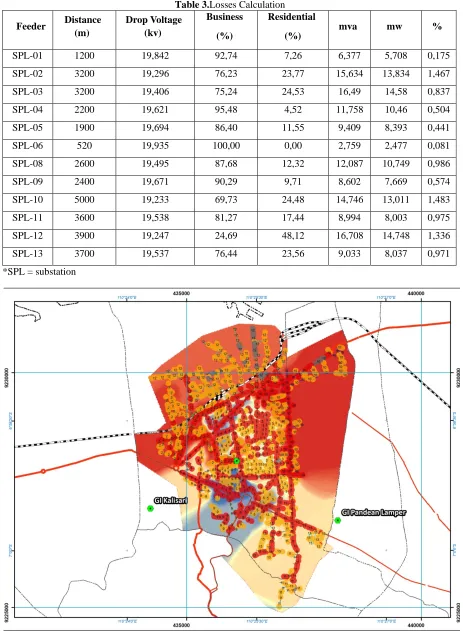
[image:4.612.106.514.490.602.2]Table 3.Losses Calculation
Feeder Distance
(m)
Drop Voltage (kv)
Business
(%)
Residential
(%)
mva mw %
SPL-01 1200 19,842 92,74 7,26 6,377 5,708 0,175
SPL-02 3200 19,296 76,23 23,77 15,634 13,834 1,467
SPL-03 3200 19,406 75,24 24,53 16,49 14,58 0,837
SPL-04 2200 19,621 95,48 4,52 11,758 10,46 0,504
SPL-05 1900 19,694 86,40 11,55 9,409 8,393 0,441
SPL-06 520 19,935 100,00 0,00 2,759 2,477 0,081
SPL-08 2600 19,495 87,68 12,32 12,087 10,749 0,986
SPL-09 2400 19,671 90,29 9,71 8,602 7,669 0,574
SPL-10 5000 19,233 69,73 24,48 14,746 13,011 1,483
SPL-11 3600 19,538 81,27 17,44 8,994 8,003 0,975
SPL-12 3900 19,247 24,69 48,12 16,708 14,748 1,336
SPL-13 3700 19,537 76,44 23,56 9,033 8,037 0,971
*SPL = substation
Based on the losses calculation, areas with high density have higher losses than areas with low density, can be seen in figure 4. This is because the percentage of residential area higher than commercial area. In other word, the percentage of land use will influence the losses calculation.
Then, in table 3 can be seen that SPL 1 has lowest losses percentage and SPL 2 has highest losses percentage. Eventhough SPL 10 has highest losses percentage, but its residential percentage is the lowest than SPL 2. Therefore, for analysis we choose SPL 1 and SPL 2.
In spatial calculation of SPL 1 and SPL 2, we were identified type of activities and spacious of service area. Because of SPL 1 and SPL 2 included in the area with lowest and highest losses, then it needed to deeper identify related to its spatial forming. In the identify of activity, we used area of shopping complex, trade and service area, and also hotel and supermarket area. The activities in this area related to the function of SPL1 and SPL 2 where as commercial area in Semarang City.
3.1. Ordinary Least Square (OLS) Analysis
In the ordinary least square (OLS) analysis, we used the following formula :
Y = a + b1x1 + b2x2 + b3x3 + b4x4
Y = 41.499921 + 0.019742 x1 + 0.000030 x2 + 0.000060 x3-2.075053 x4
Nomenclature: a = Intercept b1 = Coefficient x1 b2 = Coefficient x2 b3 = Coefficient x3 b4 = Coefficient x4 x1 = Z-Score variable x2 = Load variable x3 = Distance variable x4 = Voltage variable
If value of varian inflation factorin (VTF) model showed 7.5 or more, thenthere is one or more variable that discuss similiar thing. It was causing biased model, therefore needed to erase one by one the variables which have bigger value. The result in ordinary least squaremodel, the value of varian inflation factorin can be seen between 1 - 1,3. It showed that the value of variable under the value of varian inflation factorinand and can be used.
Probability [b] and Robust_Pr [b] showed statistically significant coefficient. Star mark in the probability means the variables significant toward model. Eventhough there is no star mark in load variabel, but there is positive correlation that influenced losses.
Adjusted R-squared was 0-1 and indicated how many independent variables was expladaned by dependent variables. The result of adjusted R-squered was 0.894766 showed that percentage of model losses correlationwas 89%.
3.2. Average nearest neighbor analysis in SPL 1
[image:7.612.51.560.527.617.2]The following were the results of Average Nearest Neighbor analysis in SPL 1.
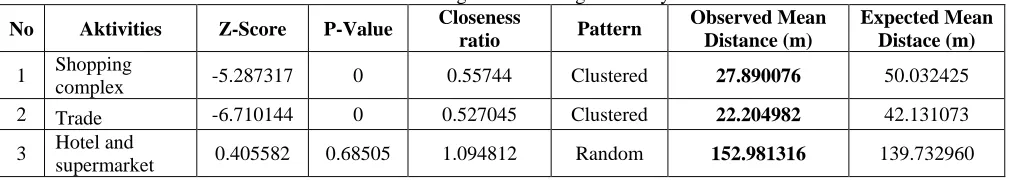
Table 4.Results of Average Nearest Neighbor analysis in SPL 1
No Aktivities Z-Score P-Value Closeness
ratio Pattern
Observed Mean Distance (m)
Expected Mean Distace (m)
1 Shopping
complex -5.287317 0 0.55744 Clustered 27.890076 50.032425 2 Trade -6.710144 0 0.527045 Clustered 22.204982 42.131073
3 Hotel and
supermarket 0.405582 0.68505 1.094812 Random 152.981316 139.732960
Based on the analysis results in table 4:
a. Shopping complex : z-score in this area was --5.287317, the results was lower than critival value -2.58 that mean the pattern was cluster. However based on the analysis, P-value was 0 that means impossible the characteristic of spatial pattern was random.
b. Trade and service area : z-score in this area was -6.710144 lower than critival value -2.58. The result of spatial pattern was cluster and P-value was 0 thatmeans impossible the characteristic of spatial pattern was random..
c. Hotel and supermarket: z-score in this area was 0.405582 and occured in the range of critivalvalue -1.65–1.65. Result of P-value was 0 and spatial pattern possibility was random.
Table 5.Results ofdistance band analysis in SPL 1
No Aktivities Minimum Distance (m) Average Distance (m) Maximum Distance (m)
1 Shopping complex 0 27.89007553 118.4906907
2 Trade 0 22.20498181 76.90166687
3 Hotel and
supermarket 53.39572612 152.9813156 358.0480576
The following is the result of spatial autocorrelation analysis and in the table 6 is the result of distance calculation. a. Shopping complex
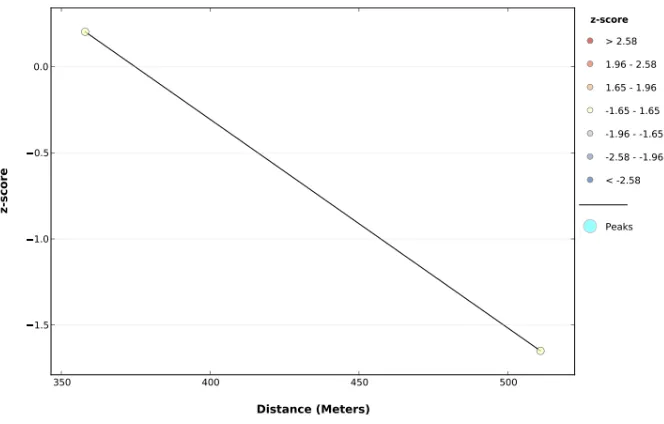
Based on the figure 5, the highest z-score occured at 146 m. Afterward, when the distance was at 150 and then increase, the spatial pattern tend to show random pattern.
b. Trade and service area
Whereas, in trade and service area, the highest z-score occured at 165 m and more then 165 m, the spatial pattern tend to show random pattern. Can be seen in figure 6.
c. Hotel and supermarket
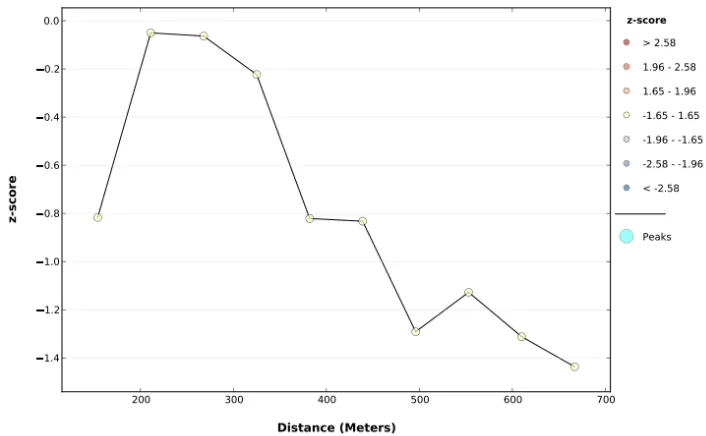
[image:8.612.75.535.292.610.2]Generally, the spatial pattern of mall and supermarket was random. Based on the spatial analysis, the highest z-score occured at 385 m and the graphic will decrease when the distance more than 385 m. That means the spatial pattern will more random. Can be seen in figure 7.
Table 6.The result of distance calculation in spatial autocorrelation analysis in SPL 1
No Aktivities Beginning Distance (m) Distance Increment (m) Peak Distance (m)
1 Shopping
complex 118 28 146
2 Trade 77 22 165
3 Hotel and
supermarket 358 153 358
Figure 6. Spatial autocorrelation analysis in trade and service area (SPL 1)
Figure 7. Spatial autocorrelation analysis in hotel and supemarket (SPL 1)
In spatial autocorrelation, the graph will generateline between distance and z-score. It reprented the intensity of spatial grouping and the peak of significant z-score that showed the distance where the most prominent spatialgrouping.
Based on the spatial autocorrelation analysis, in commercial area, the most effisien spatial pattern is cluster with detail in each distance as following :
Shopping complex : maximum distance 146 m.
Trade and service area : maximum distance 165 m.
Hotel and supermarket : maximum distance 358 m.
When the electrical distributions exceed from maximum distance, the possibility of higher losses will happen.
3.3. Average nearest neighbor analysis in SPL 2
For getting a better result, spatial analysis in SPL 2 was conducted as comparison of area that has higher losses. The following were the results of Average Nearest Neighbor analysis in SPL 2.
Based on the Average Nearest Neighbor analysis in table 7 i.e. : a. Shopping complex :
[image:9.612.138.470.308.520.2]b. Trade and service area :
Whereas in this area, z-score calculation was -2.010616 and same as shopping complex i.e. lower than critival value -2.58. The spatial pattern was clusterbut still possible to create random style because p-value was 0.044366.
c. Hotel and supermarket :
[image:10.612.62.547.146.238.2]Different with other, z-score calculation in this area was -0.398016 and the critical value between -1.65-1.65. Result in spatial pattern was random. Because p-value was 0.690619, the possibility of spatial pattern was in random style.
Table 7.Results of Average Nearest Neighbor analysis in SPL 2
No Aktivities Z-Score P-Value Closeness
ratio Pattern
Observed Mean Distance (m)
Expected Mean Distace (m)
1 Shopping
complex -5.206594 0 0.574959 Clustered 57.174215 99.440526 2 Trade -2.010616 0.044366 0.775928 Clustered 105.333284 135.751301
3 Hotel and
supermarket -0.398016 0.690619 0.906957 Random 258.259897 284.754330
The following was the result of distance band calculation in SPL 2.
Table8.The result of distance calculation in spatial autocorrelation analysis in SPL 2
No Aktivities Minimum Distance (m) Average Distance (m) Maximum Distance (m)
1 Shopping complex 12.36931688 57.17421485 153.7595525
2 Trade 46.87216658 105.3332838 369.2830892
3 Hotel and supermarket 187 258.2598974 362.3603179
a. Shopping complex
Based on the figure 8, the highest z-score occured at 211 m. Afterward, when the distance was at 150 and then increase, the graph wil decrease and the spatial pattern tend to show random pattern.
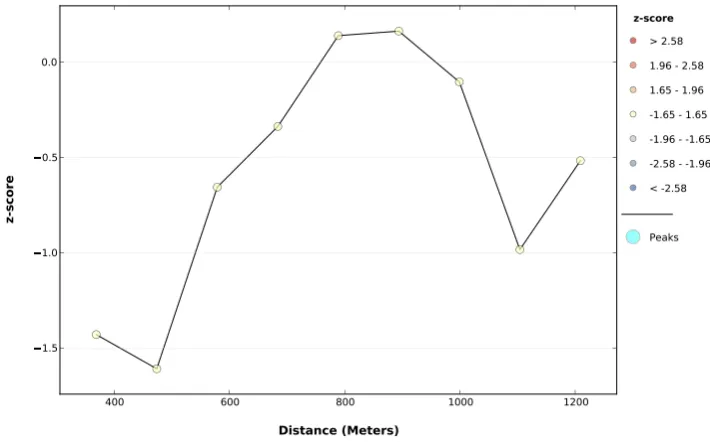
b. Trade and service area
While, in trade and service area, the highest z-score occured at894 m and more then 900 m, the spatial pattern tend to show random pattern, can be seen in figure 9.
c. Hotel and supermarket
[image:10.612.122.475.477.695.2]Figure 9. Spatial autocorrelation analysis in trade and service area (SPL 2)
Figure 10. Spatial autocorrelation analysis in hotel and supemarket (SPL 2)
Table9.The result of distance calculation in spatial autocorrelation analysis in SPL 2
No Activities Beginning Distance (m) Distance Increment (m) Peak Distance (m)
1 Shopping
complex 154 57 211
2 Trade 369 105 894
3 Hotel and
supermarket 362 258 630
Table 9 shows the result of spatial autocorrelation analysis in SPL 2.The most effisien spatial pattern for commercial area such as
SPL 2 was cluster with detail in each distance as following :
Trade and service area : maximum distance 894 m.
Hotel and supermarket : maximum distance 630 m.
If the electrical distributions exceed from maximum distance, the possibility of higher losses will happen.
Later on, after the result in SPL 1 and SPL 2 compared, an be seen in table 10, we can see that SPL 1 with higher business percentage was more efficient in electrical distribution. The structure of business area tend to compact with shorter distances among the electrical consumer.
[image:12.612.85.532.168.261.2]Therefore, to create efficiency in electrical distribution in commercial area, the proportion of business area must be higher than other areas. Then followed by shopping complex and for the last was hotel and supermarket.
Table 10.Comparing result in SPL 1 and SPL 2
No Activities Maximum distance Spatial pattern
SPL 01 SPL 02 SPL 01 SPL 02
1 Shopping complex 146 m 211 m Clustered Clustered
2 Trade 165 m 894 m Clustered Clustered
3 Hotel and
supermarket 358 m 630 m Random Random
IV. CONCLUTION
Nowadays, energy has become a hot topic. The urban pattern become one of studies that hypothesized will influence the efficiency of distribution in electrical energy. Up to days, the previous researchs just studied spatial pattern based on the street pattern, social economic condition, and urban growth. Whereas for energy efficiency, mostly the researchers just studied related to urban transportation.
To enhance the previous researchs, we conducted a study to find out the patterns of urban space that can provide efficiency in electrical energy distribution. In this study, we used four steps analysis i.e. Electric Transient and Analysis Program (ETAP), Nearest Neighbor analysis, Hot spot analysis and Ordinary Least Square (OLS).
Based on the analysis, the most suitable spatial pattern to create the most efficient in electrical distribution in commercial area was cluster. The maximum distance for each activity was 146 m for shopping complex, 165 m for trade and service area and 358 m for hotel and supermarket.
Except distance factor, to create efficiency in electrical distribution in commercial area, the proportion of business area must be higher than other areas. Then followed by shopping complex and for the last was hotel and supermarket.
REFERENCES
[1] Lu, X., Huang, J., Sellers, J.M.,A global comparative analysis of urban form. 2006. (manuscript) Wong, K.., Shen, J., Feng, Z., Gu, C., An analysis of Dual-Track Urbanization in the Pearl River Delta Since 1980. Tijdschr. Econ. Soc. Ge. 2003, 94, Page 205-218.
[2] Annual energy outlook 2013, with projections to 2040. U.S. Energy Information Administration (EIA). (DOE/EIA-0383, 2013).Accessed on
http://www.eia.gov/outlooks/aeo/pdf/0383(2013).pdf
[3] Grubler, A.,Grand designs: historical patterns and future scenarios of energy technological change. Historical case studies of energy technology innovation in: chapter 24, the global energy assessment. Grubler A., Aguayo, F., Gallagher, K.S., Hekkert, M., Jiang, K., Mytelka, L., Neij, L., Nemet, G. & C. Wilson. (Cambridge University Press, Cambridge, UK, 2012).
[4] Wolpe, P. and Reddy, Y., The contribution of low-carbon cities to South Africa’s greenhouse gas emissions reduction goals. Briefing on urban energy use and greenhouse gas emissions. Sustainable Energy Africa. Prepared with the support of Bloomberg Philanthropies (Stockholm environment institute, 2015).
[5] Keirstead, J. and Shah, N., Urban energy systems: an integrated approach (London and New York: Routledge, Taylor & Francis Group, 2013). [6] Lin, J.J. and Feng, C.M.,A bi-level programming model for the land use-network design problem. The Annals of Regional Science, 37(1), 2003, 93-105.
[7] Brownsword, R. A., Fleming, P. D., Powell, J. C., Pearsall, N., Sustainable cities: modelling urban energy supply and demand,Applied Energy, 82(2), 2005, 167-180.
[8] Parshall, L., Gurney, K., Hammer, S. A., Mendoza, D., Zhou, Y., Geethakumar, S.,Modeling energy consumption and co2 emissions at the urban scale: methodological challenges and insights from the united states. energy policy, (in press, 2009).
[9] Girardin, L., Dubuis, M., Darbellay, N., Marechal, F., and Favrat, D., Energis: a geographical information based system for the evaluation of integrated energy conversion systems in urban areas, Energy, 35(2), 2010, 830-840.
[10] Connolly, D., Lund, H., Mathiesen, B., Leahy, M., A review of computer tools for analysing the integration of renewable energy into various energy systems,Applied Energy, 87(4), 2010, 1059-1082.
[15] Ourng, C and Rodrigues, D. S., Urban growth pattern identification: a case study in Siem Reap, Cambodia, 2012.
[16] Ma, R., Gu, C., Ma, X., Pu, Y., Mining the urban sprawl pattern: a case study on Sunan, China, Sensors, 8, 2008, 6371-6395.
[17] Saravanan, P. and Ilangovan, P., Identification of urban sprawl pattern for Madurai Region using GIS, International Journal of Geomatics and Geosciences, 1 (2), 2010.
[18] Alabi, M., Urban sprawl, pattern and measurement in Lokoja, Nigeria, Theoretical and Empirical Research in Urban Management,4(13), 2009.
[19] Huiping, L. and Qiming, Z., Developing urban growth predictions from spatial indicators based on multi-temporal images,Computers, Environment and Urban Systems, 29 (5), 2005, 580-594.
[20] Huynh, H. N., Makarov, E., Legara, E. F., Monterolas, C. Chew, L. Y., Spatial patterns in urban systems, 2016. Retrieved from https://arxiv.org/abs/1604.07119v1. [21] Wegener, M. and Kunzmann, K. R., 1996. New spatial patterns of European urbanisation, in Pumain, D., Saint-Julien, T. (Eds.), Urban networks in Europe. (Paris:
John Libbey, 1996) 7-17.
[22] Wei, G. and Jiang, Z., Analysis of the spatial characteristics of commercial streets in China's Southern Cities: a case of three commercial streets in Suzhou. 49th ISOCARP Congress, 2013.
[23] Leps, J. and Kindlmann, P., Models of the development of spatial patyernof an even-aged plant population over time,Ecological Modellingo, 39, 1987, 45-57. [24] Yang, J-H., Ettema, D.,Frenken, K., Modelling the emergence of spatial patterns of economic activity, Urban and Regional Research Centre, Faculty of
Geosciences, Utrecht University., 2012.
[25] Feitosa, F.F., Monteiro, A.M.V., Câmara, G. Residential segregation indices as tools foridentifying socially vulnerable families. II Simpósio Nacional de Geografia da Saúde, Rio deJaneiro, 2005.
[26] Dixion, M. P., Nearest neighbor methods, 2012.
[27] Block, R. L., and Block, C.R., Space, place, and crime: hot spot areas and hot places of liquor-related crime in J.E.E. and D. Weisburd, (Ed), (New York: Criminal Justice Press, 1995).
[28] Tutorial Regression Analysis. Retrieved fromeclectic.ss.uci.edu/~drwhite/pdf/Tutorial-RegressionAnalysis.pdf [29] Draper, N. R. and Smith, H., Applied regression analysis (3rd Ed), (New York: John Wiley & Sons, Inc, 1998).
[30] Fotheringham, A. S., Brunsdon, C., Charlton, M., Geographically weighted regression: the analysis of spatially varying relationships, Journal of Chemical Information and Modeling, 53, (Chichester: John Wiley & Sons Ltd, 2002). Retrieved from http://doi.org/10.1017/CBO9781107415324.004.
[31] Fotheringham, A. S., Brunsdon, C., Charlton, M. E., Geographically weighted regression: a natural evolution of the expansion method for spatial data analysis.
Environment and Planning A, 30, 1998, 1905–1927. Retrieved from https://pdfs.semanticscholar.org/12e2/3a0643b893b84bd3ba7f8642575f1faaf3ea.pdf.
AUTHORS
First Author – Singgih Hartanto, Urban Energy System, Architecture and Urban Planning Departement, Diponegoro
University,[email protected].
Second Author – Soegiono Soetomo,Urban and Regional Planning, Architecture and Urban Planning Departement, Diponegoro
University.
Third Author – Broto Sunaryo,Urban and Regional Planning, Architecture and Urban Planning Departement, Diponegoro University.
Fourth Author – Wisnu Pradoto,Urban and Regional Planning, Architecture and Urban Planning Departement, Diponegoro
University.