ScholarWorks @ Georgia State University
Chemistry Theses Department of Chemistry
Summer 8-8-2017
Computational Studies of Liver Receptor
Homolog 1 in the Presence of Small Molecule
Agonists: Allosteric Communication and Virtual
Screening for New Potential Drug Candidates
Bernard Scott Jr
Georgia State University, bscott22@student.gsu.edu
Follow this and additional works at:http://scholarworks.gsu.edu/chemistry_theses
This Thesis is brought to you for free and open access by the Department of Chemistry at ScholarWorks @ Georgia State University. It has been accepted for inclusion in Chemistry Theses by an authorized administrator of ScholarWorks @ Georgia State University. For more information, please contactscholarworks@gsu.edu.
Recommended Citation
Scott, Bernard Jr, "Computational Studies of Liver Receptor Homolog 1 in the Presence of Small Molecule Agonists: Allosteric Communication and Virtual Screening for New Potential Drug Candidates." Thesis, Georgia State University, 2017.
OF SMALL MOLECULE AGONISTS: ALLOSTERIC COMMUNICATION AND VIRTUAL
SCREENING FOR NEW POTENTIAL DRUG CANDIDATES
by
BERNARD SCOTT
Under the Direction of Ivaylo Ivanov, PhD
ABSTRACT
Liver Receptor Homolog 1 (LRH-1) is a nuclear receptor whose dysfunction is affiliated
with diseases such as diabetes and cancer. Recent investigations demonstrate that higher levels
of activation and modulation of its activity can be achieved through its interaction with
phospholipids (PLs) and synthetic small molecules. We employed molecular dynamics (MD)
simulations to understand more about the structural basis of LRH-1’s activity when bound to
small molecule agonist RJW100 as well as the RJW100 derivative 65endo. We find that
RJW100 and derivative 65endo can trigger allosteric communication in LRH-1 despite the
RJW100 scaffold inducing motions that differ from those induced by PLs. We also provide
supporting evidence that a key threonine residue and a water network are important for
RJW100’s ability to activate LRH-1. Finally, in a campaign to identify new LRH-1 lead
compounds, virtual screening was performed against RJW100, 65endo, and a second RJW100
OF SMALL MOLECULE AGONISTS: ALLOSTERIC COMMUNICATION AND VIRTUAL
SCREENING FOR POTENTIAL NEW DRUG CANDIDATES
by
BERNARD SCOTT
A Thesis Submitted in Partial Fulfillment of the Requirements for the Degree of
Master of Science
in the College of Arts and Sciences
Georgia State University
Copyright by Bernard Scott
OF SMALL MOLECULE AGONISTS: ALLOSTERIC COMMUNICATION AND VIRTUAL
SCREENING FOR POTENTIAL NEW DRUG CANDIDATES
by
BERNARD SCOTT
Committee Chair: Ivaylo Ivanov
Committee: Donald Hamelberg
Alfons Baumstark
Electronic Version Approved:
Office of Graduate Studies
College of Arts and Sciences
Georgia State University
ACKNOWLEDGEMENTS
I would really like to thank Dr. Ivanov for his guidance over the 2 years spent in the lab.
Considering that I do not come from a physics or computational background, I am glad that he
took me in and even gave me some freedom in terms of projects I wanted to work on. In
addition to this, he is an awesome teacher that had the patience to break down concepts. I still
have a lot of learning and growing to do, but working under his supervision has helped achieve
both personal and intellectual growth. I would also like to really thank Dr. Hamelberg and Dr.
Baumstark for serving on my committee and encouraging me through this process.
I would really like to thank Brad, Kathleen, Patrick, Tom, and Chunli for advising,
helping with technical difficulties, and just being patient with me when possible. I want to
especially thank Brad and Kathleen who also made amazing teachers that pushed me to really
think and at least attempt to grasp ideas I didn’t believe I was capable of. They really set the bar
for me. I have had several ups and downs and could still use a lot of improvement, but both
represent something I should strive towards in the future studies I pursue. I truly do appreciate
all of the help and support from everyone in the Ivanov group,
I would also like to thank the Ortlund group for providing the necessary material and
insight to complete my project. I learned a lot from working on this project and am very
TABLE OF CONTENTS
ACKNOWLEDGEMENTS ... V
LIST OF TABLES ... IX
LIST OF FIGURES ... X
LIST OF ABBREVIATIONS ... XII
1 INTRODUCTION ... 13
1.1 LRH-1 Dysregulation and Disease ... 13
1.2 Allostery: A Brief Overview ... 14
1.3 Structural Features of LRH-1 ... 15
1.3.1 Features that Allow for Ligand Independent Activation of LRH-1 ... 15
1.3.2 Discovery of Ligand Activation ... 17
1.3.3 Allosteric Communication and PL Induced Dynamics in LRH-1 ... 17
1.3.4 Insight Gained in Early Drug Discovery Efforts ... 19
1.3.5 Current Experimental Insight into Activation of LRH-1 by Synthetic Agonists. ... 20
1.4 References ... 35
2 METHODS AND MATERIALS ... 38
2.1 Virtual Screening... 38
2.1.1 Tanimoto Scoring with ROCS and EON ... 38
2.2 Molecular Dynamics ... 39
2.2.1 Amber Force Field ... 39
2.2.2 Newton’s Equations ... 41
2.2.3 Long Range Interactions ... 42
2.2.4 Controlling Temperature using Langevin dynamics ... 43
2.2.5 Pressure control ... 44
2.3 MD Analysis Techniques ... 44
2.3.1 Principal Component Analysis(PCA) ... 44
2.3.2 Dynamical Network Analysis... 45
2.3.3 Grid Inhomogeneous Solvation Theory ... 46
2.4 Experimental Procedure ... 49
2.5 References ... 54
3 RESULTS AND DISCUSSION ... 57
3.1 PCA and Cross-correlation Analysis ... 57
3.2 Investigation of Solvent Energetics within LRH-1’s Ligand Binding Pocket . ... 58
3.3 Investigation of RJW100 Induced Allosteric Communication ... 62
3.3.1 RJW100 Derivative 65endo Enhances Allosteric Communication... 63
3.4.1 RJW100 as Lead Compound Yields Hydrophobic Pharmaceutical Targets
of LRH-1 ... 66
3.4.2 Virtual Screening of Polar Derivatives ... 67
3.5 References ... 81
LIST OF TABLES
Table 3-1 Integrated thermodynamic data of solvent within 4.5𝑨 of RJW100. ... 60
Table 3-2 Thermodynamic data of solvent groups in closest proximity to RJW100. ... 60
Table 3-3 Number of Suboptimal Paths generated upon binding of agonists. ... 63
LIST OF FIGURES
Figure 1.1. Mechanisms for regulating LRH-1 activity. ... 22
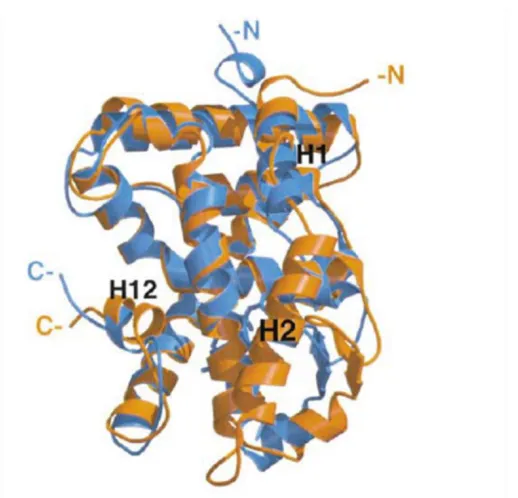
Figure 1.2. Ribbon diagram highlighting key structural features of LRH-1. ... 23
Figure 1.3. Overlay of LRH-1 onto Retinoid X Receptor (RXR). ... 24
Figure 1.4. Structures of LRH-1·TIF2 in complex with agonist DLPC. ... 25
Figure 1.5. Measurements of LHR-1 Phospholipid binding preferences. ... 26
Figure 1.6. Ribbon diagrams of LRH-1·TIF2 systems with varied LBP status. ... 27
Figure 1.7. Correlated motions in LRH-1 when bound to Phospholipids. ... 28
Figure 1.8. Allosteric communication between β-H6 and co-activator TIF2. ... 29
Figure 1.9. Ribbon diagram featuring structure of LRH-1·TIF2 complexed to GSK8470. ... 30
Figure 1.10. Ribbon diagram featuring tructure of LRH-1·TIF2 in complex with RJW100. ... 31
Figure 1.11. Experimentally measured dynamical and thermodynamic profile of LRH-1·TIF2 when complexed to DLPC and RJW100. ... 32
Figure 1.12. Measurement of activity levels and thermostability of LRH-1·TIF2 systems complexed with small molecule agonists. ... 33
Figure 1.13. Ribbon diagram featuring the structure of LRH-1·Tif-2 in complex with RJW100 derivatives. ... 34
Figure 2.1. Protocol for Virtual Screening of LRH-1. ... 52
Figure 3.1. Correlated Motions in LRH-1·TIF2 when complexed to RJW100. ... 70
Figure 3.2. Cross Correlation plots of LRH-1·Tif-2 with varied LBP statuses. ... 71
Figure 3.3. Areas of energetically favored water-solute interactions within LRH-1·TIF2 LBP in complex with RJW100. ... 72
Figure 3.5. Comparison of Suboptimal Paths between LBD and TIF2 co-activator. ... 74
Figure 3.6 Comparison of Suboptimal Paths (blue) between LBD and co-activator TIF2(green).
... 75
Figure 3.7. Heavily traversed nodes in suboptimal paths. ... 76
Figure 3.8. Comparison of 65endo and RJW100 complexed crystal structures. ... 77
Figure 3.9. Top 12 scoring candidates from the virtual screening of RJW100. All scores are
measured in kcal/mol. ... 78
Figure 3.10. Top 12 scoring candidates from the virtual screening of 8AC. All scores are
measured in kcal/mol. ... 79
Figure 3.11. Top 12 scoring candidates from the virtual screening of 65endo. All scores are
measured in kcal/mol ... 80
LIST OF ABBREVIATIONS
Liver Receptor Homolog-1 LRH-1
Phospholipid PL
Small Heterodimer Partner SHP
Transcription Intermediary Factor 2 TIF2
Ligand Binding Pocket LBP
Beta-H6 Region β-H6
Activation Function Region AF2
Activation Function Helix AF-H
Alternate Function Region AF
molecular dynamics MD
Principal Component Analysis PCA
dilauroylphosphatidylcholine DPLC
Helix H
1 INTRODUCTION
Liver Receptor Homolog 1 (LRH-1) belongs to the subfamily V of nuclear receptors
(NR5A). Like many other nuclear receptors, LRH-1 functions as a transcription factor [1].
LRH-1 has been shown to be important in regulating many metabolic processes. Of special
importance is the association of its dysregulation with metabolic disorders and cancers. This
primarily occurs through its role in facilitating the transcriptional activity of metabolic genes
involved in gluconeogenic pathways such as fatty acid synthase and glucocorticoid kinase [1].
It also plays a pivotal role in the regulation of genes involved in cellular differentiation and is
consequently implicated in several cancers. LRH-1’s transcriptional activity is modulated
through several mechanisms which include ligand binding, post-translational modifications, and
binding to co-activating and repressing proteins (Fig. 1.1) [2].
1.1 LRH-1 Dysregulation and Disease
LRH-1 has been linked to liver disease through its role in the regulation of glucose
metabolism. It is highly expressed in liver and is known to directly influence the synthesis of
bile acids by promoting increased expression of Cytochrome p450s, namely Cyp7a1 and Cyp8b
[2] and other targets that control cholesterol uptake. Its regulation of glucose metabolism stems
from its role in regulating expression glucokinase enzyme. LRH-1 knockout mice have
diminished ability to induce glycolysis as well as glycogen and fatty acid synthesis [3].
Treatment of LRH-1 with phospholipid DLPC has been shown to have anti-diabetic
effects in mice [3]. LRH-1 is known for its role in regulating intermediary glucose metabolism
through its regulation of genes such as glucokinase [4]. LRH-1 has also been linked to pathways
involved in resolving Endoplasmic Reticulum [ER] stress with some recent findings suggesting
promoting embryonic development [1]. Its involvement in such processes makes it unsurprising
that its dysregulation can result in various cancers including pancreatic, lung, intestinal, and
breast cancer [1,6,7,8,9,10, 11] where LRH-1 has been found to be abnormally expressed in 45%
of breast carcinomas [6].
1.2 Allostery: A Brief Overview
Allostery is defined as the interaction of two topologically distinct sites as triggered by a
binding event at one of the sites [12]. Models of allostery that account for the dynamical
behavior of macromolecules have been developed [13]. Among them is the ensemble model of
allostery [14] which proposes that all proteins exhibit an ensemble of conformations and that
introduction of a perturbation (such as ligand binding) triggers a shift in the population
distribution of the ensemble [14]. Allosteric phenomena are often associated with large
conformational changes, however there are several cases where more subtle motions are
responsible for allosteric communication within a macromolecular system [15]. Use of a
network theory framework provides us with tools to account for how smaller changes contribute
to allosteric phenomenon [16,17,18,19].
Allosteric targeting provides a promising alternative to targeting orthosteric binding sites.
This especially applies to cases in which a family of enzymes or receptors have a highly
conserved orthosteric site. Allosteric sites within proteins of the same family or subfamily are
typically less conserved than the corresponding orthosteric site and present an opportunity to
achieve selective targeting [20]. This approach also has the advantage of modulating a target’s
1.3 Structural Features of LRH-1
Like other nuclear receptors [21], LRH-1 functionality is largely modulated via its
interaction with a suite of small co-regulating peptides capable of either repressing or activating
LRH-1’s regulation of transcriptional activity. Our investigations focus on LRH-1’s interactions
with the co-activator Transcription Intermediary Factor 2 (TIF2. Aliases include GRIP2 and
SRC2). TIF2 is a co-activating peptide which typically recognizes nuclear receptors in a ligand
dependent manner [22]. Co-regulating peptides such as TIF2 exploit LXXLL motifs to access
the N-terminal binding clefts of LRH-1 which is consistent with recognition motifs of other
nuclear receptors such as Retinoid X Receptor (RXR) [23]. Several important conformational
changes occur upon ligand binding to nuclear receptors such as the reorientation of Helix 12, the
Activation Function Helix (AF-H). This reorientation facilitates the completion of a
hydrophobic binding surface for co-regulator proteins [24]. However, a full understanding of
how ligand binding facilitates transcription activating states of LRH-1 has yet to be achieved.
The ligand binding pocket (LBP) includes helices 2 and 3 along with the β-sheet-H6 Region
(β-H6, yellow) which encompasses β-sheets 1 and 2 as well as helix 6. These two regions
combined in addition to helices 5 and 10 comprise the Alternate Function (AF) domain whereas
regions of LRH-1 engaging the co-regulator (purple) are designated as the Activation Function
Domain (AF2) (Fig. 1.2) [23].
1.3.1 Features that Allow for Ligand Independent Activation of LRH-1
1 can upregulate transcription in absence of a ligand and studies with murine
LRH-1 revealed an empty ligand binding pocket (LBP) [24]. These studies highlighted key structural
differences from ligand activated nuclear receptors. These differences include features that
They also include an extended and rigid Helix 2 that packs against Helix 3 in LRH-1. Retinoid
X Receptor and many other nuclear receptors feature Helices 1 and 2 that are separated by a
highly disordered flexible loop [24]. Helix 1 in LRH-1 is positioned closer to Helix H9,
strategically placing an N-terminal proline residue on a different face of H1 than homologous
receptors. These differences are proposed to result in more extensive contacts between Helix 1
and other portions of the protein, which is thought to be crucial to LRH-1’s constitutive
activation and recruitment of co-activating peptides in the absence of a ligand [24].
However, the study also foreshadowed future findings that LRH-1 is responsive to ligand
binding. An overlay of LRH-1 on top of RXR (Fig. 1.3) demonstrates that mLRH-1’s activated
conformation was similar to ligand activated RXR. This suggested that LRH-1 was at least
capable of accommodating sizeable ligands such as retinoids and cholesterol derivatives [24].
However, the ligand independent nature of activation was reaffirmed through evidence derived
from mutagenesis studies. Methionine and Tryptophan mutants were made of LBP inner facing
residues Ala368 from H1 and Ala532 from H11. These mutations were selected to impair
binding of ligands to the LBP. The results showed enhanced LRH-1 facilitated transcription of
SHP in both Ala532 mutants where LRH-1 retained the ability to recruit co-repressing peptides
in the absence of a ligand [24].
Further mutagenesis experiments provided evidence that Helix 2 may play a significant
role in co-regulator recruitment. Mutation of three glutamine residues led to diminished activity
of LRH-1 as well as diminished responsiveness to co-regulators TIF2 and SHP [24]. It is
speculated that H2’s importance rests in its ability to assist in stabilization of the AF-H [24].
LRH-1’s co-regulator binding cleft may not be optimized for recruitment of co-activators
from others including an AF-H with bulkier residues and variants of residues that contribute to a
charged clamped interaction between the AF-H and co-regulator proteins in other nuclear
receptors. One such example is Gln398 of LRH-1 which aligns with lysine or arginine residues
found in other receptors. This difference may be associated with the reduced ability of LRH-1 to
discriminate between co-activators and repressors versus other nuclear receptors. Mutagenesis
studies replacing bulkier residues of LRH-1’s AF-H with the smaller residues found in RXR
resulted in increased transcriptional activity in response to over-expression of common
co-activator proteins [24].
1.3.2 Discovery of Ligand Activation
Despite originally having been thought to be an orphan nuclear receptor, evidence showed
that it is not when phospholipids (PLs) were identified in LRH-1’s LBP indicating that LRH-1
may be a lipid metabolism sensing receptor [27]. Treatment of mice with
dilauroylphosphatidylcholine (DLPC) resulted in lower serum glucose levels [3]. DLPC binds
LRH-1’s LBP with a unique binding mode (Fig. 1.4) which features the insertion of the fatty acyl
tail into the interior of the protein exploiting several hydrophobic contacts as well as the
placement of polar head group near the “mouth” of the protein which is solvent exposed. The
polar head group participates in key polar contacts with Tyr516 and Lys520 [28].
LRH-1 discriminates by tail-length more so than headgroup composition [29]. As shown
in Figure 1.5, LRH-1 can bind many types of PL headgroups but displays a clear preference for
medium fatty acyl tail lengths, lengths between 8 and 16 carbons [29].
1.3.3 Allosteric Communication and PL Induced Dynamics in LRH-1
LRH-1 activates transcription upon binding medium-tailed PLs such as DLPC and
that LRH-1 ligand binding increases co-activator access by triggering an allosteric pathway that
allows for communication between the LBP and the Activation Function region primarily
through Helix 5 which bridges the two remote regions of LRH-1. This allosteric communication
is characterized by the highly correlated motions that take place between the two regions upon
ligand binding. In the presence of phospholipids, notable structural changes occur at both the
ligand binding pocket and the regulator binding cleft. The statuses of the LBP and the
co-regulator binding cleft can either be in agreement or disagreement [29]. An agonist bound to
LBP and co-activator bound in co-regulator binding cleft would characterize statuses in
agreement whereas an agonist bound LBP with a co-repressor bound would characterize
disagreeing statuses.
LRH-1’s ability to selectively bind co-regulatorsis in part dictated by whether the
statuses of the two regions agree or disagree with one another [29]. Crystal structures from
various LRH-1 complexes demonstrate a possible association. One indication of this link is the
fidelity of the charge clamp interaction in transcription repressing structures. De-activated
LRH-1 bound to Small Heterodimer Partner (SHP) a co-repressing protein and Escherichia coli (E.
coli) PLs at the LBP as well as apo LBP features an intact charge clamp interaction between SHP
and the AF-H [28,29,30]. LRH-1·TIF2 when complexed with DLPC (agreement status) features
a diminished distance between LRH-1’s Glu534 and TIF2 versus activated structures with
disagreeing statuses as well as the more optimal positioning of Glu534 that allows for the contact
with TIF2 (Figure 1.6).
Principle Component Analysis (PCA) demonstrated that DLPC induced a notable
“breathing” motion at the mouth of LRH-1 (PC2) and between H10 and H9 (PC1). This is
more dynamical than when LRH-1 is bound to longer tailed PLs [29]. This finding also extends
to potentially antagonistic PLs (E. coli PLs) that induce structural changes more associated with
the inactivated conformation [29]. A crystal structure was identified with LRH-1 in complex
with E. coli PLs and a fragment of SHP. This complex appears to place the opening of the LBP,
including H2, H3 and β-H6 region in a more open conformation than the TIF2 bound complex
(Fig. 1.6A). In addition, H9 and H10 assume a more open conformation in the deactivated
structure. When the Principal Components are plotted against each other, the DLPC-bound
structure exhibits a single density-populated cluster of conformational subspace along PC2
whereas activated LRH-1 with disagreeing statuses (Fig. 1.7, C versus D) seems to feature two
clusters along PC2 [29]. The results suggest that agreement status of the two remote domains
influence the topology of the co-regulator binding cleft, which could in part explain variances in
co-regulator selectivity.
Dynamical Network Analysis results (via suboptimal path analysis) showed that, when
bound to PLs, agreement statuses did correlate well with the amount of communication (in this
case the number of suboptimal paths) between the LBP and the co-regulator binding cleft.
Figure 1.8A demonstrates how DLPC binding to LRH-1·TIF2 induces much stronger
communication in comparison to the E. coli PL binding where one sees a diminished number of
suboptimal paths travelling between the two remote regions [29].
1.3.4 Insight Gained in Early Drug Discovery Efforts
GSK8470, a small molecule agonist of LRH-1, provided interesting structural
information and served as a template for future candidates [31]. An X-ray crystal structure with
LRH-1·TIF2 and GSK8470 in complex reveals a mode of binding that exploits hydrophobic
aniline moiety of GSK8470 and His390 (Fig. 1.9) [31]. Attempts to derivatize this lead
compound led to discovery of another agonist, RJW100 which features a hydroxyl functionality
on the bicyclic core of the molecule [30].
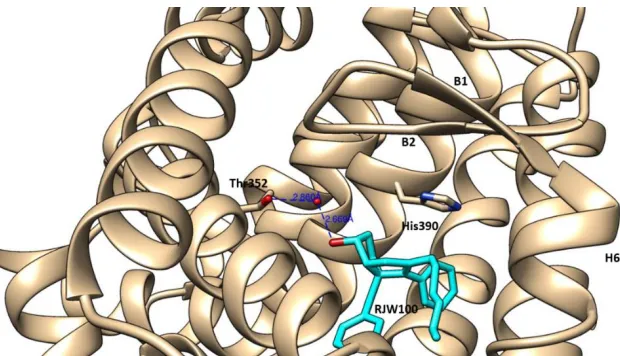
RJW100 was crystallized with LRH-1·TIF2 (Fig. 1.10) as well and its binding mode
contains several features that differentiate it from GSK8470 [31]. The proposed pi-pi interaction
is preserved, but instead has an edge-face configuration. Of note is a potential water-mediated
interaction between the hydroxyl of RJW100 and Thr352. This interaction suggests that addition
of a polar moiety to the original scaffold induces productive allosteric communications between
the LBP and the co-regulator binding cleft.
1.3.5 Current Experimental Insight into Activation of LRH-1 by Synthetic Agonists.
Studies have attempted to elucidate the structural basis of small molecule activation of
LRH-1 [32]. RJW100 destabilized helices 10 and 3, and stabilizes AF-H. Despite the stability
of the AF-H, Glu534 becomes disordered in comparison to DLPC bound LRH-1 (Fig. 1.11) [32].
This implies that RJW100 is unable to achieve selective co-activator recruitment as well as
DLPC. Key placement of structural waters likely plays a role in the binding of LRH-1 by small
molecules. Mutagenesis studies reveal a diminished ability of RJW100 to activate LRH-1 upon
T352V mutation (Fig. 1.12) to disrupt the water network. Simulations additionally demonstrate
the stability of crystallographic waters within the LBP of wildtype (wt) LRH-1 as well as
destabilization in the mutant [32].
Two RJW100 derivatives, 65endo and 8AC have been synthesized. 65endo replaces the
hydroxyl functional group with a sulfonamide whereas 8AC retains the hydroxyl group while
extending and capping the aliphatic tail with a polar ester group (Fig. 1.13). Both compounds
LRH-1 to trigger increased transcriptional activity relative to RJW100. RJW100’s hydroxyl
group was replaced with a sulfonamide yielding 65endo. This modification was intended to
enhance binding to the polar patch within LRH-1’s LBP. The incorporation of the ester
functional group to yield 8AC was intended to allow for contacts at the mouth of the binding
pocket (mimicking PL agonists such as DLPC) while maintaining contacts within the interior via
Figure 1.1. Mechanisms for regulating LRH-1 activity.
LRH-1-mediated transcriptional activity can be modulated through several mechanisms including ligand binding, post-translational modifications, co-activator binding, and co-repressor binding. LRH-1 activation facilitates transcription of genes involved in several processes including metabolism, cell growth, and cell differentiation. Figure has been adapted with permission from Nadolny, C. and X. Dong, Liver receptor homolog-1 (LRH-1): a
Figure 1.2. Ribbon diagram highlighting key structural features of LRH-1.
Figure 1.3. Overlay of LRH-1 onto Retinoid X Receptor (RXR).
Figure 1.4. Structures of LRH-1·TIF2 in complex with agonist DLPC.
A) Ribbon Diagram of LRH-1·TIF2 complexed with DLPC (within green electron density) (pdb 4dos). B) DLPC and sidechains lining LRH-1 LBP. Figure has been reproduced with permission from Musille, P.M., et al., Antidiabetic phospholipid-nuclear receptor complex reveals the mechanism for phospholipid-driven gene regulation. Nat Struct Mol Biol, 2012.
Figure 1.5. Measurements of LHR-1 Phospholipid binding preferences.
Figure 1.6. Ribbon diagrams of LRH-1·TIF2 systems with varied LBP status.
Figure 1.7. Correlated motions in LRH-1 when bound to Phospholipids.
A) Principal Component Analysis of LRH-1 systems Principal Component 1 (PC1) features an opening motion of the activated state at Helix 8 and 9 versus de-activated state. B) Principal Component 2 (PC2) features an opening motion at the opening of 1’s Ligand Binding Pocket of the activated form of LRH-1. In both PCs, transcription activating structures (green) have larger interhelical distances (between Helices 8 and 9 in PC1, and helices 2 and 6 in PC2) than repressed (red) structures. C) Principal Component 1 and 2 plotted against each other for LRH-1·Tif-2 complexed to DLPC. D) LRH-1·Tif-2 complexed to an E.coli Phospholipid [11]. The higher the density, the more frames (out of 10000) characterized as occupying the indicated region of conformational subspace. This figure has been adapted from Musille, P.M., et al., Unexpected Allosteric
Network Contributes to LRH-1 Co-regulator Selectivity. J Biol Chem, 2016.
Figure 1.8. Allosteric communication between β-H6 and co-activator TIF2.
Figure 1.9. Ribbon diagram featuring structure of LRH-1·TIF2 complexed to GSK8470.
Figure 1.10. Ribbon diagram featuring tructure of LRH-1·TIF2 in complex with RJW100.
Figure 1.11. Experimentally measured dynamical and thermodynamic profile of LRH-1·TIF2 when complexed to DLPC and RJW100.
Figure 1.12. Measurement of activity levels and thermostability of LRH-1·TIF2 systems complexed with small molecule agonists.
Figure 1.13. Ribbon diagram featuring the structure of LRH-1·Tif-2 in complex with RJW100 derivatives.
1.4 References
1. Fayard, E., J. Auwerx, and K. Schoonjans, LRH-1: an orphan nuclear receptor involved in
development, metabolism and steroidogenesis. Trends in Cell Biology. 14(5): p. 250-260
2. Nadolny, C. and X. Dong, Liver receptor homolog-1 (LRH-1): a potential therapeutic target
for cancer. Cancer Biol Ther, 2015. 16(7): p. 997-1004.
3. Musille, P.M., et al., Antidiabetic phospholipid-nuclear receptor complex reveals the
mechanism for phospholipid-driven gene regulation. Nat Struct Mol Biol, 2012. 19(5): p.
532-7, S1-2
4. Oosterveer, M.H., et al., LRH-1-dependent glucose sensing determines intermediary
metabolism in liver. J Clin Invest, 2012. 122(8): p. 2817-26.
5. Mamrosh, J.L., et al., Nuclear receptor LRH-1/NR5A2 is required and targetable for liver
endoplasmic reticulum stress resolution. Elife, 2014. 3: p. e01694.
6. Thomas, S.E., et al., Unravelling the story of protein misfolding in diabetes mellitus. World J
Diabetes, 2011. 2(7): p. 114-8.
7. Jiang, W., et al., MicroRNA-376c suppresses non-small-cell lung cancer cell growth and
invasion by targeting LRH-1-mediated Wnt signaling pathway. Biochem Biophys Res
Commun, 2016. 473(4): p. 980-6.
8. Bianco, S., et al., LRH1 governs vital transcriptional programs in endocrinesensitive and
-resistant breast cancer cells. Cancer Res, 2014. 74(7): p. 2015-25.
9. Benod, C., et al., Nuclear receptor liver receptor homologue 1 (LRH-1) regulates pancreatic
cancer cell growth and proliferation. Proc Natl Acad Sci U S A, 2011. 108(41): p. 16927-31.
10. Chand, A.L., et al., The orphan nuclear receptor LRH-1 promotes breast cancer motility and
11. Clyne, C.D., et al., Liver receptor homologue-1 (LRH-1) regulates expression of aromatase
in preadipocytes. J Biol Chem, 2002. 277(23): p. 20591-7.
12. Kramer, H.B., et al., LRH-1 drives colon cancer cell growth by repressing the expression of
the CDKN1A gene in a p53-dependent manner. Nucleic Acids Res, 2016. 44(2): p. 582-94.
13. Changeux, J.-P., 50 years of allosteric interactions: the twists and turns of the models. Nat
Rev Mol Cell Biol, 2013. 14(12): p. 819-829.
14. Kern, D. and E.R.P. Zuiderweg, The role of dynamics in allosteric regulation. Current
Opinion in Structural Biology, 2003. 13(6): p. 748-757.
15. Motlagh, H.N., et al., The ensemble nature of allostery. Nature, 2014. 508(7496): p. 331-339.
16. Tsai, C.-J., A.d. Sol, and R. Nussinov, Allostery: Absence of a change in shape does not
imply that allostery is not at play. Journal of molecular biology, 2008. 378(1): p. 1-11.
17. Dokholyan, N.V., Controlling Allosteric Networks in Proteins. Chemical Reviews, 2016.
116(11): p. 6463-6487.
18. Allosteric Communication Occurs via Networks of Tertiary and Quaternary Motions in
Proteins.
19. O'Rourke, K.F., S.D. Gorman, and D.D. Boehr, Biophysical and computational methods to
analyze amino acid interaction networks in proteins. Computational and Structural
Biotechnology Journal, 2016. 14: p. 245-251.
20. Nussinov, R. and C.-J. Tsai, Allostery in Disease and in Drug Discovery. Cell. 153(2): p.
293-305.
21. Millard, C.J., et al., An evolving understanding of nuclear receptor coregulator proteins. J
Mol Endocrinol, 2013. 51(3): p. T23-36.
and mediates transactivation through CBP binding-dependent and -independent pathways.
The EMBO Journal, 1998. 17(2): p. 507-519.
23. Savkur, R.S. and T.P. Burris, The coactivator LXXLL nuclear receptor recognition motif.
The Journal of Peptide Research, 2004. 63(3): p. 207-212.
24. Sablin, E.P., et al., Structural Basis for Ligand-Independent Activation of the Orphan
Nuclear Receptor LRH-1. Molecular Cell. 11(6): p. 1575-1585.
25. Lee, Y.K., et al., Phosphorylation of the hinge domain of the nuclear hormone receptor
LRH-1 stimulates transactivation. J Biol Chem, 2006. 281(12): p. 7850-5.
26. Priest, C. and P. Tontonoz, SUMOylation Places LRH-1 in PROXimity to Lipid Metabolism.
Cell Metabolism. 20(4): p. 558-559.
27. Krylova, I.N., et al., Structural analyses reveal phosphatidyl inositols as ligands for the NR5
orphan receptors SF-1 and LRH-1. Cell, 2005. 120(3): p. 343-55.
28. Ortlund, E.A., et al., Modulation of human nuclear receptor LRH-1 activity by phospholipids
and SHP. Nat Struct Mol Biol, 2005. 12(4): p. 357-63.
29. Musille, P.M., et al., Unexpected Allosteric Network Contributes to LRH-1 Co-regulator
Selectivity. J Biol Chem, 2016. 291(3): p. 1411-26.
30. Zhang, T., et al., Molecular dynamics simulation study for LRH-1: interaction with fragments
of SHP and function of phospholipid ligand. Proteins, 2008. 70(4): p. 1527-39.
31. Whitby, R.J., et al., Small molecule agonists of the orphan nuclear receptors steroidogenic
factor-1 (SF-1, NR5A1) and liver receptor homologue-1 (LRH-1, NR5A2). J Med Chem,
2011. 54(7): p. 2266-81.
32. Mays, S.G., et al., Crystal Structures of the Nuclear Receptor, Liver Receptor Homolog 1,
2 METHODS AND MATERIALS
2.1 Virtual Screening
2.1.1 Tanimoto Scoring with ROCS and EON
A portion of our drug discovery efforts employed ligand based virtual screening
techniques to identify new scaffolds that can bind to the same pocket with similar overall shape
and charge distribution. An ensemble of ligand conformations was generated for all compounds
in NCI database through the program OMEGA [1], and the query molecules (binding poses of
each agonist as found in LRH-1·TIF2 X-ray crystal structures) and generated conformers are
aligned and scored with ROCS [2]. After structural alignment, EON [3] can be used to compare
electrostatic potential maps of the same molecules using Tanimoto measurements to aid in
discovery of potential agonists.
𝑆ℎ𝑎𝑝𝑒 𝑇𝑎𝑛𝑖𝑚𝑜𝑡𝑜 = 𝑆ℎ𝑎𝑝𝑒 𝑂𝑣𝑒𝑟𝑙𝑎𝑝(𝐴,𝐵)
𝑆ℎ𝑎𝑝𝑒(𝐴)+𝑆ℎ𝑎𝑝𝑒(𝐵)+𝑂𝑣𝑒𝑟𝑙𝑎𝑝 𝑆ℎ𝑎𝑝𝑒(𝐴,𝐵) Eq. 2.1
𝐸𝑙𝑒𝑐𝑡𝑟𝑜𝑠𝑡𝑎𝑡𝑖𝑐 𝑇𝑎𝑛𝑖𝑚𝑜𝑡𝑜 = 𝐸𝐹𝑖𝑒𝑙𝑑 𝑂𝑣𝑒𝑟𝑙𝑎𝑝(𝐴,𝐵)
𝐸𝑓𝑖𝑒𝑙𝑑(𝐴)+𝐸𝑓𝑖𝑒𝑙𝑑(𝐵)+𝐸𝑓𝑖𝑒𝑙𝑑(𝐴,𝐵) Eq. 2.2
Tanimoto measurement is used in the comparison of sets of 3D parameters, and it involves
comparing the overlap of those properties. Shape functions (volumes) for A and B are compared
with the overlap between the two shape functions after alignment to give Shape Tanimoto values
which approach 0.0 for dissimilar and 1.0 for identical (eq. 2.1) [2]. Eon Tanimoto (eq. 2.2) uses
Poisson-Boltzmann electrostatic field functions to compare A and B assigning a penalty for
compounds with fields with opposite signs, such that the minimum score is -1/3 in the case of a
2.1.2 Molecular Docking
Docking considers both the shape, electrostatics, bond length, bond angles, and Van der
Waals forces of a small molecule and attempts to find the most energetically favorable binding
pose within a user-specified search region. One drawback of standard small molecule docking is
that it cannot account for how motions within the region of interest can affect binding of a
molecule as well as an intrinsic difficulty in accounting for solvation patterns and the role of
solvent in binding [4]. Autodock vina [5] was employed to score top ranking compounds
resulting from our ligand based virtual screening efforts. Given the high volume of compounds
(10,000 per lead), this study was limited to rigid docking to the ligand binding domain of LRH-1.
2.2 Molecular Dynamics
Molecular Dynamics (MD) simulation is a very powerful tool often applied for
investigation of biological and biochemical systems. These simulations reveal conformational
and dynamic characteristics at the atomic level, assisting in the interpretation of data obtained
from experiments.
2.2.1 Amber Force Field
The potential energy (V) in MD simulations is a function of the molecular parameters to
describe intra- and inter- molecular forces between atoms in the system. To make computational
calculations tractable, approximations are made to construct a force field, which ultimately
consists of several terms to describe the contributions of bonding and non-bonding interactions
to the potential energy as demonstrate below [6]:
V(R)total = V(R)bonded + V(R)non-bonded Eq. 2.3
The bonded interactions correspond to bond length, angle, and torsion. The non-bonded terms
(LJ) potential to describe van der Waals interactions. Forcefield parameters are
experimentally-derived or calculated using ab initio methods [7]. For example, The Amber Forcefield which is
described as [6]:
𝑈(𝑟1, ⋯ , 𝑟𝑁) = ∑ 𝑘𝑟
2 (𝑟 − 𝑟𝑒𝑞) 2
𝑏𝑜𝑛𝑑𝑠 + ∑
𝑘𝜃
2 (𝜃𝑖− 𝜃𝑖0) 2
𝑎𝑛𝑔𝑙𝑒𝑠 + ∑
𝑉𝑛 2
𝑡𝑜𝑟𝑠𝑖𝑜𝑛𝑠 [1 + cos (𝑛𝜃 −
𝛾𝑖] + ∑ [( 𝐴𝑖𝑗 𝑅𝑖𝑗)
12
− ( 𝐵𝑖𝑗 𝑅𝑖𝑗)
6 ] +
𝑖<𝑗 ∑ 𝑘
𝑞𝑖𝑞𝑗 𝜀 𝑅𝑖𝑗
𝑎𝑡𝑜𝑚 𝑝𝑎𝑖𝑟𝑠 Eq. 2.4
The above potential energy function includes the first four terms for intra-molecular
interactions and the last two terms for inter-molecular interactions. Parameters 𝐾r, 𝐾θ,, and Vn are the
associated force constants for bond, angle, and torsion terms. 𝑟 – 𝑟i represents the change in bond
length from its equilibrium length, 𝜃 − 𝜃i the angle from equilibrium between three
consecutive atoms, the third term (n) the multiplicity, 𝜙 the dihedral angle, 𝛿 the phase shift, and
𝜑 – 𝜑i describes the deviations of the out-of-plane angle from an equilibrium angle [7].
The very last two terms describe intermolecular non-bonded interactions. The first term
of intermolecular non-bonded interactions employs the Lennard-Jones (LJ) to account for the
attractive and repulsive forces between two particles [7], where rij is the distance between
these two particles, A is the attractive force, B the repulsive force Lennard-Jones well depth, and
Rij is the distance between two particles at the minimum potential which has been fitted from
experiment data or quantum calculations. The second term employs a Coulombic potential to
describe electrostatic interaction, where 𝑟ij is the distance between atom 𝑖 and 𝑗, 𝑞i and 𝑞j are the
point charges of them respectively, and 𝜀i is the effective dialectic constant (permittivity of free
𝐹 = −𝛥𝑈(𝑅) = −𝑑𝑈 𝑑𝑅
𝐹 = −𝛥𝑈(𝑅) = −𝑑𝑈 𝑑𝑅
𝐹 = −𝛥𝑈(𝑅) = −𝑑𝑈 𝑑𝑅
𝐹 = −𝛥𝑈(𝑅) = −𝑑𝑈 𝑑𝑅
2.2.2 Newton’s Equations
After the determination of initial coordinates and velocities for a system of all atoms, a
set of classical Newton’s equations of motion (eq. 2.5) are integrated using numerical methods to
obtain a trajectory charting the systems’ motions over a user specified time period.
𝐹 = 𝑚𝑎 = 𝑚𝑑 2𝑅
𝑑𝑡 2 Eq. 2.5
In the eq. 2.5, 𝐹 is the force acting on an atom, 𝑚 is the mass of the atom, 𝑎 is the acceleration,
and R is the position of the atom. The acceleration may also be expressed as the second
derivative of the position of the atom with respect to time, 𝑡. Force can be rewritten as the
gradient of potential energy:
Eq. 2.6
Combination of eq. 2.5 and eq. 2.6 leads to equation 2.7 which describes of the relationship of
the derivative of the potential energy to changes in position with respect to time:
−𝑑𝑈 𝑑𝑅= 𝑚
𝑑 2𝑅
𝑑𝑡 2 Eq. 2.7
Once forces acting on atoms are calculated, the accelerations of all atoms can be obtained along
with new positions and velocities derived within a short timestep. The potential energy function
is used to calculate the forces on the atom in accordance to new positions. All data is saved over
a specified time interval allowing for creation of a simulation trajectory. The fastest motions of
macromolecular systems correspond to about 10 fs, so a timestep on the order of the fs is usually
chosen [8].
To reduce computational expenses the SHAKE [9] algorithm constrains bonds
which employs the Taylor Expansions shown in eq. 2.10 and 2.11:
𝑟𝑛+1 = 𝑟𝑛+ 𝑣𝑛∆𝑡 +1 2(
𝐹𝑛 𝑚) ∆𝑡
2 + 𝑂(∆𝑡3) Eq. 2.8
𝑟𝑛−1 = 𝑟𝑛− 𝑣𝑛∆𝑡 +1 2(
𝐹𝑛 𝑚) ∆𝑡
2− 𝑂(∆𝑡3) Eq. 2.9
In equations 2.10 and 2.11, r is the position at the nth timestep, rn is the position at its previous
timestep, and 𝑟n+1 is the position at its next timestep. Ο(Δt3) is the function of ∆𝑡 with n order or
higher order. When 2.10 and 2.11 are summed one obtains equation 2.12:
𝑟𝑛+1 = 2𝑟𝑛+ (𝐹𝑛
𝑚) ∆𝑡
2+ 𝑂(∆𝑡4) Eq. 2.10
The current position and force exerted on an atom at nthtimestep as well as its previous position
at nth -1timestep is then used to update to a new atomic position at the nth +1timestep [10].
2.2.3 Long Range Interactions
Dealing with long range interactions is difficult, especially with respect to Coulombic
interactions where applying hard cut-offs introduces discontinuities into the forcefield
calculations that can produce artifacts in simulations [11].
𝐸𝑑𝑖𝑟 = − 1 2∑ ∑
𝑁 𝑖,𝑗=1 𝑛
𝑞𝑖𝑞𝑗erf (𝐵|𝑟𝑗−𝑟𝑖+𝑛|)
|𝑟𝑗−𝑟𝑖+𝑛| Eq. 2.11
𝐸𝑟𝑒𝑐 = 1 2𝜋𝑣∑
𝑒( 𝜋2𝑚2
𝛽 2 )
𝑚2 𝑆(𝒎)𝑆(−𝒎)
𝑚≠0 Eq. 2.12
𝐸𝑑𝑖𝑟 = −1 2∑ ∑
𝑁 (𝑖,𝑗)=𝜖𝑀 𝑛
𝑞𝑖𝑞𝑗erf(𝐵|𝑟𝑗−𝑟𝑖|) |𝑟𝑗−𝑟𝑖| −
𝛽
√𝜋∑ 𝑞𝑖 2 𝑁
𝑖=1 Eq. 2.13
𝛽 represents the Ewald parameters, 𝑉 is the volume of the unit cell, 𝑚 is a lattice vector (m1,
m2, m3) in reciprocal space, and 𝑆( m ) is the lattice structure factor.
𝑆(𝒎) = ∑𝑁 𝑞𝑗𝑒(2𝜋𝑖𝒎∙𝑟𝑗)
The scale of Ewald summation is O(N2), where N is the number of atoms in the system.
The Particle Mesh Ewald (PME) method reduces computational expenses by decreasing the scale
of Ewald summation to O(Nlog(N) [11]. In PME, a three-dimensional grid is placed over the
system, atomic charges are mapped to the grid, and then fast Fourier transforms are used to sum
these grid points [11].
2.2.4 Controlling Temperature using Langevin dynamics
In MD simulations, the total energy of the system is conserved. When the total number
of atoms (N) and the volume of the unit cell (V) are fixed, the MD simulation is
considered being conducted in what is called a microcanonical ensemble, a collection of
different microstates belonging to the same macroscopic system. MD simulations can also be
conducted in NVT characterized by fixed atom number, volume, and temperature or NTP
ensemble which is characterized by fixed atom number, temperature, and pressure. In each case,
temperature control is required and these investigations use Langevin dynamics to keep all
systems at a constant temperature [11].
This method assigns a random force and a friction force for each step which is then
related to fluctuation-dissipation theorem [12] to ensure sampling of the NVT data. The
dynamics of atoms are described by Langevin’s equation [11] which is represented by the
following equation:
𝑚𝑟𝑖̈ = −∇𝑈 − 𝑚Γ𝑟̇𝑖 + 𝑊𝑖(𝑡) Eq. 2.15
where 𝑚 is the mass of the particle, 𝑈 represents the particle interaction potential, 𝛤 is
determined from a Gaussian distribution, and 𝑊i(𝑡) changes with a given temperature and times
2.2.5 Pressure control
The NPT ensemble portion of the simulation allows the volume to fluctuate but fixes the
pressure.
𝑃 = 2
3𝑉(𝐸𝑘𝑖𝑛𝑒𝑡𝑖𝑐+ 𝛯) Eq. 2.16
The virial theorem is employed to calculate pressure [13]. 𝑉 is the volume of the unit box, 𝐸kinetic
is the kinetic energy, and 𝛯 is the inner virial tensor for pair-additive potentials defined by
equation 2.19:
𝛯 = −1
2∑𝑖<𝑗𝑟𝑖𝑗 ∙𝑓(𝑟𝑖𝑗) Eq. 2.17
Here, 𝑓(rij) is a force on particle i induced by particle j, and 𝑟ij is the distance between the two
particles. When the system is treated in an isotropic manner, the pressure becomes a scalar and
can be expressed as [13]:
𝑃 =𝑇𝑟(𝑃)
3 Eq. 2.18
Adjusting the inner virial 𝛯 by scaling distances of the inter particle allows for the
correction of the Pressure during the simulation. A piston (𝜎) introduced into the equation of
motion for each atom facilitates variation of the volume of the unit cell when employing a
Nosé-Hoover Langevin piston barostat [13].
2.3 MD Analysis Techniques
2.3.1 Principal Component Analysis(PCA)
Principal Component Analysis is a statistical technique that serves to reduce the
dimensionality of data needed to describe motions in proteins. Principal Component Analysis
involves construction of a covariance matrix from atomic coordinates with covariance being
𝐶𝑖𝑗 = (𝑟⃗⃗ (𝑡) − 〈∆𝑟𝑖 ⃗⃗ (𝑡)𝑖 〉)(𝑟⃗⃗ (𝑡) − 〈∆𝑟𝑗 ⃗⃗ (𝑡)𝑗 〉) Eq. 2.19
Where Cij is the covariance between atoms i and j, 𝑟 is the displacement of atoms i and j, 〈 〉 is
represents a time averaged value. This value is positive when the atoms (or degrees of freedom)
move in the same direction, negative when they move in opposite directions and is zero when
these motions are independent from each other. The covariances are placed into a matrix which
is then diagonalized. The eigenvectors (modes) derived from this process are then ranked by
their associated eigenvalues. The eigenvectors describe the motions (directionality) of degrees
of freedom within the system whereas the eigenvalues describe the magnitude of the covariances
[14]. With this method, the first few modes typically describe a substantial portion of the
protein’s longest timescale motions which, for many systems, are those of the highest biological
relevance [14].
2.3.2 Dynamical Network Analysis
To investigate allosteric communication between the Ligand Binding Domain and the
co-activator Tif-2 in the presence of RJW100 and its derivatives, we employed Dynamical Network
Analysis. Dynamical network analysis employs graph and network theory to describe
coordinated motions within each system. Nodes selected for these studies were non-adjacent
alpha carbons, Cα. Edges are drawn between each of the nodes based upon a distance matrix
constructed per frame of the simulation. Within the distance matrix, edges are drawn between
atoms that are within 4.5A of each other for 75% of the simulation’s duration. The edge
distance, dij, is determined by the log of pairwise correlations, -log[Cij], where Cij is described by
the following equation:
𝐶𝑖𝑗 = 〈∆𝑟⃗⃗⃗ (𝑡)∙∆𝑟𝑖 ⃗⃗⃗ (𝑡)〉𝑗 √〈∆𝑟⃗⃗⃗ (𝑡)𝑖 2〉〈∆𝑟⃗⃗⃗ (𝑡)𝑗 2〉
where:
∆𝑟⃗⃗ (𝑡) = 𝑟𝑖 ⃗⃗ (𝑡) − 〈∆𝑟𝑖 ⃗⃗ (𝑡)𝑖 2〉 Eq. 2.21
With ∆𝑟⃗⃗ (𝑡)𝑖 being the position of the atom that corresponds to the ith node [15].
2.3.2.1 Suboptimal Paths
These are paths most frequently used to transmit a signal. However, certain perturbations
to the structure (changes to the environment) can result in the protein re-organizing itself in a
way that creates another set of slightly longer paths (suboptimal paths) to transmit a signal. This
is primarily why we employ suboptimal paths in these investigations. These pathways are likely
to be very responsive to the binding of different effectors (small molecule agonists) which
function as the source of perturbation to the system that induces rewiring [16].
2.3.3 Grid Inhomogeneous Solvation Theory
To further explore the potential role of crystallographic water molecules located in
LRH-1’s ligand binding pocket, we employed a method called Grid Inhomogeneous Solvation Theory
(GIST) to probe the energetics of the water [17]. GIST allows a user to explore a specific area of
interest within the protein whose solvent dynamics one is interested in. Changes in solvation
patterns are often a key component of ligand recognition motifs. In this investigation, we sought
to determine whether key water molecules located in the binding pocket along with RJW100
were not only dynamically stable as demonstrated by our collaborators, but energetically stable.
Such stability would hint at a potential contribution in LRH-1’s ability to recognize ligands.
This method discretizes equations of Inhomogeneous Solvation theory onto a grid in a
Inhomogeneous Solvation Theory transforms integrals over molecular coordinates to
integrals over distribution functions yielding expressions for various thermodynamic quantities
expressed in terms of correlation functions [17].
These quantities ultimately contribute to the following expression:
∆G= ∆Esw+∆Eww+∆STrans+ ∆Sorient Eq. 2.22
This theory calculates solvation entropies in the following way:
∆Ssolv = ∆Sww+ ∆Ssw Eq. 2.23
ΔSsw describes solute-water (sw) correlations and ΔSww water-water (ww) correlations. The
solute-water term is defined as:
𝑆𝜔(𝒓) ≡−𝑘𝐵
8𝜋2∫ 𝑔𝑠𝑤(𝒓, 𝜔) lng𝑠𝑤(𝒓, 𝜔) 𝒅𝒓𝒅𝜔 Eq. 2.24
This truncation only accounts for solute water correlations. KB is Boltzmann’s constant, gsw (r,ω
) describes the solute water pair correlation with the solute as the frame of reference. 1/ 8π is the
normalization factor of the orientation integrals [17].
One may approximate ΔSsolv as ΔSsw because the correlation integral g approaches unity
for bulk solvent, and the solute-solvent correlation function approaches unity with increasing
distance from the solute as well. Given this, the integrand decays to zero as distance increases
between the solvent and solute and thus reasonable to treat Ssolv as a local integral around the
solute [17].
This allows the solute-water term to be broken down into orientational and translational
entropies:
Gist calculates these values by analyzing a volume that includes solute and a solvent region of
interest. It discretizes these values into grid boxes k of volume Vk centered on a location rk.
Translational entropies can be calculated as follows:
∆𝑆𝑠𝑤𝑡𝑟𝑎𝑛𝑠(𝒓𝑘) ≡ −𝑘𝐵𝜌0∫ 𝑔(𝒓𝒌) ln 𝑔(𝒓)𝑑𝒓 Eq. 2.26
Where this integral is over gridbox k and g(r) is treated as uniform over each grid box, and 𝜌0 is
the density of oxygens per voxel, where g(rk) is estimated based upon the amount of simulation
frames through the following equation:
𝑔(𝒓𝒌) = 1 𝜌0𝑁
𝑓
∑ 𝑛𝑖,𝑘 𝑉𝑘 𝑁𝑓
𝑖=1 Eq. 2.27
Here Nf is the frame indexing and nik is the number of waters per within box k per frame.
The total translational entropy is calculated via summation of ∆𝑆𝑠𝑤𝑡𝑟𝑎𝑛𝑠(𝒓𝑘) :
∆𝑆𝑠𝑤𝑡𝑟𝑎𝑛𝑠 = ∑ ∆𝑆𝑠𝑤𝑡𝑟𝑎𝑛𝑠(𝒓𝑘) Eq. 2.28
Orientational entropies are calculated via the following equation:
∆𝑆𝑠𝑤𝑜𝑟𝑖𝑒𝑛𝑡(𝒓
𝑘) ≡ 𝜌0∫ 𝑔(𝒓) 𝑆𝑘 𝜔(𝒓𝑘)𝑑𝒓 Eq. 2.29
With Sω, the localized orientational entropies described as the following:
𝑆𝜔(𝒓𝒌) ≡ −𝑘𝐵
𝑉𝑘8𝜋2∫ 𝑘∫ 𝑔𝑟 𝑠𝑤(𝜔|𝒓) ln[𝑔𝑠𝑤(𝜔|𝒓)]𝒅𝝎𝑑𝒓 Eq. 2.30
and total orientational entropy described like so:
∆𝑆𝑠𝑤𝑜𝑟𝑖𝑒𝑛𝑡 = ∑ 𝑛𝑘 𝑘,𝑎𝑣𝑔𝑆𝑘𝜔` Eq. 2.31
where 𝑛𝑘,𝑎𝑣𝑔 is the mean number of water molecules found in box k per frame of the simulation:
𝑛𝑘,𝑎𝑣𝑔 = ∑ 𝑛𝑖,𝑘 𝑁𝑓 𝑵𝒇
𝒊=𝟏 Eq. 2.32
These values in combination with calculated energies summed over grid box k as described by
∆𝐸𝑠𝑤 = ∑ 𝐸𝑠𝑤(𝒓𝑘) Eq. 2.33
Where:
𝐸𝑠𝑤(𝒓𝑘) = ∫ ∆𝐸𝒌 𝑠𝑤𝑙𝑜𝑐(𝒓)𝑑𝒓 Eq. 2.34
can be used to calculate free energy values as described in [17].
2.4 Experimental Procedure
Model Construction
LRH-1·TIF2 complexes bound to agonists RJW100 (pdb 5L11) and 65endo were
constructed. The crystal structures for these complexes were provided by the Ortlund group at
Emory University. Chimera modeler was employed to model in the density between residues
527 and 530 using pdb 4DOS as the template structure.
MD Simulations and Selected Analysis Techniques
Wildtype LRH-1·TIF2 systems complexed with RJW100 and 65endo were simulated. In
addition, we simulated a T352V mutant of LRH-1·TIF2 complexed with RJW100. All systems
were solvated in a 0.15M NaCl, TIP3P waterbox with 10Å distances between the edges of the
solute and the box. Simulations were run using pmemd in Amber14 [6] with the amber ff14SB
and the general amber force field (GAFF) which is designed to parameterize organic molecules
(drug-like compounds which contain O, S, N, P, H, and C) [18]. Key torsions in each ligand
were optimized in Guassian 09 [19]. Point charges were assigned to each agonist using
Antechamber in Ambertools and the AM1-BCC charge model. Bonded and short-range
interactions were evaluated every 2fs, with long-range electrostatics evaluated with Particle
Mesh Ewald method [11]. Short-range nonbonded interactions were evaluated using a 10Å
cutoff. SHAKE [9] was employed to fix bonds between hydrogens and heavy atoms. Each
steepest decent and the remaining switching to conjugate gradient minimization. This process
was evenly split (10,000 steps each). Solvent molecules were first minimized followed by the
whole system. This was then followed by 500ps of dynamics in the NVT ensemble, during
which the system was heated from 0 to 300 K with positional restraints applied to the solute
(protein and small molecules). Finally, 8 NPT ensemble simulations were performed at 1atm for
2ns each, with each stage releasing the positional restraints, first on the protein, followed by each
agonist. Sidechains were released before backbone atoms. 200ns of unrestrained NPT was
performed. PCA and Dynamical Network analysis was performed on 10000 evenly spaced
frames from the simulations and GIST was performed on 1000 frames of the same simulation.
Principal Component Analysis was performed on all backbone heavy atoms of LRH-1
bound to RJW100 and Tif-2 (pdb 5L11). Dynamical Network Suboptimal path analysis was
limited to non-adjacent alpha Carbons (Cα) for the complexes bound to RJW100 and 65endo.
The offset employed for suboptimal path generation was set to 50.
GIST Analysis involved placement of a Grid over LRH-1·Tif-2 and RJW100 with
dimensions of 106 Ȧ3, with 0.5Ȧ spacing per voxel. The grid was centered on the geometric
center of RJW100. One analysis of energetics restricted the area of interest to those within a
4.5𝐴̇ volume of agonist RJW100 using the procedure described in [17]. Another analysis was
performed by grouping solvent properties in the region of interest as described in [17]. In this
case, analysis was performed by imposing restrictions only including solvent with a water
density(gO) above 1.0 and total (summed water-water and water-solute) enthalpy value less than
-0.5 kcal/mol/Ȧ3 and integrating (summation of grid voxels) to find thermodynamic values as
described in [17]. From here, thermodynamic values were derived for regions corresponding to
Virtual Screening Protocol
Our virtual screening protocol is outlined in scheme 1. Crystal structure binding poses of
RJW100, 65endo, and 8AC served as templates. Openeye OMEGA was employed to generate
conformers for each template [1]. All templates were screened with ROCS based upon shape
overlap with NCI database compounds. The top 10000 were scored using Tanimoto Combo
score and then docked to LRH-1 with Autodock vina [5]. Derivatives 8AC and 65endo are more
polar and thus were also screened for electrostatic similarity after screening for shape similarity.
To optimize overlap based on both electrostatics and structure, the top 10000 compounds in said
cases were ranked through equal weighting and summation of associated Eon Tanimoto Combo
and Tanimoto Combo scores [2,3]. The resulting set of compounds was also docked to
corresponding LRH-1 structures. Structural waters of each structure were retained to more
accurately represent specific water contacts within the binding pocket and to reproduce the
Figure 2.1. Protocol for Virtual Screening of LRH-1.
Figure 2.2. Search spaced employed for docking of candidates identified in the ligand based component of virtual screening.
2.5 References
1. Hawkins, P.C.D., et al., Conformer Generation with OMEGA: Algorithm and Validation
Using High Quality Structures from the Protein Databank and Cambridge Structural
Database. Journal of Chemical Information and Modeling, 2010. 50(4): p. 572-584.
2. Hawkins, P.C.D., A.G. Skillman, and A. Nicholls, Comparison of Shape-Matching and
Docking as Virtual Screening Tools. Journal of Medicinal Chemistry, 2007. 50(1): p.
74-82.
3. EON 2.2.0.5: OpenEye Scientific Software, Santa Fe, NM. http://www.eyesopen.com.
4. Mohan, V., et al., Docking: successes and challenges. Current pharmaceutical design,
2005. 11(3): p. 323-333.
5. Trott, O. and A.J. Olson, AutoDock Vina: improving the speed and accuracy of docking
with a new scoring function, efficient optimization, and multithreading. J Comput Chem,
2010. 31(2): p. 455-61.
6. Case, D.A., et al., The Amber biomolecular simulation programs. Journal of
Computational Chemistry, 2005. 26(16): p. 1668-1688.
7. Chen, J. and K.N. Houk, Molecular Modeling: Principles and Applications By Andrew
R. Leach. Addison Wesley Longman Limited: Essex, England, 1996. 595 pp. ISBN
0-582-23933-8.
8. Jo, J.C. and B.C. Kim, Determination of proper time step for molecular dynamics
9. Ryckaert, J.P., Ciccotti, G. and Berendsen, H.J., 1977. Numerical integration of the
cartesian equations of motion of a system with constraints: molecular dynamics of
n-alkanes. Journal of Computational Physics, 23(3), pp.327-341.
10. Verlet, L., Computer "Experiments" on Classical Fluids. I. Thermodynamical Properties
of Lennard-Jones Molecules. Physical Review, 1967. 159(1): p. 98-103.
11. Darden, T., D. York, and L. Pedersen, Particle mesh Ewald: An N⋅log(N) method for
Ewald sums in large systems. The Journal of Chemical Physics, 1993. 98(12): p.
10089-10092.
12. Hünenberger, P.H., Thermostat algorithms for molecular dynamics simulations.
Advanced computer simulation, 2005: p. 130-130.
13. Kubo, R., The fluctuation-dissipation theorem. Reports on Progress in Physics, 1966.
29(1): p. 255.
13. Feller, S.E., et al., Constant pressure molecular dynamics simulation: The Langevin
piston method. The Journal of Chemical Physics, 1995. 103(11): p. 4613-4621.
14. David, C.C. and D.J. Jacobs, Principal Component Analysis: A Method for Determining
the Essential Dynamics of Proteins. Methods in molecular biology (Clifton, N.J.), 2014.
1084: p.193-226.
15. Stone, J., et al., Dynamical Network Analysis. 2012.
16. Bhattacharyya, M., S. Ghosh, and S. Vishveshwara, Protein structure and function:
looking through the network of side-chain interactions. Current Protein and Peptide Science,
17. Nguyen, C.N., T.K. Young, and M.K. Gilson, Grid inhomogeneous solvation theory:
Hydration structure and thermodynamics of the miniature receptor cucurbit[7]uril. The
Journal of Chemical Physics, 2012. 137(4): p. 044101.
18. Wang, J., et al., Development and testing of a general amber force field. Journal of
Computational Chemistry, 2004. 25(9): p. 1157-1174.
3 RESULTS AND DISCUSSION
3.1 PCA and Cross-correlation Analysis
We conducted PCA studies on LRH-1·TIF2 in presence of RJW100. PCA allows us to
specifically focus on major motions that occur upon binding of RJW100. We analyzed the first
four modes, identifying two principle components of interest. A breathing motion at the mouth
(characterized by H2, H3, H7, and β-H6) of the LBP, between H2 and H6 designated as PC2,
and a breathing motion between H8 and H9 as PC1 as implied by the porcupine plots (Fig. 3.1C,
D). Of note in the porcupine plots is how PC1 (Fig. 3.1C) features H2, H3, and β-H6 converging
inward towards one another other as well as an outward swing of H9 relative to H8 which
mimics the profile of DLPC complexed to LRH-1·TIF2 (Fig. 1.7A) [1]. Figure 3.2D shows
β-H6 and H2 and H3 swinging outward with respect to each other. Plotting these PCs versus one
another allows for another way to visualize the result (Fig. 3.1A). PC1 is clustered in one region
of the PC1-PC2 subspace around a centroid of 10 whereas PC2 is divided into two distinct
clusters clustered around centroids of 10 and -10. These patterns are not consistent with
LRH-1·TIF2 systems possessing an agreement status as identified in [1]. However, it is possible that
the difference in the patterns observed reflect the differing binding modes of the compounds.
The contacts that DLPC makes with the mouth of LRH-1’s LBD may explain the single cluster
of PC1-PC2 conformational space (Fig. 1.7C) [1]. RJW100 does not engage in these same
contacts and instead binds deep inside of the LBP. This suggests that highly concentrated
subspace at the mouth of the LBP is not a requirement in transcription-activated conformations
when LRH-1 is bound to non-PL agonists.
Despite the dissimilarities with PL studies, these results are consistent with hydrogen
complex to RJW100 (Fig. 1.11). In comparison to DLPC, RJW100 binding results in rapid
exchange with deuterium in β-H6 and H10, which all contribute to the mouth of LRH-1’s
binding pocket [2]. This rapid exchange suggests that the mouth of the LBP is more dynamical
versus DLPC and our PCA results indicate that two distinct conformations exist about the mouth
of the LBP.
High levels of LRH-1-mediated transcriptional activity require selective co-activator
recruitment and HDX studies of DLPC binding versus longer tailed PLs imply that some
destabilization of the LBP (specifically β-H6) is associated with enhanced selectivity [3].
Computational studies reveal that DLPC binding results in highly correlated motions between
H4-7 and anti-correlated motions between these helices and the AF-H (Fig. 3.2A) and it is
suggested that this profile of correlated motions predicts high levels of activation [4]. Figure
3.1B, featuring the RJW100 complex shows a different pattern where there are no particularly
highly correlated or anti-correlated motions between the same regions. Instead, the
cross-correlation patterns that characterize RJW100 binding resemble systems with disagreement
statuses (Fig. 3.2, B versus C) [1] except that motions in H3-5 and H7-9 as well as those in
H1-H3 and the AF-H are more highly correlated than those in both the Apo LRH-1·TIF2 and the
DLPC complexed systems. These results reinforce the idea that the profile of correlated motions
in DLPC complexed LRH-1 are not a requirement to enhance levels of transcriptional activity
significantly above basal levels, but instead may be an essential characteristic of activated
structures that trigger very high levels of transcriptional activity [2].
3.2 Investigation of Solvent Energetics within LRH-1’s Ligand Binding Pocket
RJW100 binding affinity is largely attributed to the ability of Thr352 to anchor the ligand