Georgia State University
ScholarWorks @ Georgia State University
Nutrition Theses Department of Nutrition
Summer 7-18-2017
Effects of Advertising Methods on Fruit
Consumption in Sixth-Grade Population
Teryn Keller Georgia State University
Follow this and additional works at:https://scholarworks.gsu.edu/nutrition_theses
This Thesis is brought to you for free and open access by the Department of Nutrition at ScholarWorks @ Georgia State University. It has been accepted for inclusion in Nutrition Theses by an authorized administrator of ScholarWorks @ Georgia State University. For more information, please contact
Recommended Citation
Keller, Teryn, "Effects of Advertising Methods on Fruit Consumption in Sixth-Grade Population." Thesis, Georgia State University, 2017.
NOTICE TO BORROWERS
All theses deposited in the Georgia State University library must be used in accordance with the stipulations prescribed by the author in the preceding statement. The author of this thesis is:
Teryn Keller
400 Village Parkway NE, Unit 105 Atlanta, GA 30306
The director of this thesis is:
Huanbiao Mo, PhD Chair and Professor Department of Nutrition
Byrdine F. Lewis School of Nursing and Health Professions Georgia State University
VITA
Teryn Keller
ADDRESS: 400 Village Parkway NE, Unit 105 Atlanta, GA 30306
EDUCATION: M.S. 2017 Georgia State University Health Sciences
B.S. 2013 The University of Georgia Journalism and Communications
PROFESSIONAL EXPERIENCE:
• Part-Time Instructor and Graduate Teaching Assistant 2016-Present Department of Nutrition
Georgia State University, Atlanta, GA
• Nutrition Educator 2015-2016
After School All-Stars, Atlanta, GA
• Local Media Activation Assistant 2014-2015
Carat USA, Atlanta, GA
• Nutrition Action Healthletter Intern 2013
Center for Science in the Public Interest, Washington, D.C.
PROFESSIONAL SOCIETIES AND ORGANIZATIONS
• Academy of Nutrition and Dietetics, Member 2015-Present
• Georgia Academy of Nutrition and Dietetics, Member 2015-Present
• Greater Atlanta Dietetic Association, Member 2015-Present
ABSTRACT
EFFECTS OF ADVERTISING METHODS ON FRUIT CONSUMPTION IN SIXTH-GRADE POPULATION
by
Teryn Keller
Background: The HHFKA authorizes funding and establishes policy for USDA’s child
nutrition programs including the NSLP and the SBP to align with the DGA. It is
inconclusive whether these dietary requirements increase healthy food selection let alone
increase consumption because data is difficult to track, and plate waste studies are time
consuming and labor intensive. Several studies have shown an association between
advertising methods and increased fruit selection. However, research examining the
degrees of impact these advertising methods have on student selection and consumption
is lacking.
Purpose: The purpose of this study was to investigate whether different methods of
advertising in school cafeterias have different effects on influencing children’s food
choices. The researchers predicted branding would have the greatest effect on fresh fruit
selection and consumption. Fresh fruit selection and consumption were observed in a
sixth-grade student population during school lunch with majority of students participating
in the free and reduced lunch program.
Methods: An average of 412 student selection observations and 200 student consumption
group for each treatment. The three treatment groups consisted of branding, digital
advertising, and variety.
Results: This study found that digital advertising and variety had a significant effect on
students’ fruit selection during school lunch by 8.5% and 17.6%, respectively. Digital
advertising and branding had a significant decrease on student consumption, but variety
increased consumption by 0.9%.
Conclusion: In conclusion, advertising methods can increase the selection of fresh fruit,
but additional strategies such as nutrition education, garden-based learning, and taste tests
EFFECTS OF ADVERTISING METHODS ON FRUIT CONSUMPTION IN
SIXTH-GRADE POPULATION
by
Teryn Keller
A Thesis
Presented in Partial Fulfillment of Requirements for the Degree of
Master of Science in Health Sciences
The Byrdine F. Lewis School of Nursing and Health Professions
Department of Nutrition
Georgia State University
Atlanta, GA
ii
ACKOWLEDGMENTS
iii
TABLE OF CONTENTS
Table of Contents………....iii
List of Tables……….…….iv
List of Figures……….….v
Abbreviations……….….vi
Chapter I. INTRODUCTION………..….1
II. LITERATURE REVIEW………...…….5
Branding.………..……5
Digital Advertising………...7
Variety………..8
III. METHODS………10
IV. RESULTS………..13
V. DISCUSSION AND CONCLUSION………...19
Discussion………..19
Conclusion……….22
iv
LIST OF TABLES
Table Page
1. Demographic Data of Study Population………11
2. Intervention Group and Fruit Served During School Lunch……….14
3. Number and Percent of Participants Among the Control and Intervention Groups of Sixth-grade Students Fruit Selection……...………..13
v
LIST OF FIGURES
Figure Page
1. The Effect of Branding on Fruit Selection..………..….….15
2. The Effect of Digital Advertising on Fruit Selection..………...….15
3. The Effect of Variety on Fruit Selection..……….………..……16
4. The Effect of Branding on Fruit Consumption……….……..17
5. The Effect of Digital Advertising on Fruit Consumption……….……..17
vi
ABBREVIATIONS
CDC
DGA
HHFKA
NSLP
PBH
POS
SBP
SFA
USDA
Centers for Disease Control and Prevention
Dietary Guidelines for Americans
Healthy Hunger-Free Kids Act of 2010
National School Lunch Program
Produce for Better Health Foundation
Point of Sale
School Breakfast Program
School Food Authority
1
CHAPTER I
Introduction
Childhood obesity affects 12.7 million children and about 17% of the population
aged 2-19 years old, according to the Center for Disease Control and Prevention (CDC).1
The Healthy, Hunger Free Kids Act of 2010 (HHFKA) authorizes funding and
establishes policy for United States Department of Agriculture (USDA) child nutrition
programs including the National School Lunch Program (NSLP) and the School
Breakfast Program (SBP) to align with the Dietary Guidelines for Americans (DGA).2
Under this Act, schools are required to increase the availability of fruits, vegetables,
whole grains, and fat-free and low-fat fluid milk, reduce levels of sodium, saturated fat,
and trans fat in school meals, and meet nutritional needs within a child’s calorie
requirement.2 A study using national data found that these changes, such as the removal
of sugar-sweetened beverages from school vending machines, were associated with lower
likelihood of obesity and overweight students.3 Johnson et al. (2016), a longitudinal study
in Washington state noted an increased mean adequacy ratio from a mean of 58.7 prior to
policy implementation to 75.6 after policy implementation and decreased energy density
from a mean of 1.65 to 1.44.4 However, there is not conclusive evidence to demonstrate
these standards have positive effects in the majority of schools. Cohen et al. (2012)
reports only about 60% of foods served at lunch were consumed, and only half the
calories served were consumed after the NSLP standards were implemented.5 These
2
consumption, a controversial topic that has recently made headlines and resulted in the
liberalization of nutrition regulations of the HHFKA.6 However, studies comparing food
waste, especially in fruits and vegetables, before and after the new school meal standards
are limited because they are time-consuming and labor intensive.
In an effort to decrease food waste, a provision called “offer vs. serve” allows
students to decline foods they do not intend to eat and select three or more distinct meal
components including a fruit or vegetable.7 School cafeteria production records or point
of sale (POS) purchases made by students do not account for food waste, so only
selections can be easily tracked, leaving the question of how much students are
consuming unanswered. The Smarter Lunchrooms Initiative encourages schools to
implement cost effective or no cost strategies to encourage children to make healthier
choices in the lunch room. The Smarter Lunchrooms categories include “Focus on Fruit,
Vary the Vegetables, Highlight the Salad, Move More White Milk, Boost Reimbursable
Meals, Lunchroom Atmosphere, Student Involvement, and School Community
Involvement.”8 “Focus on Fruit” strategies include: at least two kinds of fruit are offered,
sliced or cut fruit is offered, a variety of mixed whole fruits are displayed in nice bowls or
baskets (instead of stainless steel pans), fruit is offered in at least two locations on all
service lines, one of which is right before each POS, at least one fruit is identified as the
featured fruit-of-the-day and is labeled with a creative, descriptive name at the point of
selection, and a fruit taste test is offered at least once a year.9 In school year 2013-2014
approximately 56% of School Food Authorities (SFA) reported awareness of the Smarter
3
used at least one strategy in each category. Almost 90% of SFAs reported some or all of
their schools used strategies from two or more categories.10
Scientists have pegged several factors as the scapegoats for the childhood obesity
epidemic, one of these being the community environment in which children live,
including the lack of accessibility to places to play and be active, variation in licensure of
child care centers, restricted access to healthy foods, increased portion sizes, lack of
breastfeeding support, and one particular area of interest: the advertising of less healthy
foods.1 Nearly half of middle and high schools in the United States allow advertisements
of less healthy foods, including foods high in total calories, fat, salt, sugars, and low in
nutrients.11 Furthermore, the media targets children and adolescents with advertisements
for these types of foods.11 The Institute of Medicine concluded, “food advertising to
children affects their preferences, purchasing behaviors, and consumption habits for
different food and beverage categories, as well as for different product brands.”11 In
schools, these advertising strategies include posters and signage, logos or brand names on
food and beverage coolers, using food sales as fundraisers, events sponsored by
corporations, use of advertising in school publications, and classroom curricula and
scholarships sponsored by corporations.11 The CDC proposes that such advertising may
have an impact on children and their food choices.11 Cornell University conducted a
study that sought to answer whether branding can improve school lunches and found that
it does, in fact, have a profound effect on the food choices of children.12 The PBH
Foundation emphasized the importance of increasing the prominence of fruits and
vegetables in comparison to less healthy options, citing research that examined the effects
4
lacking in examining how different advertising strategies might have different degrees of
impact on students and their food choices. To that end, this study seeks to fill those gaps
and to investigate whether some methods of advertising have a greater impact on food
choices than others. The main research question this study seeks to answer is whether
different methods of advertising in school cafeterias during school lunch have different
impacts on the food choices they make and if these methods affect student consumption.
The researchers hypothesize that all three methods will influence the choices they make,
but that branding method will exhibit the greatest influence on selection and
consumption.
Study results have the potential to improve food choices in schools because
advertising methods that prove most effective could be utilized to change the
environment of school cafeterias and encourage healthier diets. A national study showed
having fruits and vegetables available wherever foods were sold, offering only low-fat
and fat-free milk, and having three or more USDA standard components were associated
with significantly lower odds of overweight students and obesity in high school students.3
School nutrition has great significance in the realm of childhood obesity because it is one
of the few environments where student’s make food choices independent of direct
influence of parents and other adults. Improved nutrition in schools could ultimately
5
CHAPTER II
Literature Review
Children do not eat enough fruits and vegetables, and evidence shows frequent
consumption of fruits and vegetables is inversely associated with obesity, highlighting the
need for effective interventions to encourage changes leading to healthier eating habits.14
A variety of scalable, inexpensive environmental changes has proven to promote healthy
eating and decrease waste in school cafeterias.12,15,16 Choices are often made with little
thought or effort, shedding light on the high price for prominent shelf space at
supermarkets and impulse purchases at the cash register or POS. Variety has proven to be
effective in multiple studies.17,18 People consume more when they have options,
especially if they are allowed to choose more than one item.13 Branding is constantly
being used by packaged food companies to increase sales, and the strategy has proven to
be effective, which is why companies such as Coca-Cola spend billions of dollars on
advertising each year.19
Branding
Marketing through branding includes a variety of techniques: celebrity
endorsements, licensed media characters, or messages that advertise a product’s attributes
such as flavor, taste, nutritional value, or convenience.20 However, Bragg et al. (2013)
found products that incorporate popular athletes, sports teams, and physical activity into
packaged food and beverages often do not meet nutritional standards.21 Branding is
effective in promoting unhealthy foods, but the same technique can be used to promote
6
The Dixon et al. (2014) study looked at a different aspect of branding:
counter-advertising. Counter-advertising has been used for years to promote unhealthy foods
through health claims, celebrity endorsements, and emotion to create a positive attitude
toward a brand. However, counter-advertising could provide a strategy for reducing the
unhealthy food advertising to parents while promoting healthier food. The 2 x 2 x 5
between-subjects study tested a control group against two counter-advertisements
(content claim and sports celebrity endorsement). Results showed that compared to the
control, parents who saw the counter-advertisement were less likely to buy into the
unhealthy food claims and were less inclined to purchase these unhealthy foods,
suggesting counter-advertising can reduce misleading influence of unhealthy food
marketing.22
The Hanks, Just and Bromberg (2016) study tested the effects of marketing
vegetables in elementary school cafeterias and vegetable consumption. Three treatment
conditions were tested: a vinyl banner displaying vegetable characters that were fastened
around the base of the salad bar; short television segments with health education
delivered by vegetable characters; or a combination of the two. Students took
significantly more vegetables from the salad bar when exposed to the vinyl banner and
the vinyl banner in combination with the television segments. Branded media can make a
large impact on children’s school lunch selection underlining the opportunity for
marketers and children to benefit from branded media in the lunchroom. Media can be
presented in a positive way to encourage children to make better choices.15
The prevalence of branding processed, packaged foods to increase the
7
of packaged foods, Wansink, Just and Payne (2012) studied whether healthy foods could
be branded in the same way to increase attractiveness and consumption by children.
Children were offered an apple with a branded Elmo sticker vs. a plain apple in
competition with a cookie. The Elmo sticker almost doubled the choice of apples
compared with the pretest control (baseline choice). However, there was no effect of the
Elmo sticker on the cookie. The study suggests that branding healthy food choices such
as fruits and vegetables may persuade children to make healthier choices in competition
with more packaged, highly processed foods. This type of branding can also be applied to
age groups who have not yet learned or mastered reading.12
Variety
Variety and effects on food intake were closely studied in the 1980’s. Rolls et al.
(1980) tested whether having a variety of foods in a single meal increased food intake.
Previous studies allude that, “as a particular food is eaten, its taste becomes less pleasant,
but the taste of other foods remains relatively unchanged.”18 The study compared a
variety of foods in succession during a meal to intakes when the same food was offered.
Results showed a significant increase in food consumption when a variety of food was
offered. For example, subjects ate significantly more when three flavors of yogurt were
offered. Flavors were distinctive in taste, texture, and color. However, when subjects
were offered three flavors of yogurt differing only in taste, there was not a significant
increase in food intake.18 School lunch strives for children to eat more at lunch, ensuring
they are receiving an adequate number of calories and that they are consuming healthy
and nutritious foods. Incorporating a variety of foods instead of the same foods
8
The Bucher, Horst and Siegrist (2011) study tested the effects of variety on
vegetable consumption. The first two groups were only offered one vegetable side, and
the third group was offered two vegetable sides. Participants who had a variety of
vegetables to choose from consumed significantly more calories from vegetables
compared to the participants who were offered only one choice. Having a choice of
vegetables increases an individual’s likeliness to choose and consume more vegetables.17
This strategy can be easily replicated in a school cafeteria environment, encouraging
young students to try a variety of fruits and vegetables.17
Jansen et al. (2010) tested 94 children who were presented with both visually
appealing fruit through color and shape and regular fruit. The study compared fruit’s
visual appeal to the visual appeal of candy, which often possesses a variety in color and
shape. This study sought to find what attributes of sweets make them attractive to
children by applying the attributes to fruit, and found visual appeal had a strong effect on
consumption of fruit.23
Digital Advertising
The use of technology among children and adolescents has changed in recent
years. Mobile marketing is particularly advantageous to marketing food and beverage to
youth because 95% of adolescents are online and 37% report owning a smartphone.
Youth also appear to be more vulnerable to “stealth” advertising, enticing ads,
promotions, and product placements.24 Several characteristics make adolescents a
primary target for digital marketing including their role in adopting new media early,
9
elements to target the adolescent population and pose particular risk by increasing
adolescent consumption of the unhealthy foods these companies offer.
In the 2009 Pempek and Calvert study, results suggested online advergames, or
online games that help market a product, market unhealthy foods effectively. However,
these advertising methods were also successful in advertising healthier foods and
beverages. Children who played the healthier version of the advergame selected and ate
significantly healthier snacks than those who played the less healthy version.26
Technology used to market unhealthy products can be used to market healthy products in
the same way. Marketing healthier products could help children select healthier food
items and thereby help relieve the obesity epidemic.
In the Blanchette and Brug (2005) study, a computer/multimedia channel
intervention combined entertaining aural, visual, and text-based messages with nutrition
education. This intervention resulted in increased consumption of one serving of fruit and
vegetable a day.27 However, these technology-based nutrition education programs are
expensive. This study also suggests exposure to television advertisements of less healthy
10
CHAPTER III
Methods
This study utilized sixth-grade students during their lunch period. Sixth-grade
students were chosen for several reasons. Research has shown children have a powerful
allegiance to certain brands when that brand has been marketed to them over time, which
has dictated their attachment to many unhealthy foods.28 Because children are easily
influenced, this study showed whether it is possible to influence their decisions towards
healthier choices. The ages of participants range from 10-years-old to 12-years-old,
including males and females.
The study took place in a metro Atlanta school, which provided an environment
where children are free to make food choices independent of direct influence from their
parents. Additionally, the data were more quantifiable and accessible in a school, as
children do not typically make their own purchases at a grocery store, and grocery store
selections could be difficult or impossible to measure when working with a population of
children. The study used a public rather than private school since private schools likely
represent a specific sect of the population of children of a higher socioeconomic status.
The school has 64.6% students enrolled in the free and reduced lunch program to
represent a prominent school lunch participation rate. The school has a diverse
demographic background and a multiplicity of races, ethnicities, and socioeconomic
classes to ensure that the sample population represents the tendencies of the whole
population. It does not reflect any one specific interest, for example, an art school with a
11
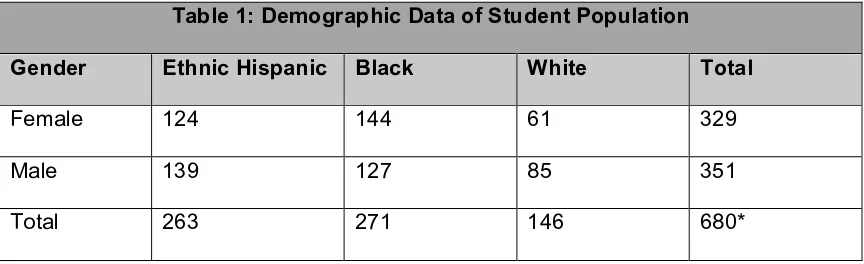
Table 1: Demographic Data of Student Population Gender Ethnic Hispanic Black White Total
Female 124 144 61 329
Male 139 127 85 351
Total 263 271 146 680*
*This number represents the total number of students at participating school.
Branding, digital advertising, and variety were tested in this study. This study
required six separate trials: three trials on control days, testing the baseline preferences of
children at three separate lunch periods, and three trials on the days of the experiment,
with each trial utilizing a different advertising strategy. Three separate controls were
conducted because three different fruits were served on days of experiment. The lunch
periods included children from various sixth-grade classes in each period, with no pattern
associated with ability or special interests in each period. On day one, a control trial was
achieved to get a baseline assessment of the childrens’ food preferences. During the
control trial, no methods of advertising were used. The children went through the lunch
line as they normally would on a typical day. This was repeated on days two and three.
During the branding trial, the whole fruit was served with a sticker. During the digital
signage trial, a fruit was advertised using the application, MealViewer on television
screens located in front of the lunch line. During the variety trial, a variety of fruit
through color and type was offered. These trials occurred on days four, five, and six. All
trials were conducted over a two-week period. Student selections were recorded with a 0
or 1 (0=not selected, 1=selected). The student selections were collected and input into a
12
each lunch period on a scale of 1-5 (1=none consumed, 2=1/4 consumed, 3=1/2
consumed, 4=3/4 consumed, 5=all consumed).
Table 2. Intervention Group and Fruit Served During School Lunch
Intervention Group Fruit
BrandingControl Apple
Branding Applewith sticker
DigitalAdControl Banana
DigitalAd Bananawith MealVieweradvertisement
Variety Control Grapes
13
CHAPTER IV
Results
An average of 430 student selection observations were collected, and an average
of 200 student consumption observations were collected over the course of the six-day
study. Three days of control data were collected without an advertising intervention. On
the intervention days, data were collected with the corresponding treatment: branding,
digital advertising, and variety. The proportion of students who obtained the lunch item
within each control and intervention group was calculated. There was a 3.2% increase
(P=0.347) in student selection between the control group and the branding intervention
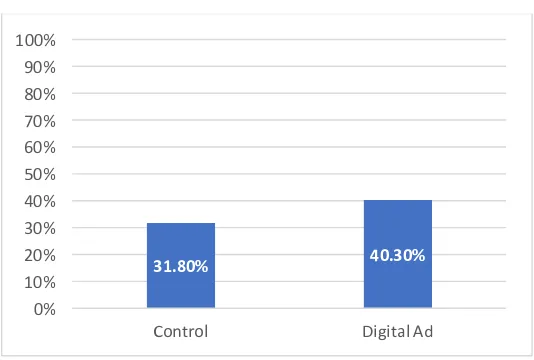
group, a significant (P=0.007) 8.5% increase in student selection between the control
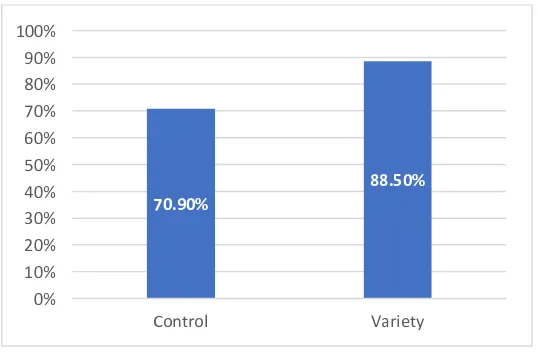
group and the digital advertising intervention, and a significant (P=0.000) 17.6% increase
in student selection between the control group and the variety intervention. Figures 1-3
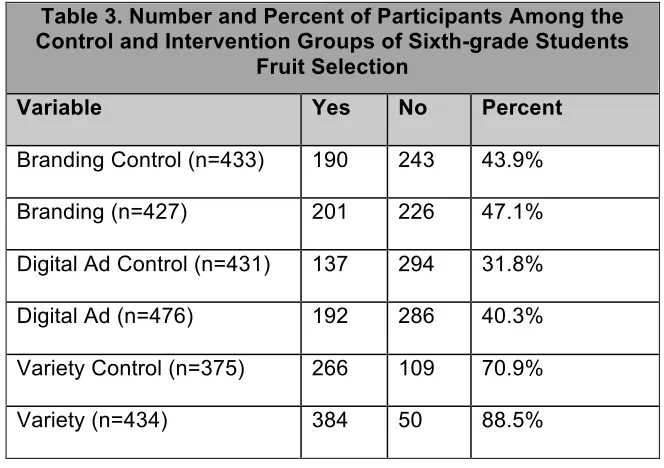
give detailed comparisons and Table 3 gives proportions of student selection data. We
compared the p-values with an adjusted significance level of 0.017 since we are
14
Table 3. Number and Percent of Participants Among the Control and Intervention Groups of Sixth-grade Students
Fruit Selection
Variable Yes No Percent
Branding Control (n=433) 190 243 43.9%
Branding (n=427) 201 226 47.1%
Digital Ad Control (n=431) 137 294 31.8%
Digital Ad (n=476) 192 286 40.3%
Variety Control (n=375) 266 109 70.9%
15
Figure 1. The effect of branding on fruit selection. Values are percent of participating students who
chose fruits. P = 0.347.
Figure 2. The effect of digital adertising on fruit selection. Values are percent of participating students
who chose fruits. P = 0.007.
43.90% 47.10% 0% 10% 20% 30% 40% 50% 60% 70% 80% 90% 100% Control Branding 31.80% 40.30% 0% 10% 20% 30% 40% 50% 60% 70% 80% 90% 100%
[image:28.612.222.489.332.512.2]16
Figure 3. The effect of variety on fruit selection. Values are percent of participating students who chose
fruits. P = 0.000.
For the secondary measurement of how much of the side item was consumed, the
Mann-Whitney test was used to assess the effect of each manipulation on consumption
rated from 1 (representing “none”) and 5 (representing “all”). Mann-Whitney U test
results were compared to examine whether the differences were significant. Branding
(P=0.000) and digital advertising (P=0.007) significantly reduced consumption. Variety
was not significant (P=0.082). Figure 4-6 give detailed comparisons. Consumption was
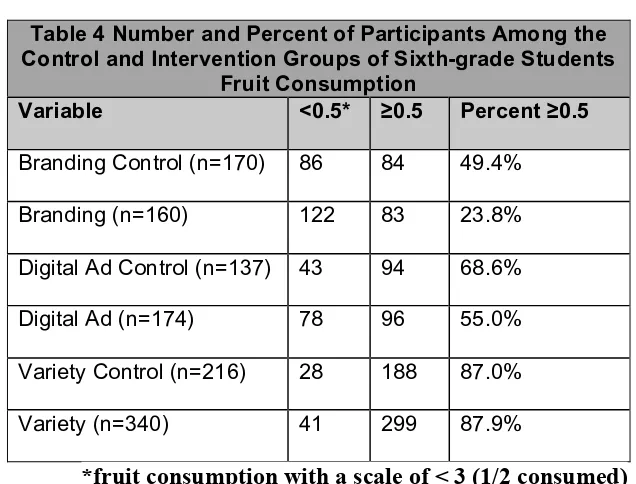
also compared using another scale: students who consumed half or more (rated 3-5) and
students who consumed less than half (rated 1-2). The proportion of students who
consumed half or more of the lunch item within each control and intervention group was
calculated. There was a significant decrease (P=0.000) in the branding intervention, a
significant decrease (P=0.019) in the digital advertising intervention, and a 0.9% increase
in the variety intervention (P=0.425). Table 4 describes proportions.
70.90% 88.50%
0% 10% 20% 30% 40% 50% 60% 70% 80% 90% 100%
17
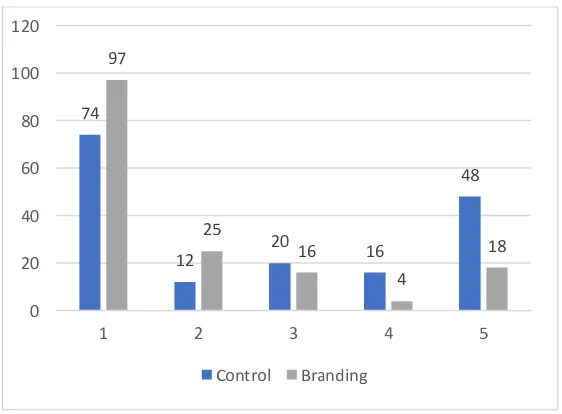
Figure 4. The effect of branding on fruit consumption. Values are numbers of participating students who
consumed fruits. P=0.000
Figure 5. The effect of digital advertising on fruit consumption. Values are numbers of participating
students who consumed fruits. P=0.007 74
12 20 16
48 97 25 16 4 18 0 20 40 60 80 100 120
1 2 3 4 5
Control Branding 39 4 14 4 6 70
8 13 14
69 0 10 20 30 40 50 60 70 80
1 2 3 4 5
[image:30.612.196.491.339.533.2]18
Figure 6. The effect of variety on fruit consumption. Values are numbers of participating students who
consumed fruits. P=0.082
Table 4 Number and Percent of Participants Among the Control and Intervention Groups of Sixth-grade Students
Fruit Consumption
Variable <0.5* ≥0.5 Percent ≥0.5
Branding Control (n=170) 86 84 49.4%
Branding (n=160) 122 83 23.8%
Digital Ad Control (n=137) 43 94 68.6%
Digital Ad (n=174) 78 96 55.0%
Variety Control (n=216) 28 188 87.0%
Variety (n=340) 41 299 87.9%
*fruit consumption with a scale of < 3 (1/2 consumed)
11 17 11 35
142
16 25 24
82
193
0 50 100 150 200 250
1 2 3 4 5
[image:31.612.165.483.329.571.2]19
CHAPTER V
Discussion & Conclusion
Discussion
The purpose of this study was to determine if these advertising methods influence
fruit selection and consumption among sixth-grade students. Selection increased in all
intervention groups, with a significant increase in the variety intervention group.
Consumption significantly decreased in the branding and digital advertising intervention
groups but increased by 0.9% in the variety group. Previous studies report students
discard roughly 47% of their fruit.5 Compared to this average, the digital advertising and
variety intervention groups had a higher consumption rate.
There were several limitations to this study. The data collected was de-identified.
However, a unique identifier for each student would allow for a relationship to be derived
from student selection before and after the intervention as well as the associated
consumption score. The inclusion of this information would be helpful to draw further
conclusions based on the individual.
During collection, several limitations arose. Leftover fruit items from the day
before were served first during Lunch A before the daily scheduled side item was served.
This decreased the total number of students who were given the option to choose the
specific fruit item that was being tested. Additionally, fruit served was estimated and
ordered based on past production data to limit food waste. Therefore, when the specific
fruit item being tested ran out for the day in Lunch C, some students were not given the
20
given the option to choose the specific fruit item were not included in the study. Students
also share, trade, and play with their food during lunch, which made tracking
consumption difficult. Each lunch period is 27 minutes long. If a student was at the end
of the lunch line, they would have less time than a student who was at the beginning of
the lunch line to consume their lunch. Therefore, students are not given equal amounts of
time to consume their lunch, which may affect student consumption data. Data was only
collected at one school and one age group over a two-week period. Ideally, data from
multiple schools, different age groups, and over a longer period would result in more data
and opportunity for further analysis.
Strengths of this study include strong cooperation among the foodservice manager
and staff. The food service manager was willing to order specific fruit items for the study
and was proactive about potential problems that could arise. The foodservice staff was
cooperative in seamlessly ensuring the specific fruit item being tested was available to
students in the lunch line. Data were collected twice during the collection of student
selection for data verification. Data collectors were trained each day before data
collection.
During the variety intervention, there was increased conversation about the
specific fruit item being tested (kiwis and grapes). Kiwi, an unfamiliar fruit, was offered
with grapes, a familiar fruit. The opportunity to allow students to try a new fruit for the
first time increased their awareness and conversation about school lunch. Repeated
exposures to less familiar foods can contribute to increased consumption and food
acceptability. Children need eight to 15 exposures to a new food to gain acceptance.29 A
21
financial burden when buying new foods for their child to try. Parents who experience
financial constraints minimize food waste by purchasing familiar foods they know their
child will eat and avoiding new items or reintroducing foods that their children may
refuse.30 It is important that schools provide a healthy environment for children, including
the opportunity to try new foods.
Furthermore, we did not measure total consumption of student trays. Rather we
looked at the consumption of the specific fruit item we were testing. However, data
providing total consumption could offer different results. The goal of school nutrition is
to increase student consumption of school meals, and even if the student did not consume
more of the fruit offered that day, the variety and advertising of the meal could have
resulted in an increase in overall consumption.
In addition to advertising methods, comprehensive nutrition approaches such as
nutrition education, garden-based learning, and taste tests need to be taken to increase
fresh fruit consumption. School cafeteria fruit and vegetable tasting programs lead to
greater preferences for less commonly served fruits and more self-efficacy to consume
fruits and vegetables in children.31 Students who participated in garden-based learning
significantly increase their preference for vegetables generally and for those that were
grown in the school garden.32 Song et al. (2016) assessed the effect of a cafeteria
intervention on fruit and vegetable consumption, student ability to select fruits and
vegetables, and their acceptability of healthy foods in fourth and fifth graders. Cafeteria
interventions included improving food presentation, incentivizing healthy choices, and
allowing the students and foodservice staff to interact more frequently. Additionally,
22
hands-on activities. The intervention target group had significant improvement in eating
vegetables for lunch, frequency of fruit and vegetable consumption measured in number
of days, and food preferences of oatmeal, whole grain noodles, and vegetables.33
Cafeteria interventions following the smarter lunchroom movement strategies in
conjunction with nutrition education interventions have proven to be influential in
students’ lunch selection and consumption.32,33
Conclusion
All fruit selections were increased by the intervention of different advertising
techniques. There was a significant decline in fruit consumption in the branding and
digital advertising intervention groups. There was an increase in consumption in the
variety group by 0.9%. This study found variety had a significant effect on fruit selection
at school lunch in a sixth-grade population. Combining a less commonly served fruit
(kiwi) with a familiar fruit (grapes) increased fruit selection. Variety in type and color of
fresh fruit can be an affective and cost-efficient tool to introduce new fruits to students
during school lunch. The decline in consumption indicates a need for nutrition education
to complement efforts of increasing fruit consumption in the lunch room. Further
research is needed to explore nutrition education programs in combination with
23
REFERENCES
1. Childhood Obesity Causes & Consequences. CDC Web Site. www.cdc.gov/. 2015. Updated April 10, 2016. Accessed May 10, 2016.
2. Nutrition Standards in the National School Lunch and School Breakfast
Programs; Final Rule. In: USDA Web Site. www.fns.usda.gov/. Updated January 26, 2012. Accessed May 10, 2016.
3. Terry McElrath Y, O'Malley P, Johnston L. Potential impact of national school nutritional environment policies: cross-sectional associations with US secondary student overweight/obesity, 2008-2012. JAMAPediatr. 2015;169:78-85.
4. Johnson DB, Podrabsky M, Rocha A, Otten JJ. Effect of the healthy hunger-free kids act on the nutritional quality of meals selected by students and school lunch participation rates. JAMA Pediatr. 2016;170:e153918.
5. Cohen JFW, Richardson S, Austin SB, Economos CD, Rimm EB. School Lunch Waste Among Middle School Students. American J Prev Med.44:114-121. 6. Green ED, J. Trump Takes Aim at School Lunch Guidelines and a Girls'
Education Program. New York Times 2017. May 2, 2017:A17.
7. Updated Offer vs. Serve Guidance for the NSLP and SBP Beginning SY2015-2016. USDA Web Site. https://www.fns.usda.gov/updated-offer-vs-serve-guidance-nslp-and-sbp-beginning-sy2015-16. Updated December 24, 2015. Accessed May 10, 2017.
8. The Smarter Lunchroom Strategies. The Smarter Lunchrooms Movement Web Site. https://www.smarterlunchrooms.org/scorecard-tools/smarter-lunchrooms-strategies. Accessed May 10, 2017.
9. Smarter Lunchrooms Annotated Scorecard. Smarter Lunchrooms Movement Web Site.
https://www.smarterlunchrooms.org/sites/default/files/documents/SLM%2060%2 0point%20Scorecard%20Lit%20Review.pdf. Updated January 2017. Accessed May 10, 2017.
10. Special Nutrition Program Operations Study 2013-2014. USDA Web Site. www.usda.gov./ Updated March 20, 2014. Accessed May 10, 2017.
11. Children's Food Environment State Indicator Report, 2011. CDC Web Site. www.cdc.gov/. Accessed July 23, 2016.
12. Wansink B, Just DR, Payne CR. Can branding improve school lunches? Arch Pediatr Adolesc Med. 2012;166(10):967-968.
13. Price JR, Riis, Jason. Behavioral Economics and the Psychology of Fruit and Vegetable Consumption: A Scientific Overview, 2012. Produce for Better Health Foundation Web Site.
http://pbhfoundation.org/pdfs/about/res/pbh_res/PBH_2012_LitReview.pdf. Accessed July 23, 2016.
24
15. Hanks AS, Just DR, Brumberg A. Marketing Vegetables in Elementary School Cafeterias to Increase Uptake. Pediatrics. 2016.
16. Wansink B, Just DR, Hanks AS, Smith LE. Pre-Sliced Fruit in School Cafeterias.
Amer Jourl Prev Med.44:477-480.
17. Bucher T, van der Horst K, Siegrist M. Improvement of meal composition by vegetable variety. Public Health Nutr. 2011;14:1357-1363.
18. Rolls BJ, Rowe EA, Rolls ET, Kingston B, Megson A, Gunary R. Variety in a meal enhances food intake in man. J Entomol Ser A. 1981;26:215-221.
19. Zmuda N. Coca-Cola Maintains Marketing Spend Amid Sluggish Demand. Ad Age Web Site. http://adage.com/article/cmo-strategy/coca-cola-maintains-marketing-spend-amid-sluggish-demand/294251/. Updated July 22, 2014. Accessed July 23, 2016.
20. Cheyne A, Mejia P, Nixon L, Dorfman L. Food and Beverage Marketing to Youth. Current Obesity Reports. 2014;3:440-450.
21. Bragg MA, Liu PJ, Roberto CA, Sarda V, Harris JL, Brownell KD. The use of sports references in marketing of food and beverage products in supermarkets.
Public Health Nutr. 2013;16(4):738-742.
22. Dixon H, Scully M, Kelly B, Donovan R, Chapman K, Wakefield M. Counter-advertising may reduce parent's susceptibility to front-of-package promotions on unhealthy foods. J Nutr Educ Beahav. 2014;46:467-474.
23. Jansen E, Mulkens S, Jansen A. How to promote fruit consumption in children. Visual appeal versus restriction. Appetite. 2010;54:599-602.
24. Lawrence RG. Framing Obesity. Int J Press Polit. 2004;9(3):56-75.
25. Montgomery KC, Chester J. Interactive Food and Beverage Marketing: Targeting Adolescents in the Digital Age. J Adolescent Health. 2009;45(3,
Supplement):S18-S29.
26. Pempek TA, Calvert SL. Tipping the balance: Use of advergames to promote consumption of nutritious foods and beverages by low-income african american children. Arch Pediatr Adolesc Med. 2009;163:633-637.
27. Blanchette L, Brug J. Determinants of fruit and vegetable consumption among 6-12-year-old children and effective interventions to increase consumption. J Hum Nutr. 2005;18(6):431-443.
28. Kelly B, Freeman B, King L, Chapman K, Baur LA, Gill T. The normative power of food promotions: Australian children’s attachments to unhealthy food brands.
Public Health Nutr. 2016;FirstView:1-9.
29. Birch L. Pass the Sugar, Pass the Salt: Experience Dictates Preference.
Developmental Psychology. 1990.
30. Daniel C. Economic constraints on taste formation and the true cost of healthy eating. Social Science & Medicine. 2016;148:34-41.
31. Lakkakula A, Geaghan J, Wong W-P, Zanovec M, Pierce S, Tuuri G. A cafeteria-based tasting program increased liking of fruits and vegetables by lower, middle and upper elementary school-age children. Appetite. 2011;57:299-302.
25