III. RESEARCH METHOD
This chapter includes research design, population and sample, variable, data collecting technique, research procedures, research instruments, scoring system, tryout, data analysis and hypothesis testing.
3.1 Research Design
In this research, the researcher intended to find out the significant difference between the score of students’ reading comprehension achievement before and after being taught through Think Pair Share technique in procedure text. It could be found by using pre-test before the treatment and post-test after the treatment. This research was a quantitative study which used one group pretest-posttest design. The researcher only selected one class as experimental class which had treatments (teaching reading comprehension through Think Pair Share technique in procedure text). The research design is as follows:
T1 X T2
Where:
T1 = Pretest (before treatments)
X = Treatments (teaching procedure text through Think Pair Share) T2 = Posttest (after treatments)
The researcher gave pre-test before the students were taught the procedure text through Think Pair Share technique. It was conducted to find out the students’ reading comprehension achievement in procedure text. There were three treatments (teaching reading the students in procedure text through Think Pair Share technique). The researcher conducted the treatments by using different topics in every meeting or every lesson plan. Eventually, post-test was administered to find the students’ reading comprehension achievement in procedure text after they were taught through Think Pair Share technique as the treatments.
3.2 Population and Sample
The population of this research was the first grade of the students of SMA N 1 Bandar Sribhawono. Class X1 that consists of 30 students in 2nd semester, academic year 2012/2013 was taken as the sample of this research, the class that was given the treatments (teaching reading procedure text through Think Pair Share technique). This class was chosen by using simple random sampling technique by using lottery, the researcher wrote some peppers with named the class X (X1-X9) and put them in to the glass. The class that out of from the shaken glass would be chosen as the experimental and tryout class, so that all of the first grade classes got the same chance to be sample in order to avoid
3.3 Data Collecting Technique
Data collecting technique is the way to get the data for the research. This data was collected to find out the significant difference between the score of the students’ reading comprehension achievement before and after being taught through Think Pair Share technique in procedure text. In collecting the data, the research
procedure administered pre-test, treatment and post-test. Then, the researcher analyzed the result of those activities which could be clarified as follows:
1.Try-out
The try-out test was applied to know the quality of the test as the instrument of the research. The try-out test was conducted in another class which was chosen
purposively in the pre observation, out of experimental class. The numbers of the tests items were 40 items of multiple choice that consist of four options of each answer (A, B, C and D). Time allocated was 90 minutes. This test was given to the students in order to have a good quality which has not only good reliability and good validity, but also it was not too easy and too difficult.
2.Pre-test
The pre-test was conducted before the treatment of teaching reading
3. Treatment
After having the pre-test, the students in the experimental class were given treatments. The treatment was teaching reading comprehension through Think Pair Share technique in procedure text. The researcher taught the students the material based on KTSP 2006 curriculum of senior high school. There were three different topics every meeting that consists of 90 minutes.
4.Post-test
The post-test was given to the students after the treatments to find out the significant difference between the score of the students’ reading comprehension achievement after being taught through Think Pair Share technique in procedure text. The result of post-test was compared with the result of pre-test. The test consists of 30 multiple choices items consisting of four options (A, B, C, and D).
3.5 Research Procedures
In constructing the research, the research procedures used these following steps:
1. Determining the population and sample of the research
The population of this research was the first grade students of SMA N 1 Bandar Sribhawono. The sample or experimental class is class X1 that consists of 30 students. It was chosen randomly by using lottery.
2. Administering the tryout to know the quality of the test
discrimination power (DP) as well to find out the reliability and validity of the test.
3. Preparing the material which will be taught
The researcher took the material based on English book of first grade student.
4. Administering the pretest and finding the result
The pre-test was conducted before the treatment, to see the students’ base reading comprehension in procedure text. The pre-test was given as an objective test in the form of multiple choices. The numbers of the items in the test are 30 items of multiple choice tests with four options of answers, (A, B, C and D). The pre-test took 60 minutes.
5. Giving treatment
After having the pre-test, the students in the experimental class was given three treatments. The treatment was teaching reading comprehension through Think Pair Share technique. There were three different topics in each meeting that consists of 90 minutes.
6. Administering the post-test
7. Analyzing the test result
After conducting pre-test and post-test, the researcher analyzed the data by using T-test. It was used to know whether Think Pair Share is able to increase students’ reading comprehension achievement in procedure text or not. It was computed through SPSS.
3.6 Research Instrument
The instruments of this research were:
1. Objective reading test of procedure text that was used for tryout, pre-test, and post-test. Those tests were in form of multiple choices that consists of four options (A, B, C and D). The multiple choice test is used since its marking is rapid, simple and most importantly reliable, not subjective or influenced by the marker’s judgment (Heaton, 1975).
2. Questionnaire consisting of the students’ arguments about the use of Think Pair Share technique in teaching learning reading comprehension. The
questionnaire consists of seven statements, four positive statements and three negative statements. Every student chooses the answer based on their
3.7 Scoring System
There were two research instruments consisting of objective reading test and questionnaire. Then, the scoring system can be seen as follows:
a. The Scoring System of Objective Reading Test
There were 40 items in tryout test, 30 items in pre-test and 30 items in post-test. Each correct answer is scored one. In scoring the students result of the test, the researcher used Arikunto`s formula. The ideal higher score was 100. The score of pretest and post tests were calculated by using formula as follows:
S = 100 N R
Where:
S: The score of the test
R: The total of the right answers N: The total items
(Arikunto, 1997:212)
b. The Scoring System of Questionnaire
The data responses of the students about the application of Think Pair Share technique in teaching learning reading comprehension was found by
1. Calculate the questionnaire score based on the table. Tabel 1. The scoring system of questionnaire.
Statements Score
1 0
Positive (Agree) S TS
Negatif (Disagree) TS S
Note: S = setuju; TS = tidak setuju (modified from Rahayu, 2010:29).
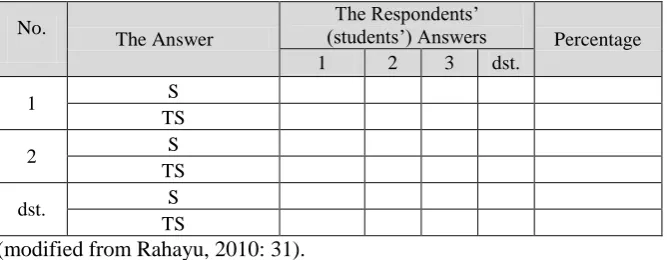
2. Tabulating the data based on the classification, it aimed to give the frequency and the tendency from every answer in questionnaire statements.
Tabel 2. The students’ responses data toward the teaching learning reading comprehension through Think Pair Share technique
No.
The Answer
The Respondents’
(students’) Answers Percentage 1 2 3 dst.
1 S
TS
2 S
TS
dst. S
TS
(modified from Rahayu, 2010: 31).
3. Calculate the percentage of questionnaire score by using formula as follows:
Where: P = Students’ answer percentage; f = frequency of answer; N = the total of students (modified from Sudijono, 2004:43).
P = x 100% f
[image:8.595.179.513.340.470.2]4. Deciding the responses percentage based on the Hendro’s criteria (in Hastriani, 2006:43).
Tabel 3. The students’ responses percentage criteria
Percentage (%) Criteria 100
76 – 99 51 – 75
50 26 – 49
1 – 25 0
All Most of Generally
A half of Almost a half of
A few Nothing
3.8 Try-out Test
Tryout is the test that was given before pre-test and post-test. It was the multiple choice test that consists of 40 items and had four options A, B, C, D. It was given in order to know the level of difficulty and discrimination power of the test items before giving the pre-test and post-test to the class. The test could be said has a good quality if it has a good validity, reliability, level of difficulty and
discrimination power.
Table 4. Specification Table of Tryout Test
No The Types of Reading Comprehension Items Numbers Percentage
1. Determining the main idea 1, 6, 10, 16, 21, 25, 30, 32, 40
25 % 2. Finding specific information 2, 3, 12, 17, 18, 23, 24,
26, 29, 33, 34, 36, 37
32,5 % 3. Finding references 7, 19, 28, 39 10 %
4. Finding inferences 13, 38 5 %
5. Understanding vocabulary 4, 8, 14, 22, 27 12,5 % 6. Determining concept of text (generic
structure/language features)
5, 9, 11, 15, 20, 31, 35 15 %
[image:9.595.122.502.575.718.2]3.8.1 Validity of the Test
The test can be said as the valid one if the test measures the object to be measured and it is suitable with the criteria (Hatch and Farhady, 1982:250). There are two basic types of validity (Hatch & Farhady, 1982: 250). They are content and construct validity. To measure whether the test has a good quality or not, the researcher used content and construct validity.
a. Content Validity
Content validity is concerned with whether the test is sufficiently representative and comprehensive for the test. Based on Hatch and Farhady (1982:251), since content validity is the extend to which a test measures a representative sample of the subject matter, the focus of content validity is adequacy of the sample of the appearance of the test. Therefore, since the test instrument was constructed to get the data of the students’ reading comprehension ability, the content validity of the test items were constructed by including reading material which was arranged based on the material already given and it was suitable with the curriculum. Thus, if the measuring instrument had represented all the ideas that connected with the material that was measured, that measuring instrument had fulfilled the aspect of content validity.
b. Construct Validity
KTSP 2006 curriculum of senior high school. Then, the test was determined according to the material that was taught to the students.
3.8.2 Reliability of the Test
Reliability of the test can be defined as the extent to which a test produces
consistent result when administrated under similar conditions (Hatch and Farhady, 1982:243). Pearson Product Moment formula that was used as follows:
rl=
2 2
y x
xy
Where:
rl: Coefficient of reliability between odd and even numbers items x: Odd number
y: Even number
x2: Total score of odd number items y2: Total score of even number items xy: Total number of odd and even numbers
(Lado, 1961 in Hughes, 1991:32) The criteria of reliability are:
0.80 – 1.00 = very high 0.50 −0.79 = moderate 0.00 – 0.49 = low
To know the coefficient correlation of whole items, “Spearmen Brown`s prophecy formula” will be used. The formula is as follows:
=
Where:
rk: The reliability of the whole test : The reliability of the half test (Hatch and Farhady, 1982:246)
3.8.3 Level of Difficulty
Level of difficulty is related to how easy or difficult the item is from point of view of the students who take the test. To know the level of difficulty, the researcher used the following formula:
LD = N
R
Where:
LD: Level of difficulty
The criteria are:
<0.30 = difficult 0.30-0.70 = average <0.70 = easy (Shohamy, 1985:79)
3.8.4 Discrimination Power
The discrimination power refers to the extent to which the item differentiates between high and low level students on the test. A good item according to the criteria is one which good students will do well and bad students will fail. To know the discrimination power of the test, the formula that was used:
DP = N
L U
2 1
Where:
DP: Discrimination power
U: The proportion of upper group students L: The proportion of lower group students N: Total number of the students
0.41 – 0.70 = good 0.71 – 1.00 = excellent
(Negative) = bad items (should be omitted)
(Heaton, 1975: 182)
3.9 Data Analysis
The purpose of analysis is to reduce data to be intelligible and interpretable so that the relation of research problem can be studied. The researcher analyzed the data statistically using Repeated measure T-test because this research only take one class for experimental class. It is probably the most widely used statistical test for the comparison of two means because it can be used with very small and simple size. In order to analyze how significant the difference between the score of the students’ reading comprehension achievement before and after being taught through Think Pair Share technique in procedure text, the researcher used these following procedures:
1) Scoring the pre-test and post-test.
2) Tabulating the result of the test and calculating the mean of the pre-test and post-test.
To know whether there is a significant difference between the score of the students’ reading comprehension achievement before and after being taught through Think Pair Share technique or not, the researcher compared the result of test to the result of post-test. If the result of post-test was higher than the pre-test, it means that Think Pair Share technique could be used to increase students’ reading comprehension achievement in procedure text.
3.10 Hypothesis Testing
The hypothesis statistically tested using Repeated measures T-test. It was used as the data came from the same sample or known as paired data (Hatch and Farhady, 1982: 114). The data was calculated through computing with Statistical Package for Social Science (SPSS) version 17.0. It was used to draw the conclusion in significant level of 0, 05 (p<0, 05). It means that the probability of error in the hypothesis was only about 5%.
To determine whether the first hypothesis is accepted or rejected, the following
criteria acceptance that used:
H0 : There is no significant difference between the score of the students’ reading
comprehension achievement before and after being taught through Think Pair Share technique in procedure text
The criteria are: