Visual Spatial Attention Control in an Independent
Brain-Computer Interface
Simon P. Kelly*, Edmund C. Lalor, Ciarán Finucane, Gary McDarby, and Richard B. Reilly
Abstract—This paper presents a novel brain computer interface (BCI) design employing visual evoked potential (VEP) modu-lations in a paradigm involving no dependency on peripheral muscles or nerves. The system utilizes electrophysiological corre-lates of visual spatial attention mechanisms, the self-regulation of which is naturally developed through continuous application in everyday life. An interface involving real-time biofeedback is described, demonstrating reduced training time in comparison to existing BCIs based on self-regulation paradigms. Subjects were cued to covertly attend to a sequence of letters superimposed on a flicker stimulus in one visual field while ignoring a similar stimulus of a different flicker frequency in the opposite visual field. Classification of left/right spatial attention is achieved by ex-tracting steady-state visual evoked potentials (SSVEPs) elicited by the stimuli. Six out of eleven physically and neurologically healthy subjects demonstrate reliable control in binary decision-making, achieving at least 75% correct selections in at least one of only five sessions, each of approximately 12-min duration. The highest-per-forming subject achieved over 90% correct selections in each of four sessions. This independent BCI may provide a new method of real-time interaction for those with little or no peripheral control, with the added advantage of requiring only brief training.
Index Terms—Covert attention, independent BCI, steady-state VEP.
I. INTRODUCTION
A. Brain Computer Interfaces
B
RAIN Computer Interface (BCI) technology has in recent years been receiving increased research attention as a po-tential alternative and augmentative communication (AAC) and control solution. For individuals with very severe disabilities (e.g., amyotrophic lateral sclerosis or brainstem stroke), reli-able use of peripheral muscles and nerves is not possible and, thus, a BCI may be the only feasible channel for autonomous interaction with their environment [1], [2]. The most favorable noninvasive brain imaging method employed in BCIs is elec-troencephalography (EEG), in which electrical signals of high temporal resolution are recorded from the scalp. The existingManuscript received July 22, 2004; revised January 23, 2005.Asterisk indi-cates corresponding author.
S. P. Kelly is with the Department of Electronic & Electrical Engi-neering, University College Dublin, Belfield Dublin 4, Ireland (e-mail: [email protected].).
E. C. Lalor is with the Department of Electronic & Electrical Engineering, University College Dublin, Belfield Dublin 4, Ireland, and also with the MindGames group, Media Lab Europe, Dublin 8, Ireland.
C. Finucane is with the Medical Physics & Bioengineering Dept., St. James’ Hospital, Dublin 8, Ireland.
G. McDarby is with the MindGames group, Media Lab Europe, Dublin 8, Ireland.
R. B. Reilly is with the Department of Electronic & Electrical Engineering, University College Dublin, Belfield Dublin 4, Ireland.
Digital Object Identifier 10.1109/TBME.2005.851510
EEG-based BCI designs rely on a variety of different EEG signal features, for example slow cortical potentials [3], mu rhythms [4], P300 potentials [5], and visual evoked potentials (VEPs) [6]–[8].
Current BCIs relying on VEPs, while demonstrating high in-formation transfer rates and considerable robustness, fall into the category ofdependent BCIs, in that they rely on activity in the brain’s normal output pathways [1]. For example, the BCI of Chenget al.[7] requires the user to select one of several vi-sual stimuli by looking directly at it, thus relying on control of eye movements via the output pathways of cranial nerves. This design, while useful in some cases, unfortunately rules out ap-plicability to those whose severe disabilities extend to impaired or nonexistent ocular motor control. Perseverance in the pursuit of anindependentVEP-based BCI design is nonetheless encour-aged for two reasons. First, high transfer rates are achieved by using VEPs in current dependent BCIs, and second, indepen-dent BCIs utilizing other event-related potentials (ERPs), such as P300s, have demonstrated considerable success, and have the advantage of requiring little or no training [5].
B. The Steady-State VEP (SSVEP)
The use of the SSVEP in dependent BCIs results in rela-tively high performance in terms of both speed and accuracy, as demonstrated in current BCI designs [7], [8]. The SSVEP is a periodic response elicited by the repetitive presentation of a visual stimulus, at a rate of 6–8 Hz or more. The periodicity of the response matches that of the stimulus, and provided stimulus presentation is precise, SSVEP power extends over an extremely narrow bandwidth. Spectral analysis with high frequency reso-lution allows observation of the SSVEP even within the alpha band [9].
C. Visual Spatial Attention Modulation of the SSVEP
Top-down modulation of early sensory electrophysiological responses by higher cognitive processes is a well-known phe-nomenon in the field of neuroscience. For example, changes in the amplitude of VEPs resulting from changes in general arousal and spatial attention respectively were reported as early as 1969 by Easonet al.[10]. In particular, many recent studies have demonstrated through measured modulations of transient VEPs, thatvisual selective attentioncan influence early visual processing (e.g., [11]–[13]).
Visual selective attention is a psychophysical construct per-taining to the brain’s ability to identify and focus on certain components of visual input to be processed preferentially at a given time. This is necessitated by the large amount of infor-mation transferred from the retina to higher processing areas of the brain (estimated in [14] at about - b/s) which, given
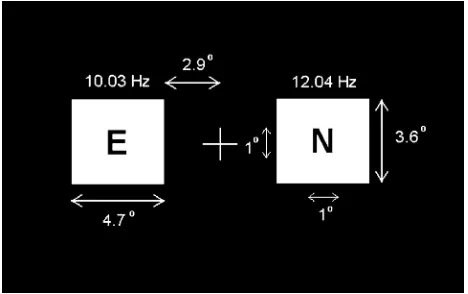
Fig. 1. The visual display used in all experimental sessions, containing bilateral flicker stimuli with sequence of letters superimposed.
the limited computational resources, is far too much to be pro-cessed in its entirety. In particular, visualspatialselective at-tention refers to selection in space, and may be understood in terms of a spotlight metaphor. Helmholtz [15] pointed out that the spotlight may move around a visual scene independent of gaze direction, i.e., components in peripheral vision may be se-lected for processing just as those in foveal vision. The term
covert attentionis used to describe attentional selection of re-gions of visual space outside the central foveal region.
Recent reports show that the SSVEP is modulated in a way similar to transient VEPs by visual-spatial selective attention [16], [17]. In [16], two sequences of alphanumeric characters were presented, superimposed on flickering backgrounds of dif-ferent frequencies. It was found that when the subjects attended to the sequence in one visual field the amplitude of the SSVEP resulting from the flickering background on that side was en-hanced by about a factor of two, compared to when the subject attended to the opposite side.
D. The Visual-Spatial Attention Control (V-SAC) BCI
In this paper we introduce the V-SAC BCI, which capital-izes on the abovementioned results of recent neuroscience re-search [16], [17]. The V-SAC BCI hinges on a subject’s ability to decisively deploy covert visual spatial attention, in such a way that significant SSVEP modulations can be produced on cue, to make selections in real time. As a first step in the development of the V-SAC BCI, the aim of the present study is to assess the feasibility of the design. This is carried out by examining the real-time performance of subjects making selections using vi-sual spatial attention in a basic paradigm with bilateral stimuli, and with the aid of feedback. A simple feature extraction method is described and the factors affecting operation of the BCI are discussed.
II. EXPERIMENTALMETHODS
A. Subjects
11 subjects aged between 21 and 37 participated in the study. All had normal or corrected-to-normal vision.
B. Experimental Setup
Subjects were seated 60 cm from a CRT monitor on which was displayed two white rectangular flicker stimuli situated
bi-lateral to a central fixation cross on a black background, as shown in Fig. 1. The actual refresh rate of this monitor, while on the 60 Hz setting, was measured with a photodiode circuit as 60.2 Hz. The left rectangle was switched ON (white) for one frame and OFF (black) for five frames giving a flicker rate of 10.03 Hz. The right rectangle was ON for one frame and OFF for four giving a flicker rate of 12.04 Hz. These frequencies were chosen on the basis that evoked SSVEPs in preliminary tests were greater in magnitude at these frequencies than at other test frequencies (8.6, 15.05, 20.07, and 30.1 Hz) resulting in high signal-to-noise ratios.
ERP studies examining the static allocation of visual spatial attention normally involve the task of target detection—for ex-ample, a subject is cued to attend to an area of visual space and respond by button press on presentation of a target stimulus at that location, but not on nontargets, nor on targets presented elsewhere (e.g., [11]–[13], and [16]). This provides a behavioral measure of spatial attention performance in terms of error rates and response times, and ensures that spatial attention mecha-nisms are engaged in the correct way. In this study, however, consideration of the BCI’s intended application warranted the exclusion of a physical response. In the centre of each of the white rectangles, letters from “A” through “H” were presented in a random pattern, replicating the paradigm employed in [16]. Embedded in the sequence of letters in the left rectangle was the target letter “Y” and on the right “N,” occurring with equal probability . These target letters were included as a po-tential aid in that subjects could perform the task of target de-tection by keeping count of the number of target presentations. However, due to the slow presentation rate of two letters per second, the number of targets counted by the subject was not deemed useful as a behavioral measure and was not recorded. Subjects were instructed to employ auditory imagery in reading the letters appearing in their peripheral vision, i.e., “say each letter in their mind.” The letter in each rectangle subtended a vi-sual angle of 1 both vertically and horizontally. The rectangles were situated 2.9 bilateral to the central fixation cross (cross to medial edge), centered on the horizontal meridian, and sub-tended a visual angle of 3.6 vertically and 4.7 horizontally. These stimuli lie outside the region of foveal vision.
EEG signals were recorded from the O1 and O2 electrode positions based on the international 10–20 electrode system [18]. These positions are situated over the left and right hemi-sphere of the primary visual cortex respectively. Each channel, referenced to the frontal site Fz, was amplified (50 K), 50 Hz line filtered and bandpass filtered over the range 0.1–100 Hz by Biopac biopotential amplifiers [19]. The signals were then digitized using a National Instruments DAQ system [20] at a rate of 301 Hz, in order that exactly five sample points were contained within each screen refresh period. Horizontal eye movements were monitored using horizontal electrooculogram (EOG) recorded with a passband of 1–35 Hz from two elec-trodes placed at the outer canthi of the eyes, with the left lead referenced to the right.
C. Procedure
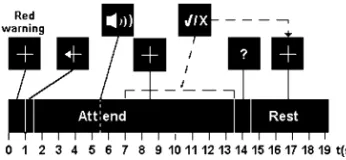
Fig. 2. The timing sequence for one trial. Audio feedback commences 4 s after the offset of the cue stimulus. If the subject succeeded in making a left/right selection within 12 s, a “tick” mark or “x” mark was presented depending on the outcome of the trial. Otherwise the attend period timed out and a question mark (“?”) was presented.
15 s while the subject passively viewed the central fixation cross without covertly attending to any region outside the foveal region, with bilateral stimuli presented as normal. These recordings allowed characterization of the alpha frequency band for each individual and provided baseline SSVEP ampli-tudes. The trial structure during the experimental sessions is shown in Fig. 2. Each trial started with a red warning stimulus lasting 1 s, followed by a cue stimulus consisting of a white fixation cross of the same size with an arrow on the left or right arm, lasting 0.5 s. Depending on the direction of the arrow, the subject was instructed to covertly attend to the left or right rectangle while strictly maintaining fixation on the central fixation cross. Approximately 4 s after the start of the attend period, audio feedback commenced. This took the form of a looped double-click sound, the play speed of which was linearly related to a cumulative measure of spatial attention deployment. A selection was made once this measure, detailed in the following section, exceeded a threshold. Thus, faster selections could be made with more effortful focusing of spatial attention. If the subject succeeded in making a left or right se-lection within 12 s after the cue, a correct tick mark or incorrect “x” mark was presented depending on the outcome of the trial. Otherwise the attend period timed out and a question mark (“?”) was presented. Audio feedback was continually presented until the end of the trial. Following the attend period a white fixation cross was presented for 5 s, signifying a rest period. Each session consisted of 40 trials, with an equal number cued left as cued right, in random order.
III. ANALYSISMETHODS
A. Feature Extraction
As the EEG signals were acquired they were buffered into 1200-sample segments with a 60-sample
overlap. This segment length was chosen so that it contained an integral number of 10.03 and 12.04 Hz cycles in order to minimize spectral leakage [21]. For each channel, the power at 10.03 and 12.04 Hz was calculated by multiplying each segment by sine and cosine functions at the corresponding fre-quencies and taking the root mean square of these two values. This is equivalent to performing a Fast Fourier Transform at single frequencies. The following feature was then calculated:
(1)
where is the power at frequency at channel O1 for segment , and and are constants set prior to each session
Fig. 3. Preliminary passive viewing spectra prior to session 1 for (a) subject 1 and (b) subject 4.
accounting for inter-subject differences in baseline SSVEP am-plitudes and scalp distributions.
The constant is a simple threshold separating the left and right classes. For the first session, was initialized using aver-aged spectra derived from the passive viewing data, two exam-ples of which are shown in Fig. 3 for subjects 1 and 4. Specifi-cally, was set using the equation
(2)
where is the power at frequency at channel O1 averaged over the 15 s of passive viewing data.
Prior to the remaining sessions, passive viewing data were ex-amined in the same way. Also average spectra calculated from the first 4 s of all trials from the preceding session were exam-ined. If both examinations suggested an optimal that differed considerably from that used in the preceding session (by ap-proximately 0.3, both in the same direction), was updated to a value approaching the less different of the two suggested values. For most subjects no additional updates of appeared necessary following the first 2–3 sessions.
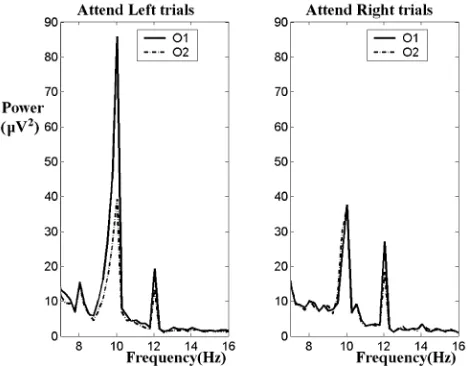
[image:3.594.312.545.68.243.2]Fig. 4. Averaged frequency spectra for the first 4 s of attend-left and attend-right trials for subject 3, session 3.
from the spectra shown in Fig. 4, for subject 3 a lateralization weighting of was warranted, contrary to the finding in [17], and this was also true of subject 6 but to a lesser extent . In cases where subjects utilized audio feedback effectively, performance was relatively insensitive to choice of constants and .
The feature was clamped such that
(3) One window length after the start of the attend period, a cumulative running sum of the feature was initiated. This is given by the equation
(4)
With a suitable choice of the threshold this feature becomes more positive when the power at frequency increases relative to that at (attend-left), and more negative when the power at frequency increases relative to that at (attend-right). A classification was made if the running sum passed above or below the upper and lower limits of . These limits were de-termined empirically in pilot sessions in which limits greater or less than 8 resulted in more erroneous selections. Given the difficult nature of the task, the running sum is unlikely to be monotonically increasing or decreasing, thus the limits are re-quired to be high enough to afford the subject enough time to utilize the audio feedback effectively in making a correct selec-tion. On the other hand, limits set too high result in longer trials, during which sustained spatial attention deployment may show signs of fatiguing and in addition the speed of communication may be unnecessarily compromised. The play speed of the audio feedback was linearly related to the running sum and, thus, was an indicator of the subject’s progress in terms of proximity to either the upper or lower limit.
B. Information Transfer Rate
One objective measure of BCI performance is the bit rate, as defined by Wolpawet al.[22]. For a trial with possible
sym-bols in which each symbol is equally probable, the probability that the symbol will be selected is the same for each symbol, and each error has the same probability, then the bit rate can be calculated as follows:
(5)
(6)
In the assessment of information transfer in the V-SAC par-adigm we calculate not only the bit rate obtained in practice during this study, but we also estimate offline the achievable bit rate using data from the best performing subject with augmen-tations made to classification of inconclusive trials and limits on trial duration.
In the practical implementation of the paradigm, due to incon-clusive trials less than one symbol on average is sent per trial. The sum of durations of all 40 trials in a session, , (which in-cludes all 12-second trials classified as inconclusive) is taken as the time taken to make selections, where is the number of correct selections and the number incorrect. The time taken per symbol is then calculated as , and its reciprocal scaled to give symbols/min. is taken as in the calcu-lation of bits per symbol [(5) and the Bit Rate is then calculated as in (6)].
The running sum limits of were imposed in the practical implementation in order to maximize accuracy, but a decision can still be made on those trials classified as inconclusive. Ac-cordingly, in a secondofflinecalculation of information transfer rate, the value of the running sum feature was examined at the end of all trials that timed out after 12 s during the online testing. Where this was positive a left classification was made and where it was negative a right classification was made. The bit rate is then calculated in the same way, but with different values of and , the sum of these being necessarily equal to the total number of trials in this case.
Finally, in order to consider system performance in terms of speed as well as accuracy, information transfer rate was also cal-culated offline as a function of both threshold and trial timeout. A binary decision was made on the trial timeout based on the sign of , regardless of proximity to either an upper or lower limit.
C. Offline EOG Analysis
TABLE I
ONLINERESULTS. FOREACHSESSION OF40 TRIALSUNDERGONE BYEACH SUBJECT,THENUMBER OFCORRECT ANDINCORRECTSELECTIONS AND THE
NUMBER OFINCONCLUSIVETRIALS(“?”) ARELISTED, WITH THE RESULTINGPERCENTAGE OFCORRECTSELECTIONS. THEFINALCOLUMN
LISTS THEBITRATEACHIEVED IN THEBESTSESSION(LISTED IN BRACKETS)FOREACHSUBJECT
exists even to a small degree. The first two calibration sessions, in which EOG data were recorded for one subject, were con-trived to address this. In the first (OVERT) session, gaze was shifted from the fixation cross to the centrally placed letters of the cued stimulus on every trial immediately following the cue, and held for the duration of the trial. The second session (MIXED_ANGLE) was a repeat of the first, but this time gaze was shifted to several displacement angles between the fixation cross and the cued stimulus. An EOG “deflection interval” is derived from these calibration data which bounds the average eye movement. First we tested for a general connection between amount of eye movement (EOG power) and performance across subjects. To this end, the RMS value of EOG amplitude within the deflection interval was averaged across all sessions for each subject and the correlation between this value and average on-line performance was calculated. To examine the specific influ-ence of eye movements toward the cued stimulus within trials, an EOG feature was defined as the mean EOG amplitude within the deflection interval. The correlation between this EOG fea-ture and the feafea-ture across trials for each session was then calculated, and the results compared to those obtained from the calibration sessions. Finally, point-wise paired t-tests between attend-left and attend-right EOG trials are calculated using all trials for each subject. The points in time at which significant differences are found at 7 consecutive timepoints are marked, and in cases where this exists particu-larly in the period just following cue presentation and feedback onset, the subject is reported to have violated the central fixation constraint.
[image:5.594.47.284.133.365.2]In addition to sustained foveation away from the central fixa-tion cross, brief visual orienting toward the stimulus in the cued visual field, not necessarily time-locked to the cue, is a possible confound. To examine the effects of this type of eye movement
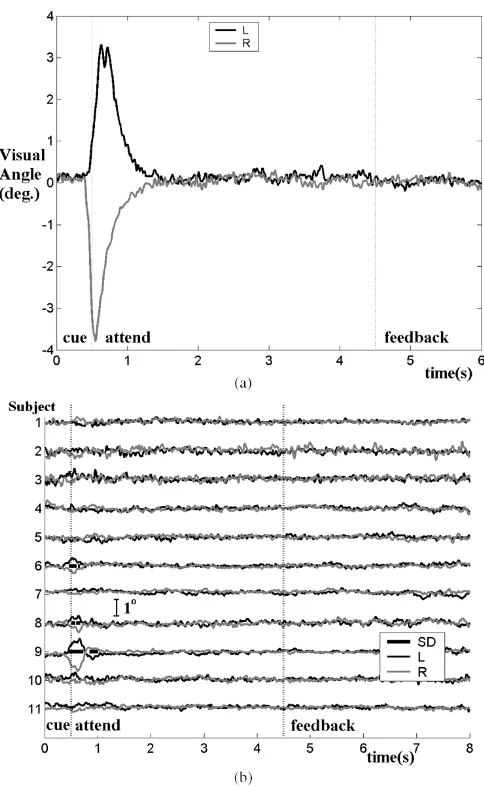
Fig. 5. Cue-triggered EOG time course averages (a) for OVERT calibration session and (b) for attend-left (L) and attend-right (R) trials averaged across all trials in all sessions for all subjects. Intervals of significant left/right difference (SD) are marked by bars.
on the operation of the BCI, a third calibration session (SHORT) was recorded during which a subject performed five short gaze shifts from the central fixation cross to the cued stimulus and back within the first 5 s of every attend period. The subject was instructed to shift gaze to the stimulus on each occasion just long enough to read one letter. The effects of this type of eye movement is compared to that of sustained eye deflections by assessing the significance of differences in the first feature value F(1) for attend-left and attend-right trials in all three calibration sessions.
IV. RESULTS
[image:5.594.50.283.135.364.2]TABLE II
CORRELATIONCOEFFICIENTS FOREOG FEATURE ANDFIRST FEATUREVALUEF (1)
of correct trials out of all trials in which a selection was made. Subjects are listed in order of the average of this percentage, with highest first.
Information transfer rates were calculated for all sessions and subjects based on the first method described above (Table I). Due to the number of inconclusive trials, this method yielded the lowest information transfer rates. The highest of these rates was achieved by subject 1 in session 5. The sum of the durations of these 40 trials up until selection or timeout was 356 s and given that only 30 selections were made this translates to an informa-tion transfer rate of 3.27 b/min. Second, by including decisions made on the inconclusive trials for this session, a performance of 36 out of 40 correctly classified trials was obtained. This yields an information transfer rate of 3.57 b/min. Finally, an offline analysis of accuracy and bit rate as a function of threshold and trial timeout for this session confirmed that highest accuracy is achieved using the full 12 s trial timeout, but interestingly the highest bit rate is achieved when using a shorter timeout of 4.2 s, i.e., using the second running sum value , which yields a maximum bit rate of 7.59 b/min.
Fig. 5 shows the cue-triggered EOG time course averages for attend-left and attend-right trials, [Fig. 5(a)] during the OVERT EOG calibration session and [Fig. 5(b]) over all sessions of each subject. The relation between recorded EOG amplitude and visual angle was estimated using the MIXED_ANGLE calibration run in which the subject shifted gaze to 4 predefined displacement angles (0.9, 1.4, 2.9, 5.2 degrees; 10 trials each) and this was confirmed by testing on deflections in the OVERT calibration run. On the basis of these data, the interval 0.45–1.1 s following onset of cue presentation [Fig. 5(a)] is chosen as the “deflection interval” from which EOG features are derived in the following analysis.
First, the RMS EOG within the deflection interval was calculated and the average of this feature across all trials was tested for positive correlation with average online performance across subjects. No significant correlation was found (
, ), suggesting no general connection between EOG power and performance across subjects. Second, the mean EOG amplitude in the deflection interval served as an
appropriate feature whose influence on the feature could be evaluated on a trial-by-trial basis. Table II shows the correlation coefficients between this EOG feature and the first feature value of the attend period for each experimental session. was chosen because any gaze shifts made by the subject were most likely carried out within the first 4 s after cue presentation, therefore, it is expected that the first feature value would be most affected. For comparison, the correlation coefficient for
the OVERT calibration session is and
for the MIXED_ANGLE session . Periods
during which EOG amplitude differ significantly for attend-left and attend-right trials are marked in Fig. 5(b) for each subject. Finally, the first feature F(1) of the attend period was tested in the calibration sessions for significant left/right differences using t-tests. For the OVERT calibration session the difference between average F(1) for attend-left and attend-right trials was
1.66 ( , ). For the MIXED_ANGLE
calibration session the difference was 0.68 ( , ). For the SHORT calibration session the difference was
0.38 ( , ).
V. DISCUSSION
We have demonstrated the feasibility of developing a novel independent BCI based on the brain mechanism of visual spa-tial attention, by using SSVEPs elicited by a bilateral stimulus display. This may encourage the reconsideration of VEPs as a viable option in BCIs that are truly independent of neuromus-cular function [1]. As shown in Table I, subjects 1 through 6 succeeded in reaching an accuracy of 75% or higher in at least one session, having had very little training.
The results of EOG postprocessing highlight to what degree the performance in this study was indeed independent of pe-ripheral muscles and nerves. Overall these results demonstrate good compliance on the task. Significant EOG deflections indi-cating a tendency to shift gaze in the attend period are found for subjects 6, 8, and 9 [Fig. 5(b)]. Thus, the online performance of these subjects is to be considered with caution. However, the additional information in Table II can also be considered, and this provides insight into how much the running sum feature is affected by gaze shifts manifest in the EOG at the onset of the trial. Low, and sometimes negative, correlations for subject 6 for instance suggest that eye movements led to little advan-tage in performing successfully. This holds true for all subjects. In contrast, the correlation coefficients from both the OVERT and MIXED_ANGLE calibration runs demonstrate that where a subject does shift gaze to a displacement angle toward the cued stimulus, EOG amplitude is strongly correlated with and, hence, can be said to directly influence, the feature on which op-eration of the BCI is based. Finally, the effects of brief gaze shifts not held on the stimulus are examined using the SHORT calibration data. Comparing across calibration sessions, it is clear that the effects in terms of left/right discriminability of these brief gaze shifts are considerably smaller than the effects of sustained gaze shift to mixed displacement angles and even more so in the case of overt attention.
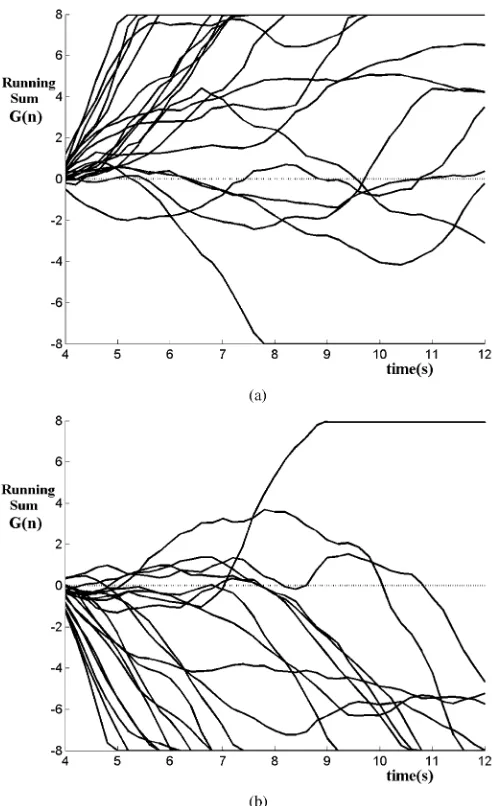
Fig. 6. Time course of the running sum featureG(n)for subject 1 in session 5, (a) for 20 attend-left trials, (b) for 20 attend-right trials.
courses are clearly separable, with the majority of successful selections made within the first 4 s of auditory feedback.
The necessity for subject-specific values of and is illus-trated in Figs. 3 and 4. Though in this study the threshold was updated prior to every session, improved performance could re-sult from updating on a trial-by-trial basis. For example, in [23] Ramoser and colleagues address the problem of intercept selec-tion in the face of spontaneously varying baseline levels. These authors report that an automatic selection method whereby the average EEG amplitude of the most recent trials is used to deter-mine the intercept for the current trial, results in optimal perfor-mance in terms of accuracy. Fig. 4 shows the average frequency spectra for the first 4 s of attend-left and attend-right trials for subject 3, session 3. The spectrum during the attend-left trials shows that for this subject the modulation of the 10 Hz SSVEP at the ipsilateral electrode, O1, is greater than at O2, which is contrary to the findings in [17] and was accounted for by setting to zero for this subject. Otherwise, most subjects indicated a greater contralateral modulation.
As with all BCI studies, not all subjects tested in this study achieved high accuracies. Subjects 10 and 11 demonstrate
sub-stantial difficulty in performing the task, making more incor-rect selections than corincor-rect selections in almost every session. In particular, they reported that while trying to attend to one stim-ulus they were constantly distracted by the changing letters in the other stimulus. As a further investigation these two subjects also performed one experimental session each where they were instructed to shift and maintain gaze directly toward the cued stimulus (overt attention). Subject 10 achieved a performance of 97.2% correct trials while subject 11 achieved 90.7% correct, suggesting that failure on the task during experimental sessions can be attributed specifically to failure to exhibit the correct at-tentional behavior rather than failure of the methods employed to translate this behavior. In support of this, reasonable baseline SSVEP magnitudes were recorded from these subjects during covert sessions. This implies that additional training, particu-larly involving feedback of spatial attention performance on a trial-by-trial basis, would be of benefit for these subjects.
The modulation of SSVEP magnitude by covert attention has been shown to have a wide scalp distribution, with highly sig-nificant modulations seen at several electrode placements [16], including placements as anterior as F3 and F4. It is unlikely that the topography of the SSVEP modulations will be con-stant across a larger population. For BCIs based on mu and beta rhythms [4] and P300s [5], often only one or two scalp locations are used for online control. In the interests of demonstrating that the V-SAC BCI system is comparable to other current sys-tems, we chose to monitor EEG activity from only two locations. However, it is possible that for some of the participants in this study, in particular the poorer performing subjects 7 through 11, the SSVEP modulations may be more significant at electrode placements other than the two considered here, O1 and O2. Per-formance may be improved by identifying subject-specific scalp sites of maximum attentional modulation.
10.03 and 12.04 Hz SSVEPs with precision, such that potential interference by ongoing alpha-band activity was minimized. As the focus of this study is to demonstrate the feasibility of using visual spatial attention as a control mechanism for an independent BCI, efforts have been concentrated on optimizing accuracy as opposed to speed. However, an examination of the system performance in terms of information transfer rate is worthwhile. The maximum bit rates achieved in practice are low in comparison with those of some existing independent BCIs [1]. For example, users of the Wadsworth BCI [4], [22], [23] have achieved transfer rates of up to 20–25 b/min. It is possible that comparable rates will be demonstrated on opti-mization of this system in terms of the factors considered above. In addition, given the improvement in estimated achievable information transfer rate for subject 1 obtained when a decision was made after 4–5 s, it seems reasonable to suggest that once a user consistently obtains sufficiently high accuracies with the initial operating protocol, then the decision limits, timeout trial length and perhaps also the window size, may be reduced in order to better optimize for speed. Following the trend of existing BCIs, the trial sequence could indeed be tailored to the training experience and ability of each user. Improving the information transfer rates in the V-SAC BCI thus presents a promising challenge for future research.
The V-SAC BCI design may be further considered in the context of existing BCIs currently in development. While some BCIs utilize naturally occurring event-related or evoked responses such as P300 potentials [5] and VEP[6]–[8] which are for the most part involuntary, other BCI involve learned self-regulation of key cortical activity for production of re-sponses on cue, for example slow cortical potentials [3] and sensorimotor rhythms [4], [28]. The former design, being reliant on natural involuntary responses, has the advantage of requiring no training, whereas the latter design normally demonstrates effectiveness only after periods of biofeedback training, wherein the subject learns to regulate the relevant activity in a controlled way. In terms of adaptability and ex-tensibility, however, systems involving self-regulation through biofeedback are in the long term more favorable. The scope for improvement over time is desirable not just in terms of the improvement itself but also in terms of the motivational aspects of training which provide encouragement to achieve better quality of life and contribute positively to the psychological health of the individual [3]. The V-SAC BCI incorporates elements of both BCI designs. On one hand, SSVEPs are reliable involuntary responses, but on the other, the attentional modulation of SSVEP on cue, requires controlled deployment of spatial attention mechanisms, which is naturally developed in every day situations, but needs to be practiced within the framework of the V-SAC paradigm.
VI. CONCLUSION
Visual spatial attention modulation of the SSVEP can be used as a control mechanism in a real-time independent brain-com-puter interface. In this study such a system was designed, im-plemented and tested. Six out of eleven subjects demonstrated reliable control by achieving at least 75% correct selections
in at least one of five experimental sessions undergone in this study. Having demonstrated the potential utility of the V-SAC BCI, continued research is focused toward achieving acceptable levels of human communication.
ACKNOWLEDGMENT
The authors wish to acknowledge R. Burke for his contribu-tion to the experimental setup.
REFERENCES
[1] J. R. Wolpaw, N. Birbaumer, D. J. McFarland, G. Pfurtscheller, and T. M. Vaughan, “Brain-Computer interfaces for communication and control,”
Clin. Neurophysiol., vol. 113, no. 6, pp. 767–791, 2002.
[2] G. Schalk, D. J. McFarland, T. Hinterberger, N. Birbaumer, and J. R. Wolpaw, “BCI2000: a general-purpose brain-computer interface (BCI) system,”IEEE Trans. Biomed. Eng., vol. 51, no. 6, pp. 1034–1043, Jun. 2004.
[3] N. Birbaumer, A. Kubler, N. Ghanayim, T. Hinterberger, J. Perelmouter, J. Kaiser, I. Iversen, B. Kotchoubey, N. Neumann, and H. Flor, “The thought translation device (TTD) for completely paralyzed patients,”
IEEE Trans. Neural Syst. Rehabil. Eng., vol. 8, no. 2, pp. 190–193, Jun. 2000.
[4] J. R. Wolpaw, D. J. McFarland, G. W. Neat, and C. A. Forneris, “An EEG-based brain-computer interface for cursor control,” Electroen-cephalogr. Clin. Neurophysiol., vol. 78, pp. 252–259, 1991.
[5] L. A. Farwell and E. Donchin, “Talking off the top of your head: Toward a mental prosthesis utilizing event-related brain potentials,”
Electroencephalogr. Clin. Neurophysiol., vol. 70, no. 6, pp. 510–523, 1988.
[6] E. E. Sutter, “The brain response interface: Communication through vi-sually induced electrical brain responses,”J. Microcomput. Applicat., vol. 15, pp. 31–45, 1992.
[7] M. Cheng, X. Gao, S. Gao, and D. Xu, “Design and implementation of a brain-computer interface with high transfer rates,”IEEE Trans. Biomed. Eng., vol. 49, no. 10, pp. 1181–1186, Oct. 2002.
[8] E. Lalor, S. P. Kelly, C. Finucane, R. Burke, R. B. Reilly, and G. McDarby, “Brain computer interface based on the steady-state VEP for immersive gaming control,” Biomed. Tech., vol. 49, no. 1, pp. 63–64, 2004.
[9] D. Regan, Human Brain Electrophysiology: Evoked Potentials and Evoked Magnetic Fields in Science and Medicine. New York: Else-vier, 1989.
[10] R. Eason, M. R. Harter, and C. T. White, “Effects of attention and arousal on visually evoked cortical potentials and reaction time in man,”Physiol. Behavior, vol. 4, no. 3, pp. 283–289, 1969.
[11] H. J. Heinze, S. J. Luck, G. R. Mangun, and S. A. Hillyard, “Visual event-related potentials index focused attention within bilateral stimulus arrays-I: Evidence for early selection,”Electroencephalogr. Clin. Neu-rophysiol., vol. 75, no. 6, pp. 511–527, 1990.
[12] S. A. Hillyard and L. Anllo-Vento, “Event-related brain potentials in the study of visual selective attention,”Proc. Nat. Acad. Sci., vol. 95, pp. 781–787, 1998.
[13] M. G. Woldorff, M. Liotti, M. Seabolt, L. Busse, J. L. Lancaster, and P. T. Fox, “The temporal dynamics of the effects in occipital cortex of visual-spatial selective attention,”Cogn. Brain Res., vol. 15, no. 1, pp. 1–15, 2002.
[14] G. Deco, O. Pollatos, and J. Zihl, “The time course of selective attention: Theory and experiments,”Vis. Res., vol. 42, pp. 2925–2945, 2002. [15] H. Helmholtz,Handbuch der physiologischen Optik. Leipzig,
Ger-many: Voss, 1867.
[16] S. T. Morgan, J. C. Hansen, and S. A. Hillyard, “Selective attention to stimulus location modulates the steady state visual evoked potential,”
Proc. Nat. Acad. Sci. USA, vol. 93, pp. 4770–4774, 1996.
[17] M. M. Muller, T. W. Picton, P. Valdes-Sosa, J. Riera, W. A. Teder-Sale-jarvi, and S. A. Hillyard, “Effects of spatial attention on the steady-state visual evoked potential in the 20–30 Hz range,”Cogn. Brain Res., vol. 6, pp. 249–261, 1998.
[19] Biopotential Amplifiers. Biopac Inc., Goleta, CA. [Online]. Available: http://www.biopac.com.
[20] Data Acquisition Hardware. National Instruments Inc., Austin, TX. [Online]. Available: http://www.ni.com/dataacquisition.
[21] F. J. Harris, “On the use of windows for harmonic analysis with the discrete Fourier transform,”Proc. IEEE, vol. 66, no. , pp. 51–83, 1978. [22] J. R. Wolpaw, H. Ramoser, D. J. McFarland, and G. Pfurtscheller, “EEG-based communication: Improved accuracy by response veri-fication,” IEEE Trans. Neural Syst. Rehabil. Eng., vol. 6, no. 3, pp. 326–333, Sep. 1998.
[23] H. Ramoser, J. R. Wolpaw, and G. Pfurtscheller, “EEG-based commu-nication: Evaluation of alternative signal prediction methods,”Biomed. Tech. (Berl.), vol. 42, no. 9, pp. 226–33, 1997.
[24] P. L. Nunez, Electric Fields of the Brain: The Neurophysics of EEG. New York: Oxford Univ. Press, 1981.
[25] E. Basar, M. Schürmann, C. Basar-Eroglu, and S. Karakas, “Alpha oscillations in brain functioning: An integrative theory,”Int. J. Psy-chophysiol., vol. 26, no. 1–3, pp. 5–29, Jun. 1997.
[26] L. R. Silva, Y. Amitai, and B. W. Connors, “Intrinsic oscillations of neo-cortex generated by layer 5 pyramidal neurons,”Science, vol. 251, pp. 432–435, 1991.
[27] C. Neuper and G. Pfurtscheller, “Event-related dynamics of cortical rhythms: Frequency-specific features and functional correlates,”Int. J. Psychophysiol., vol. 43, no. 1, pp. 41–58, Dec. 2001.
[28] G. Pfurtscheller and C. Neuper, “Motor imagery and direct brain-com-puter communication,”Proc. IEEE, vol. 89, no. 7, pp. 1123–1134, Jul. 2001.
Simon P. Kelly(M ’04) received the B.E. degree in electronic engineering from University College Dublin, Dublin, Ireland, in 2001. He is currently working towards the Ph.D. degree in the Department of Electronic and Electrical Engineering in Univer-sity College Dublin.
His current research is centered on the human attention system, studied from both a cognitive neurophysiology and rehabilitation engineering perspective.
Edmund Lalorreceived the B.E. degree in electronic engineering from University College Dublin, Dublin, Ireland in 1998 and the M.Sc. degree in electrical en-gineering from the University of Southern California, Los Angeles, CA, in 1999. He is currently working toward the Ph.D. degree in the Department of Elec-tronic and Electrical Engineering in University Col-lege Dublin.
From 2002–2005, he worked as a Research Associate with Media Lab Europe, the European research partner of the MIT Media Lab. His current interests include brain-computer interfaces and signal processing applications in neuroscience.
Ciarán Finucanewas born in Dublin, Ireland, in 1979. He received the B.E. degree in electronic engineering from University College Dublin (UCD), Dublin, in 2001. He received the M.Sc. degree from UCD and the National Rehabilitation Hospital for “EEG based Brain Computer Interfaces for the Disabled,” in 2003
He joined the Department of Medical Physics, St. James’ Hospital Dublin where he currently works as a Medical Physicist. His research interests include the development of novel brain-computer interfaces, neurophysiological signal analysis, biomedical applications of Multimedia, wireless and internet technologies, and biological systems modeling.
Gary McDarbyreceived the B.E. and M.Sc. degrees in electronic engineering from University College Dublin, Dublin, Ireland in 1988 and 1995 respec-tively. He received the Ph.D. in biomedical signal processing from the University of New South Wales, Sydney, Australia, in 2000.
Since 2000, he has worked as a Principal Research Scientist in Media Lab Europe leading a multi-disci-plinary group called MindGames. His research is fo-cused on combining sensory immersion (augmented reality), gameplay, novel biometric interfaces, and in-telligent bio-feedback to constructively affect the state of the human mind. He is strongly committed to finding ways where technology can be a transformational tool to people marginalized in society and is heavily involved with the Intel Computer Clubhouse program. He is a much sought after speaker on technology and philosophy and has recently been nominated to the European Academy of Sciences for contributions to human progress.
Richard B. Reilly(M’92–SM’04) received the B.E., M.Eng.Sc., and Ph.D. degrees, all in electronic en-gineering, from the National University of Ireland, Dublin, in 1987, 1989, and 1992, respectively.
In 1988, he joined Space Technology Ireland and the Department of Recherche Spatiale (CNRS group), Paris, France, developing DSP-based on-board experimentation for the NASA satellite WIND. In 1990, he joined the National Rehabili-tation Hospital and in 1992 became a Postdoctoral Research Fellow at University College Dublin (UCD), Dublin, Ireland, focusing on signal processing for speech and gesture recognition. Since 1996, he has been on the academic staff in the Department of Electronic and Electrical Engineering at UCD. He is currently Senior Lecturer and researches into neurological signal processing and multimodal signal processing.