AT ENERGIES UP TO 1500 MeV
· Thesis by
Lyman Jefferson Fretwell, Jr.
In Partial Fulfillment of the Requirements
For the Degree of Doctor of Philosophy
California Institute of Technology Pasadena, California
1967
ii
ACKNOWLEDGMENTS
I would like to thank my director of research, Dr. J.B. Mullins, for his willingness to counsel and help at any time throughout the many years it took this experiment to come to fruition. His help in
designing and building the bubble chamber and getting the synchrotron to work properly were vital to the pursuit of this experiment.
Special thanks also go to my co-worker, Mr. D.G. Coyne, for his generous help in all phases of this experiment, from chamber construction to data analysis.
Gratitude is due the many people who have worked on this project in the past and have given me much help and advice,
particularly Drs. J.M. Teem, E.D. Alyea, D.E. Groom, and C.W. Peck. Help, support, and encouragement from Professors R.L. Walker, A.V. Tollestrup, and R.F. Bacher are gratefully acknowledged.
Professor George Zweig provided valuable comments on result interpre-ta ti.on.
I want to thank the many members of our scanning and analysis crew. Although there are too many to mention each by name, I would like to thank Mrs. Phyllis Nilsson for her work analyzing and
computing.
and Mr. Dan Sell and the other members of the Central Engineering Services. Thanks for much help to Mrs. Beatrice Hal l and Niss Cherry Carter. The staffs of the Central Shop and the Computing Center have also been very helpful. Thanks also to my patient typist, Miss
Yvonne Dawson.
Financial Support of the National Science Foundation and the Atomic Energy Commission are grat':!fully acknm-1ledgec1.
iv
ABSTRACT
Charged pion pair photoproduction has been investigated up to a gamma energy of 1500 MeV, using the Cal tech 12-inch heavy liquid bubble chamber '·1ith a small diameter, high intensity photon beam
passing through a central beam tube gaseous hydrogen target surrounded by the sensitive freon. Scanning, analysis, and data reduction
techniques have been developed to deal with the problems of two-vie,·7 stereo, hidden event origins, absence of magnetic field, and the range-energy and multiple scattering relationships that occur in the heavy materials. Roughly 5700 pictures have been scanned and
analyzed, yielding 754 acceptable events. Cross section and parameter distribtions are generally consistent with the results of previous experiments. A statistically insignificant "bump" was observed in the dipion mass spectrum in the region of L~OO HeV, the disputed cr meson mass. This region '·1as investigated as carefully as the limitecl statistics would allow; dipion angular distributions <He consistent with isotropy, and there is indication that some of the
events in this region might come from decay of an intermediate
N~
1
(1425) into a proton and dipion.TABLE OF CONTENTS
ACKNOWLEDGMENTS ABSTRACT
LIST OF ILLUSTRATIONS LIST OF TABLES
CHAPTER
I Introduction
II Experimental Method III Experimental Procedures
IV Results
APPENDICES I II III IV
v
VI VII VIIIIX
Beam Line Configuration Beam Monitoring
Scanning and Analysis Equipment Scanning and Analysis Procedures Event Reconstruction
Background
Particle Momentum Measurement Multiple Scattering
Event Generation Computer Program
Appendix I I I III
IV
vi APPENDICES TitleBeam Line Configuration
A. Radiator Placement and Beam Orbit B. Beam Hardening
C. Collimation) Scraping) Sueeping and Shielding
D. Target
E. Beam Monitoring Equipment F. Component Alignment
Beam Monitoring
A. Beam Monitoring Logic B. Early Beam Dump
C. Beam Absorption
D. Calibration of Ion Chamber E. Counter Telescope Electronics F. Beam. Correction Summary
Scanning and Analysis Equip:nent A. The First Scanner
B. The Analyzing Scanner C. The Data Recorder D. Scanning Aids
1. Scanning Board 2. Ray Tracer 3. Epsilon Limiter 4. Track Starter
E. Operation and Stability for Analysis Scanning and Analysis Procedures
A. Scanning Procedure B. Scanning Evaluation
v
VI
VII
VIII
IX
C. Analysis Calibrations
D. Direction Measurement Technique E. Analyzing Table Procedure
F. Computer Output Processing G. Analysis Evaluation
Event Reconstruction A. Program Logic B. Data Format
C. Visible Track Reconstruction
1.
Bubble Chamber Optics Calculation a, Chamber Position Calculatinn b. Chamber Direction Calculation c, Film Image Calculation2. Corresponding Point Generation D. Event Synthesis
1. Starting Parameter Estimation
2.
Likelihood Function Maximization 3. Alternate Hypotheses4.
Output E. Accuracy BackgroundA. Visual Background B. Analysis Background
C. Scanned Track Distributions D. Background Error Evaluation Particle Momentum Measurement
140 143 146 147
149
153 153156
157
157
158166
169
171179
181 184 188189
189
198198
199
209 213217
A. Range-Energy Relationship 217
B. Multiple Scattering Momentum Measurement 226 Multiple Scattering
A. Single Medium Distribution
B. Multiple Scattering in Two Media Event Generation Computer Program
viii
LIST OF ILLUSTRATIONS
Figure Text
...
1 Feynm~n Diagrams for N;3 Photoprocluction
2 Feynman Diagrams for p
0 Photoproduction 3 Experimental Arrangement and Beam Area 4 Pion Pair Event
5 Pion Pair Event with Pion Star
6 Pion Pair Event with Background Track
7 Two Pion Pair Events '·1ithin Scanning Resolution 8 Total Cross-Section Compared to Other Experiments 9 Model Contribution Compared to Other Experiments 10 11 12 13
14
15 1617
1819
Data Dipion Nass Distribution, E
<
600 yData Isobar Mass Distribution, E
<
600 yData Dipion Mass Distribution, 600
<
E<
1060 yData Isobar Mass Distribution, 600
<
E<
1060 yData Dipion Mass Distribution, E
>
1060 yData Isobar }wss Distribition, E
>
1060 yGenerated Phase Space Dipion Mass Distribution, 600
<
E<
1060y
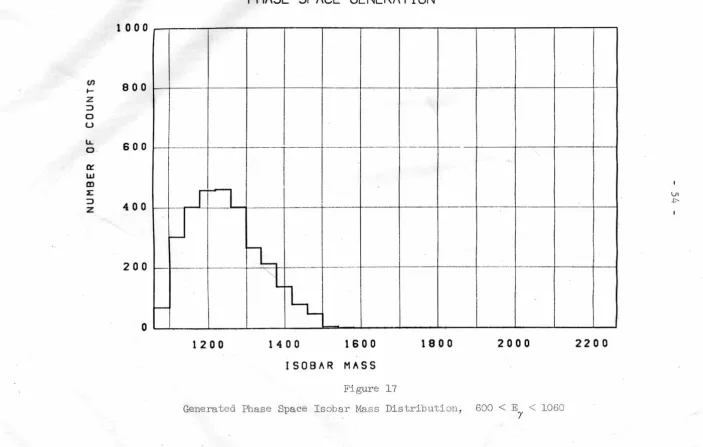
Generated Phase Space Isobar Hass Distribution,
600
<
E<
1060y
·'·
GeneratedN;
3 Dipion Mass Distribution, 600
<
E<
1060y ·'·
Generated N]3 Isobar Mass Distribution, 600
<
E<
1060y
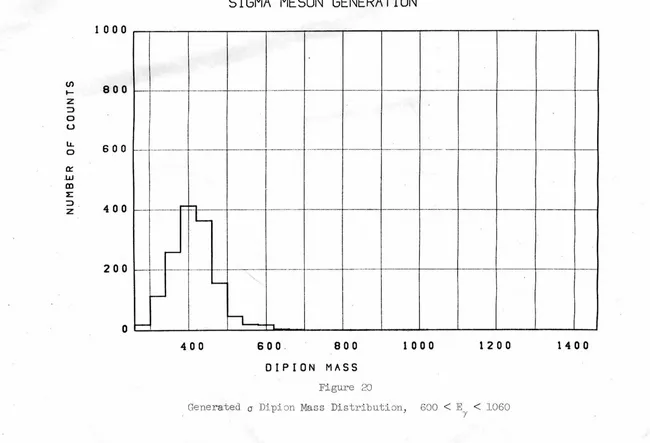
Generated
a
Dipion Mass Distribution, 600<
E<
106021 22 23 24
25
26
27 2829
30 31 32 3334
35 3637
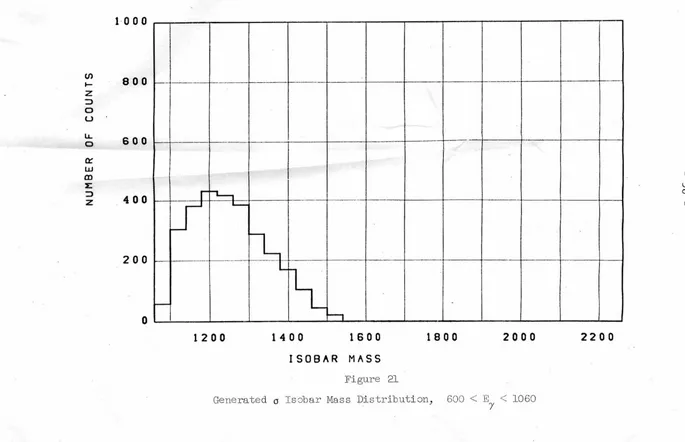
38Generated
a
Isobar Mass Distribution, 600<
E
<
1060y
Generated p Dipion Mass Distribution, E
>
1060 yGenerated p Isobar Mass Distribution, E
>
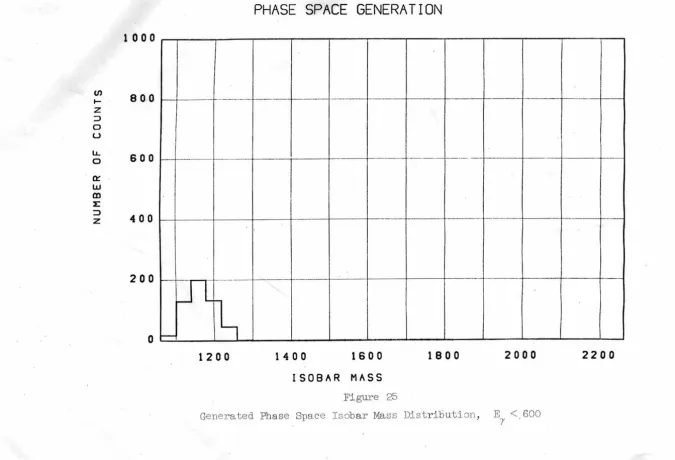
1060 yGenerated Phase Space Dipion Nass Distribution, E
<
600y
Generated Phase Space Isobar Hass Distribution, E
<
600y
*
Generated N33 Di pion Mass Distribution, E y
<
600..;,
Genera tecl N33 Isobar Mass Distribution, E
<
600 yGeneral COM l>olar Angle Distribution of Dipion, E
<
600y
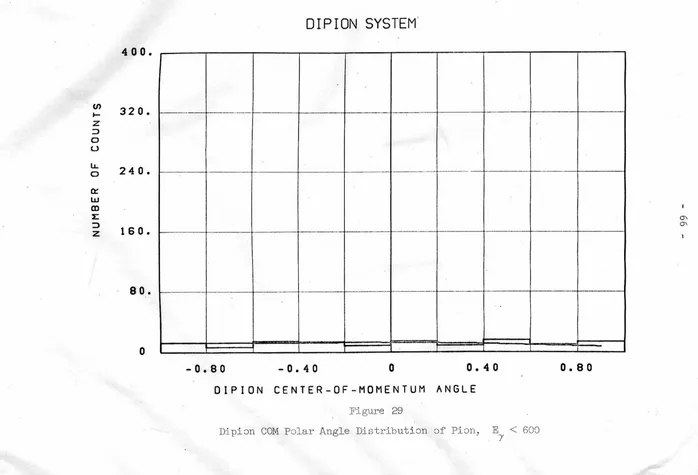
Dipion COH Polar Angle Distribut:ion of Pion, E
<
600y
Dipion COM Azimuthal Angle Distribution of Pion, E
<
600y
General COH Polar Angle Distribution of Isobar, E
<
600y
Isobar COM Polar Angle Distribution of Pion, E
<
600y
Isobar CON Azimuthal Angle Distribution of Pion,
E
<
600y
General COM Polar Angle Distribution of Dipion, 600
<
E
<
1060y
Dipion COM Polar Angle Distribution of Pion, 600
<
E<
1060y
Dipion COH Azimuthal Angle Distribution of Pion, 600
<
E<
1060y
General COH Polar Angle Distribution of Isobar, 600
<
E<
1060y
Isobar CON Polar Angle Distribution of Pion, 600
<
E<
106039
40
x
Isobar COM Azimuthal Angle Distribution of Pion, 600
<
E<
1060y
General COM Polar Angle Distribution of Dipion, E
>
1060y
76
77
41 Dipion COM Polar Angle Distribution of Pion, E
>
1060 78y 42 43 44 45 46 47 48
Dipion COM Azimuthal Angle Distribution of Pion E
>
1060y
General COM Polar Angle Distribution of Isobar, E
>
1060y
Isobar COM Polar Angle Distribution of Pion, E
>
1060y
Isobar COM Azimuthal Angle Distribution of Pion, E
>
1060y
Dipion Mass Distribution for Three Regions of Momentum Transfer (600
<
E<
1060)y
Total Energy Distribution for Three Regions of
Momentum Transfer (600
<
E<
1060, 360<
Dipion Mass<
480) yDipion Angular Distributions (600
<
E<
1060, 360<
Dipion Mass<
480) YAPPENDICES 79 80 81 82 85 87 90
A
I-1 Bremsstrahlung Energy Spectrum in Target 98A V-1
Data Analysis Program Logic Flow 154A V-2 Bubble Chamber Optics Calculation Schematic Views 159
A V-3 Track Segment Description Schematic 175
A VI-1
Background Event Parameter Distributions 215A VII-lMultiple Scattering Range Effect Schematic 220
A VII-3
A IX-1
Multiple Scattering Momentum Measurement
Accepted Event Origin Distribution.
227
Table
1
2
3
A II-1 A II-2 A :n-3 A IV-1 A IV-2 A IV-3 A V-1 A V-2
A VI-1 A VI-2 A VI-3 A VI-4 A VI-5 A VI-6 A IX-1
xii
LIST OF TABLES
Text Page
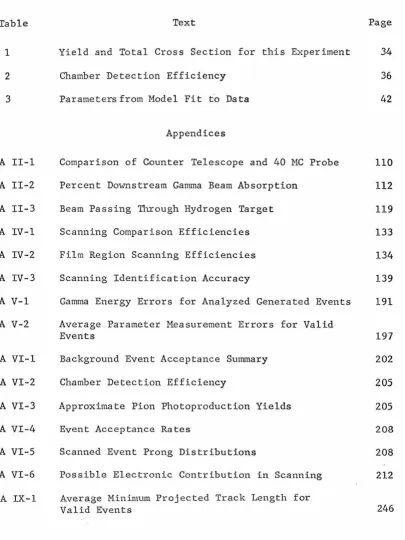
Yield and Total Cross Section for this Experiment 34
Chamber Detection Efficiency 36
Parameters from Model Fit to Data 42
Appendices
Comparison of Counter Telescope and 40 MC Probe 110
Percent Downstream Gamma Beam Absorption 112
Beam Passing Through Hydrogen Target 119
Scanning Comparison Efficiencies 133
Film Region Scanning Efficiencies 134
Scanning Identification Accuracy 139
Gamma Energy Errors for Analyzed Generated Events 191 Average Parameter Measurement Errors for Valid
Events 197
Background Event Acceptance Summary Chamber Detection Efficiency
Approximate Pion Photoproduction Yields Event Acceptance Rates
Scanned Event Prong Distributions
Possible Electronic Contribution in Scanning Average Minimum Projected Track Length for Valid Events
[image:12.531.44.449.88.628.2]I. INTRODUCTION
With the success of counter telescope and magnetic spectrometer
techniques in studying single pion photoproduction processes, and the
discovery of resonance phenomena associated with.their production,
attention naturally focused on the photoproduction of pion pairs as
the next step up the ladder of complexity in pion photoproduction.
The old techniques were not so easily applied to this problem, and they
often led to low counting rates. Since its advent into the family of
particle detectors, the bubble chamber has been recognized as an
especially useful tool in high energy reactions with more than two
particles in the final state. This thesis reports work done on the
photoproduction of charged pion pairs from hydr~gen, using the Caltech
heavy liquid bubble chamber.
Charged pion pair photoproduction has been under study for the
1-27)
past twelve years . Early work was directed toward measurement of
negative pion yields from photoproduction in hydrogen, with charge
con-1- 6 )
servation implying pion pair production Then the negative pion
was detected in a magnetic spectrometer together with the positive pion
in a counter telescope 7). This study corroborated earlier indications
that, in the general center-of-momentum system, the rt went forward with
low energy, while the rt+ was isotropic with higher energy, inferring
the intermediate production of a doubly charged pion-nucleon isobar.
However, counting rates were low and coverage of all available reaction
phase space would be very difficult with this procedure.
2
-8 9 )
employed a hydrogen-filled diffusion cloud chamber ' • These results gave the above picture, with the exception that rt- energies were no longer peaked toward low values for ganuna energy (E ) in the
y
range 700
<
E<
1000 MeV as they had been in the range ·y500
<
E<
700. They concluded that the first pion-nucleon. resonance, y*
*
N
33(1238), was indeed present, but that y + P ~N +rt was probably not the only mechanism for pion pair photoproduction in this energy region.
Forward photoproduction of negative pions from hydrogen was 10)
measured with a magnetic spectrometer in an attempt to discover whether such peripheral interactions could be explained by the
one-11)
pion-exchange model of Drell . Angle and energy distributions agreed in shape with Drell's theory, but the cross-section came out roughly a factor of two higher, indicating that this was probably
. . 12) not the only process contributing •
f h . . . 13) 1 d
Discovery o t e p meson in rt-rt interactions e to a search for its presence in pion pair photoproduction. The proton and one of the pions were detected in magnetic spectrometers so set
*
up that Prt invariant masses in the region of the N33 would be avol..ded14
>.
Th e p was in · d ee d f oun d t o b e presen t .Desirability of a rt-rt resonance in the neighborhood of
400 MeV invariant mass (so-called
a
meson) to explain energy spectra and branching ratios of Kand~
meson decay15) and the K1 - K2 mass difference16) as well as indication of its existence in rt-rt spectrum
- 17)
pair photoproduction. Del Fabbro et al., using spark chambers and
counters18, l 9) found some evidence for such a resonance.
. 20 21)
Recent work by the Cambridge Bubble Chamber Group '
and the DESY Bubble Chamber Group22) has extended pion pair
photo-production up to incoming gamma energies of 5.5 GeV by passing a
photon beam directly through a hydrogen bubble chamber. They find
*-H-t ha*-H-t up *-H-to 1200 MeV N
33 production dominates the reaction; above this
*
energy N
process.
production decreases and neutral p production dominates the
In N* production they find disagreement with the
one-pion-exchange model of Drellll), but their results agree with the
one-pion-exchange model of Stichel and Scholz23), who modified Drell's model to
include corrections for gauge invariance. However, the sharp peaking
of the N* production cross section in the region of total system
~-k
**
invariant mass approximating that of the N
13 (1512) and N15 (1688)
*
pion-nucleon resonances suggests that perhaps the N33 might be
produced via these resonances. Neutral p production at higher energy
and low momentum transfer to the proton agrees better with the
diffraction model of Berman and Drell24)than the one-pion-exchange
d 1 P . f f h 0 d . h h
mo e . rimary ·eatures o t e p pro uction are t at t e
cross-section remains relatively constant (in the neighborhood of 12µ barns)
at high energy, and that the angular distribution of the p is strongly
peaked forward in the total center-of-momentum system.
Theoretical predictionshave enjoyed limited success in
understanding pion pair photoproduction. At low energy, the theory
- 4
-contribution comes from having one pion produced in an S state and
one in a P state. Carruthers and Wong26) take this P state to be the
*
obvious N33, and
Chasan et al.
9
)
find fairly good agreement with the results of
*
below 1000 MeV. S-wave photoproduction of anN
and a pion gives rise to the abrupt rise in the cross- section at the
*
N
threshold, similar to the rapid rise in cross-section at threshold+
for y+ P ->N +rt
.
In the region of 1200 MeV, the Drell calculation of the
one-pion-exchange model 11) gave qualitative but not quantitative agreement
with the data of Kilner, Diebold and Walke/O). Itabashi12) added
the interaction current diagram to Drell's pion current diagram
(see Figure 1), and the static Chew-Low model yielded agreement with
the results of Kilner et al. More recently, Stichel and Scholz23)
have made a gauge-invariant extension of Drell's process which
contains contributions from all four diagrams of Fig. 1. They point
out that their results correspond to those of Itabashi in the static
limit, so that their model is a relativistic generalization of the
22)
static theory. The DESY group find that the energy dependence of
*
the N photoproduction cross-section and the angular distribution of
*
the N decay agree with the model of Stichel and Scholz for gamma
*
energies below 1500
MeV;
above that value N production isover-0
shadowed by p production.
For the
po
production dominating pion pair production at highenergy, the primary models considered have been one-pion-exchange
in Fig. 2). Consideration of the CEA 0) and DESY ) results indicates disagreement of one-pion-exchange with the data for the
0
p decay distribution and the dependence of the cross-section on gamma energy and momentum transfer. The diffraction model fits the momentum transfer and gamma energy dependence somewhat better. Corrections to one-pion-exchange allowing for absorption in the final state may improve the momentum transfer dependence agreement with the dataJ but still give much too low a value for the total cross-section20J22).
The primary objective of this experiment was to obtain added information on the total cross-section and·cross-sections differential in energy and angle for charged pion photoproduction in the region below 1500 MeV. In addition there was a search for whatever
resonant states might be present in pion-nucleon or pion-pion systems:
*
0*
N , p , and
a
might be anticipated. The N was expected to figure prominently in the data since this energy region is just the one*
*
dominated by the N . It was hoped that if the N was produced in significant quantities from one of the higher isobar resonances that this fact would be obvious from the data; otherwiseJ angular
distributions could be compared to the theoretical predictions
N
p
1l
One Pion Exchange
/
I
I
'
/
/ /
I I
I
/ 1l
Interaction Current
- 6
-Figure 1
-)(-1l
p
N
-x-Intermediate N
*
N*
NExchange Cross Te1m
Fe;</T1man Diagrams for N
*
N
I
I I
I I I I I
0 1(
I 0
/
p
I
I
One Pion Exchange
I I
I
I I I I 0
/
P
1(
---0---p w
---
---I I
Diffraction Mechanism
Figure 2
0
8
-II. EXPERIMENTAL METHOD
The basic technique for studying pion pair photoproduction in
this experiment was similar to that of most bubble chamber experiments:
pass a beam of particles through the center of the bubble chamber, take
photographs of the resultant interactions, scan the photographs for
the desired configurations, and analyze the event candidates in a
computer to select the valid events. Novelties introduced by the
desire to maximize the amount of beam per picture were the use of a
heavy sensitive liquid in the chamber, and absence of a magnetic
field surrounding the chamber. Motivation for this large beam
content per picture was the necessity of economy in chamber
construction and execution of the experiment, and the uncertainty of
the lifetime of the chamber.
The traditional approach of passing a particle beam through a
hydrogen bubble chamber surrounded by magnetic field is unworkable for
high intensity photon beams because the copious supply of low
momentum, forward-going electrons produced by photon interactions
in the hydrogen would be bent throughout the volume of the bubble
chamber by the magnetic field, obscuring the desired high momentum,
wide angle processes. Thus, the use of a high-intensity photon beam
dictates that there be no magnetic field on the bubble chamber*), so
*) One might conceive of using a magnetic field parallel to the
photon beam, but bending of the desired pions and protons into the "shadow" of the photon beam would probably produce considerable identification difficulties, along with the loss of low-energy particles. Track reconstruction from stereoscopic views would
that products of electromagnetic interactions may continue in the
forward direction characteristic of high-energy electronic
inter-actions and leave the majority of the chamber volume unobscured.
Loss of magnetic field momentum and charge sign measurement
leaves the hydrogen bubble chamber experimenter with only the
particle direction measurementJ giving no kinematical constraints on
a non-coplanar pion pair production (a coplanar process is under
-determined). ThusJ i t was felt to be desirable to use a heavy
liquid chamberJ with the promise of energy measurement on the
pa.rticles that could be made to stop in the chamber J and the added
constraint of some degree of qualitative particle identification
based on bubble density and multiple scattering in the liquid.
Use of the heavy liquid itself as the photon target was
undesirable for two reasons. The larger atomic number of the heavy
liquid would lead to greatly increased showering and electronic
multiple scattering compared to that in hydrogenJ obscuring much
more of the chamber volume. The presence of considerable proton
internal energy within the neavy nucleus would make event analysis
more difficult) seriously reducing the number of constraints on the
kinematical system. ThereforeJ the approach used in this experiment
was to fill the Caltech 12-inch bubble chamber with freon (CF 3Br),
Footnote continued from previous page
become more difficult. This approach also would have made the chamber
10
-using a high pressure gaseous hydrogen target contained within a central beam tube28) surrounded by the sensitive liquid (See Appendix
I). Detailed discussion of the resulting background is left to
Appendix VI; general features are that obscuring background throughout the chamber volume at the average beam intensity of 3.1 x 10⁵
equivalent quanta per picture was sufficient to be a nuisance though not a serious drawback, and that the background rate (largely from
coincidence of single and double pion production) was 9.1 percent of the total event rate.
Figure 3 shows the experimental ar::::angement in the beam area. Since plenty of intensity was available from the synchrotron, the beam diameter was kept small (about 1/16 inch at the chamber), allowing the beam tube to be relatively small and providing a weak constraint on event origin location. A well-shielded primary collimator removed most of the unwanted beam as close as possible to the synchrotron source. "Beam hardeners" containing lithium hydride surrounded by a pulsed magnetic field removed most of the worst background-causing gamma radiation below 10 MeV while passing half the higher energy incident radiation. A second collimator removed the wider angle radiation produced in the beam hardener and defined the· circular beam shape; subsequent sweeping magnets
deflected any charged particles produced at the second collim~tor.
A large lead scraper blocked passage of charged particles and gamma
AL.
----COUNTER
TELESCOPE
VAC\,\J'M BEAM TUBE
MONITOR SC1NTILLATOR
T---
___
_
_
LEAD SCRAPER
LINAC
Fi
gure
3
Experime
ntal
Arranee~entand
Beam Area
PRIMARY COLLIMATOR
12
-passed through the beam tube. After passage through the central beam
tube hydrogen target, the beam intensity was monitored by a counter
telescope looking at a polyethylene target in the beam. The
tele-scope was itself continually calibrated against an ion chamber during
the run. Further details of the beam line components and how they were
aligned are given in Appendix I. Beam monitoring is discussed
further in Appendix II. Details of bubble chamber construction and
. operation are available elsewhere29,3o,Jl).
One of the most difficult aspects of this experiment was the
laborious task of scanning the film for the three-prong events that
might be candidates for pion pair production. Scanner training times
ranged from one to four months, and scanning efficiencies ranged from
50 percent to 96 percent, with the result that much of the film had
to be multiply scanned (see Appendix IV for a more thorough discussion
of scanning techniques and efficiencies). Scanning rates were also
low; most of our people averaged between five and ten pictures per
hour. Iri one year's time and running an average of two to three shifts
on the two scanning machines available to this experiment (one of
which was used part-time for analysis - see Appendix III for details
concerning these machines) we were able to adequately scan about
13,000 pictures. An upper limit to what might be expected from fully
trained personnel (assuming double-scanning on the average) is about
100 pictures per machine shift per week. One machine run three full
shifts could then turn out at most 15,000 pictures (about 2,000
An equally serious limitation on this experiment is the analysis
time required, particularly in view of the fact that only the one
machine is set up to do analysis. In general, three event candidates
were accepted at the scanning table for each valid event. An average
of 2.5 measurements were required per event candidate. About nine
months were spent analyzing the 5,700 pictures considered in this
thesis,but that is not a representative rate, since we had to learn
how to do the analysis (Appendix IV contains more detail on analysis
procedures).
A
reasonable upper limit to the analysis rate may beobtained from the average event candidate measurement rate of four
per hour. Three full shifts of analysis could then produce up to 60
valid events per week, or about 3,000 per year. Thus the analysis
table could keep pace with the 1 1/2 scanning tables, and even with
experienced personnel i t would require 2 1/2 years to scan and
analyze the 52,000 pictures taken in two week's running time with
the bubble chamber.
The major portion of event processing expense occurs in
running the event analysis program in the IBM 7094 (see Appendix V
for details of performance and speed). The total cost of scanning,
analysis, and computation comES to about thirty dollars per valid
event. Thus some of the economy in the high beam intensity inside
the central beam tube is lost from the more complicated scanning and
analysis procedures required.
A very serious limitation to this experimental procedure is
14
-and analysis inefficiency, with increased chance of systematic errors
creeping in. Average chamber detection efficiency for pion pair
production is only about 20 percent, with the low momentum transfer
processes that are often of theoretical interest being completely
lost because all the reaction products go in the forward direction
down the beam tube. Scanning efficiencie's are low, as noted above,
and this makes their inevitable daily fluctuations more serious. Some
scanning biases can be allowed for (minimum average detectable track
length, for example; see Appendix IX), but with low efficiencies there
is more chance for undetected systematic bias. Analysis and computer
processing efficiency (about 95 percent) should contribute the least
error of the three, since i t has the highest efficiency and a
relatively good correction can be applied for what is lost.
Since the final accuracy of an experiment like this one is so
strongly dependent on the quality of work performed by scanners and,
analyzers, i t was necessary to develop analysis procedures that
monitored human performance as well as evaluating equipment and
analysis method accuracy, Procedures used in this experiment are
III. EXPERIMENTAL PROCEDURES
Although an earlier bubble chamber run in the sping of 1964 had
yielded 80,000 pictures at a synchrotron end point energy of 1350 MeV, this thesis reports work done on part of 105,000 pictures taken in
early September, 196Lf at 1500 MeV.
Immediately after completion of chamber and beam component
lineup, the data run was begun, and i t required approximately two
weeks. Checks performed before, during, and after the run indicated
that chamber operation, beam component lineup, and beam monitoring setup remained stable during that time. The run itself simply consisted of taking the pictures and recording beam intensity data,
with beam calibration data being taken at the end of the run. Beam measurement and configuration stability are discussed in Appendix II.
Scanning techniques had been developed on earlier film, so
that serious scanning could begin the moment the film was developed.
Scanners were trained by si_mply having them scan film; when i t
appeared that their work was becoming good, they were assigned a test
region to check their scanning efficiency. Only after this efficiency
exceeded approximately 75 percent were they considered competent to scan film fo.r this experiment; then the number of scanners assigned to a given region of film depended on their efficiencies.
Five 240-picture regions from four rolls of film were set
aside as scan comparison regions: these were regions scanned by many
people and analyzed very thoroughly to establish confidence in their
16
-were based primarily on work done and these comparison regions, though some comparison between individuals ,.7as also done in other film areas. Scanning was directed toward finding any configuration of three or more tracks that might be pious or protons coming from one origin region on the beam line. Scanners assigned qualitative particle
identifications to tracks and indicated whether or not tr~cks stopped
in the l i t chamber volume, though these decisions were open to question in later analysis. Details of scanning method, scanning
efficiencies, accuracy of qualitative identifications and other questions dealing with general film scanning efficiency are discussed in
Appendix IV. Scanning equipment description may be found in Appendix III.
Pictures of typical good event configurations as they were
accepted by the scanner are shown in Figures 4 to
7.
In Fig. 6 i t may be seen that the three tracks in the valid event line up well together, while the other track, probably from nearby single pion or pion pair production (indicated by dashed line) yields a worse lineup but was accepted in the scanning as a possibility. Figure7
shows one of several cases of two pion pair production events occurring soclose that they were written up together.
Analysis equipment and procedural details are split between Appendices III and IV, respectively. Analysis consisted of
measurement of track coordinates and reftrence fiducial marks in each
-of the measurements was to determine the location of the first visible point on the track, track direction at that point, visible
track range, and particle multiple scattering.
Analysis training was accomplished by having the analyzer repeat the analysis setup measurements (Appendix IV) where the answers were knmm until his work became careful and accurate. Training time was considerably shorter than that for scanning; we wonder if that is not related to the fact that those measurements were so boring to perform. Analysis of scanned data was begun in March, 1965, but had to be restarted in June after it was discovered
that the digitized protractor being used to measure initial track direction led to such large errors that valid events were being lost and invalid ones accepted. Replacement of this technique with
determination of track direction from the second measured point on the
track is discussed in Appendix IV.
The computer program written to generate event hypotheses in
the IBM 709l~ from the digitized measurements is described in some
detai l in Appendix V. It reconstructed three-space track coordinates
given corresponding or almost-corresponding*) point measurements in the two stereo views by means of a corresponding point generating
pro-cedure·. Then, using the Maximum Likelihood Method 32' 33) implemented
*)
Corresponding points are the two images on the film of a singlebubble in the chamber. Almost~or pseudo-corresponding points
are two points on the film (one in each view) that are close to
corresponding points from a bubble on a particle track.
Assumption that two almost-corresponding points are corresponding will usually lead to a calculated chamber "source bubble"
26
-by the Variable Metric Minimization Method 34), i t investigated al l
reasonable hypotheses for pion pair photoproduction from the tracks
present in the event, in general allowing any combination of three
tracks, and changing of particle identification and stopping criteria.
Summaries of all acceptable hypothesis parameters (acceptance based
on chi square probability being greater than 0.1 percent and gannna
energy within 20 percent of being possible) were printed out and punched
onto cards.
Computer output was examined by specially trained personnel to
determine which of the hypotheses candidates were in fact possible.
Since poor measurement could result in incorrect hypotheses, the
computer output was examined for several possible indicators of
trouble (see Appendix IV for details). Questions of particle
identification and stopping changes were resolved by re-examining the
event on the scanning table before a decision was made. If doubt
remained, the event was remeasured. Total event failure also resulted
in several remeasurements to ascertain that failure was not due to
poor measurement. This analysis check at the scanning table
occasionally turned up scanning errors and missed tracks, which were
then incorporated into analysis.
After roughly fifty events had been accepted, i t was realized
that their origin distribution was not coming out centered on the beam
line. In the belief that the center of the event origin distribution
should accurately reflect the center of the beam line and that the
the beam line depth measurement and errors in the medium indices of
refraction (which was consistent with the knm-m errors), the beam line location was changed by
0.135
cm, and the original datare-processed. When 246 events had been accumulated, this spacing was
changed further by
0.060
cm. Later re-analysis of all events then shm·1ed the origin distribution to be centered on the beam line to better than0.01
cm.With event analysis about 80 percent complete, analysis of a
group of computer-generated events showed that the computer data
analysis program was biasing the results in such a way as to yield too
high a value for gamma ·energy, ~-~ system invariant mass, and P.-~
system invariant mass on some events (notably those with little or no constraint from stopping particles). Analysis was halted until the difficulty was located. There were two important contributors to the
biasing effect: (1) the measurement error associated with the first visible point was not included in the analysis of track sc~ttering in
the hidden regions of the beam tube (it had been included in the observed track direction error), and (2) the multiple scattering momentum measurement had been treated in a manner analogous to the range-energy momentum measurement in the likelihood function. The
point measurement error had not been included since, for most events,
the direction measurement error and hidden region multiple scattering
represent much larger contributions to the uncertainty in track production direction than the point measurement error. Its
28
-difficulty arises because the error in the multiple scattering
momentum measurement is comparable to the quantity itself J and is really a function of the true value rather than the .. measured value. Present
(corrected) treatment of these two effec~s is handled in Appendices VIII and VIIJ respectively; the final form is exhibited in AJ:>peridix V.
Of courseJ event analysis could be completed with the corrected programJ but re-processing of all the data already handled would have been far too expensive in time and money. The one ray of hope was that the old program had returned the correct hypothesis almost 90 percent of the time on the generated events; i t had even given the correct numbers on over half of those. Thus i t was decided to re-process all accepted events, forcing the computer to consider only the hypothesis that had been accepted; this procedure cut analysis time and cost by more than a factor of 15. Room for error was still left in those cases where there were several hypothesis possibilitiesJ so all formerly accepted events having a chi square probability of less than 1 percent or making particle identification or stopping changes were re-processed (several measurements each) in a fashion allowing all hypotheses. In additionJ events in the scan comparison regions having any reasonable possibility of hypothesesJ particle identification or stop change were re-processed in detail. From this last set of
data, the number of valid events remaining where the wrong hypothesis might have been taken is estimated to be about 0.9 percent of the
total accepted events, and the number of invalid events accepted
the total accepted events.
Besides the acceptance of incorrect hypotheses, there is
the possibility of valid events being rejected. A category of
question-able failures had been kept, and these were automatically re-processed.
Formerly accepted events that failed under the new program were re-processed several times (re-analyzing, if necessary) before
being discarded. Finally, an area consisting of the scan comparison regions plus another L~OO-picture region was selected for failure
investigation; all events that were felt to have any reasonable chance
of being valid were re-processed. Results of this last run lead to the estimate that 3.0 percent of the valid events were lost from
having failed with the old program and not being re-run with the new
one.
Combining the figuresabove, i t appears that the accepted event count should be augmented by 2.6 ± 3.0 percent due to
difficulties caused by the initial analysis program being incorrect.
Among the events in question thm:e appeared to be no tendency toward clustering around any energy or mass value, so i t will be assumed that these difficulties have not changed the event parameter
distri-butions. More details relating to the effect of the program change may be found in Appendix IV.
The degree of acceptance of valid events and the inclusion
of background events as valid by the current version of the data
analysis program are discussed in Appendices V and VI, respectively. In sununary i t may be said that the analysis program appears to accept
30
-intensity run in this experiment 9.1 percent of the total event rate is
due to background. In
all
cases coplanar events with no stoppingparticles are not included, since those configurations are
kinematically underdetermined. There appears to be no effect on
parameter distributions among good events due to the lost valid
IV.
RESULTS
The results of this experiment are two-fold in nature: an analysis
procedure has been devised for a heavy liquid bubble chamber equipped
with a central beam tube, and cross sections and contributing
processes for charged pion pair photoproduction have been investigated
up to 1500 MeV garruna ray energy.
As mentioned above, the beam line configuration used (Appendix I)
proved adequate for this type 0f experiment. The largest source of
error in the experiment came from inefficiency in scanning; had the
beam intensity accelerated by the synchrotron been reduced by a factor
of two or three from that used in this experiment, the background due
to the many single-bubble tracks in the chamber plus the accidental
coincidence of nuclear events would have been considerably reduced, with
consequent gain in scanning efficiencies. The computer analysis program,
containing a track reconstruction section and an event synthesis section,
was found to be approximately 96 percent efficient (Appendix V). The
event synthesis section,, which was peculiar to this experiment, was
responsible for that 4 percent event loss. Considering the statistics
of the test, one would then expect that the track reconstruction
section should be at least 99 percent efficient when given good
measurements. This section could be used in any experiment having a
bubble chamber geometry similar to ours, and in particular will be
used by Donald Coyne in his analysis of y + n ~K0 +A, done with the
32
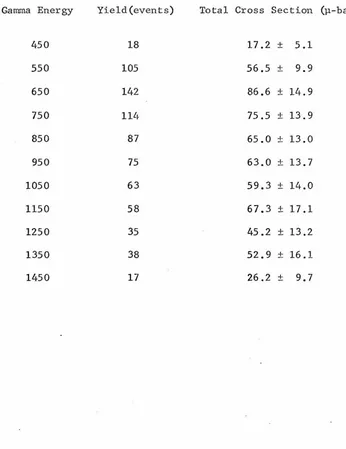
-In this experiment, the yield Y may be calculated from an
equation of the form
y =
Qtf~(k)
cr(k) B(k E )dk-n 1 - b(k) ' 0 k
where k is the photon energy, n is the density of target hydrogen
nuclei, Q is the number of equivalent quanta passed through the target,
t is the target length, E is the over-all detection efficiency, er is
the total cross section, b is the fraction of the total counting rate
due to background events, and B(k,E
0)is the bremsstrahlung energy
spectrum shape function discussed in Appendix I. Yield and total cross
section for this experiment are shown as a function of gamma energy in
Table 1.
Total cross ~ections were obtained by solving the relationship
above for cr(k); because of the limited statistics, the procedure adopted
was that of replacing the integration by the function evaluated at
the middle of the energy bin times the bin width (bin widths were
100 MeV). Since n,Q, and the part of e coming from the scanning
efficiency (Appendix IV) all varied during the course of the run, they
were individually computed for small enough regions that they could
be considered constant, then their products were sununed over all the
film analyzed. All events but one were found to occur between - 13.0 cm
and+ 7.0 cm along the beam line, so this 20 cm interval was the target
length used for t, and was also the visible section for event
generation in investigating chamber efficiency and background
(Appendix IX) . The value of n Q t E for this experiment was
75.08 ± 6.45 x 1030 protons/cm2, the error reflecting the root-mean-square folding together of the relative errors in the components.
After E is removed, the remaining contributions to E(k) come
scan
from analysis.efficiency and chamber detection efficiency. Analysis
efficiency was assumed to be independent of energy; its components were
4.3 ± 2.1 percent event loss by the analysis program (Appendix V),
2.6 ± 3.0 percent event loss from improper re-analysis after the
analysis program change (Chapter III), and 0.5 ± 0.5 percent event
loss from the event chi square limit set. No correction was made for
the possibility of repeated bad analysis of an event leading to its
rejection. It is believed that this effect could be at most a fraction
of a percent for four reasons: 1) nearly all event failures were
measured by at least two and usually three different people to remove
any one person's biases; 2) most event failures had at least three
measurements, some having eight or ten; 3) a small sample of event
failures were remeasured several times to see if any of them would
yield acceptable hypotheses, and none of them did; 4) if the best
hypothesis found, though unacceptable, looked like i t could lead to
something reasonable, or examination on the scanning table showed a
possibility of difficulty in measurement, the event was remeasured one
or two more times than i t might have been otherwise. Thus the analysis
efficiency was taken to be 92.6 ± 3.7 percent.
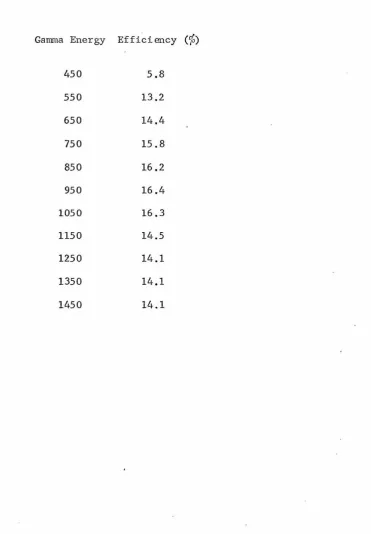
Chamber detection efficiency was a function of ganuna energy, and i t
was computed from the results of a Monte Carlo event generation
- 34
-Table I
Yield and Total Cross Section for this Experiment
Gamma Energy Yield(events) Total Cross Section (µ-barns)
450
18
17
.2
±5
.
1
550
105
5
6
.
5
±9.9
650
1
42
86.6
±14.9
750
l llf75.5
±13.9
850
87
65.0
±13.0
950
7
5
63.0
±13.7
1
050
63
5
9
.
3
±14
.0
1150
58
6
7.
3
±1
7
.1
1
250
35
4
5
.
2
±13.2
1350
38
52
.
9
±16.1
[image:46.533.57.403.189.638.2]pion pair photoproduction were included: phase space production}
N;
3 0isobar production} cr meson production} and p meson production (a more
detailed discussion of the model generation will be given below). For
each model} the chamber efficiency was computed as a function of energy
by drawing a smooth curve through efficiencies calculated every 100 MeV
of ganuna energy (the efficiency was the fraction of events generated
in that bin that 1dere ac.tually visible in the chamber). At each energy
the relative contribution of each model to pion pair photoproduction
was estimated from our data and that of CEA35) and DESY22) (also to be
discussed below). Then the chamber efficiency ·was taken to be the
average of the model efficiencies, weighted according to the relative
contributions of the models at each energy; the results are shown in
Table 2. A relative error of 10 percent was assigned to each value
(except the first, which was 20 percent), reflecting statistical
errors and probable error in the relative contribution of the various
models.
As discussed in Appendix VI, the background event contribution was
taken to be 9.1 percent} independent of ganuna energy. Since
dk B(k,E
0)
k
was so slowly varying over most of the range of interest,i t was evaluated at the mid-point of each bin except for the bin
from llf00 to 1500 NeV, where a rough hand integration was performed.
In addition to the statistical and systematic uncertainties taken
into account above or in the appendices, there are several other sources
of systematic error that affect the total cross section. The
- 36
-Table 2
Chamber Detection Efficiency
Gamma Energy Efficiency
<
%
)
450
5.8
550
13.2
650
14.4
750
15.8
850
16.2
950
16,4
1050
16.3
1150
14.5
1250
ll~.1
1350
14.1
[image:48.530.117.489.137.672.2]equivalent quanta per energy interval) was estimated to be 0.9 percent7')
The bremsstrahlung energy spectr"Jm shape function B(kJE
0) as calculated 37) .
by BPAK is probably accurate to 2 percent. Hydrogen target
conta-mination is less than 1 percent. Uncertainty in the l i t chamber
radius leads to a chamber detection efficiency relative error of
3 percent.
By far the largest systematic uncertainty comes from the energy
dependence of the scanning efficiency. It is obvious that high energyJ
low bubble density tracks are harder to see than low energyJ high
bubble density tracksJ and the shorter the visible track length
becomes the worse the effect is. OriginallyJ the Monte Carlo program
was run with the constant minimal projected track lengths shm-m in
Table A IX-1. Then distributions were run on accepted event tracksJ
which showed that there was a cutoff in the location of the ends of
tracks 0.4 cm from the beam tube in the plane of sightJ and that the
average minimum seen projected track lengths for non-stopping particles
was an appreciable function of track energy. Inclusion of these effects
into the Monte Carlo program reduced the chamber detection efficiency
from 22.5 percent to 15.5 percent at 1250 MeV gamma energy.
Considering the minimum visible length to be a function of particle
velocity (hence also bubble density) does not solve the whole problem;
*)
This uncertainty comes from a probable 10 MeV error in the settingof the end ~int energy, 0.3 percent error in the beam energy meter
calibration )J and estimated synchrotron orbit radius uncertainty of 2 inches leading to C:E./E
=
(1 - n)6.R/R=
0.5 percent (n is synchrotronfield index). The end point energy was not even corrected to the
- 38
-for instance, an event ·with one low energy track and two high energy tracks is far more apt to attract attention than one,.1>here all three tracks have high energy. This was borne out in the distribution of minimal track length vs. particle velocity, where i t was observed that a proton with chamber exi t velocity (3 = 0.7 required about 0.5 cm more visible track length than a pion of the same exit velocity. One might expect the reverse to be true since the proton would then have heavier bubble density in the chamber. This effect is no doubt due to the fact that the heavier bubble density proton was usually the first track to be found in event scanning. If the event proton had already been found one might see a short, dim pion coming from the same origin, but if all three tracks were faint they all might have been overlooked in the selection of tracks for scanning (we have observed in Appendix IV that a low bubble density track is much easier to find when its direction is knmm). We could think of no reasonable way to take this bubble density correlation effect into account without danger of
seriously biasing the data; therefore, i t was not included. Since the different proton and pion treatment at the same velocity partially
at 1500 MeV, and appears to be roughly linear with gamma energy in between. This error estimate t.;ras therefore added to the list of errors discussed above.
Figure 8 shows a comparison of our total cross-section results to those of CEA 35), DESY 22) and Cornell 9). Errors shown for our data are statistical plus systematic, errors being combined by the root-mean-square method. Our values appear low at higher energies, which is very probably due to the minimum-length-to-energy correlation effect between tracks discussed above. There might also be some effect due to a small do-vmward ganuna energy bias in the data since the last point appears to be somewhat lower than the others.
A very crude ·attempt to estimate the relative importance of
various models that might contribute to pion pair photoproduction was made by investigating the dipion and isobar invariant mass spectra. Events were generated by the Monte Carlo computer program under the assumption of four basic models: phase space pion pair production
*
(constant matrix element), N
33(1238) isobar resonance formation, neutral p meson production, and neutral cr meson production. In generating
CIT
e
CROSS SECTION
µ BARNS CEA @
100
1
DESYo
CORNELL
x
80
T
J
L
T
T
T
60
40
20
0
kl
1
400 600 800 1000
GAMMA ENERGY, Me V
Figure 8
1200 1400
Total Cross Section Compared to Other Ex:periments
1600
*
width values used were; N
33(1233, 125), p(740, ll5),
er
(£'.~20, 100).Center-of-momentum angular distributions were taken to be simple
numerical approximations to the empirical distributions obtained by
CEA and DESY.
For comparison with our data (and for chamber detection efficiency
calculation) 2500 visible events each were generated for phase
*
space, N and
er;
500 p's sufficed. The generated events were sortedinto dipion and isobar mass spectrum bins 40 MeV wide, separated into
three regions of gamma energy: E
<
600 MeV, 600<
E<
1060 MeV, andy y
E
>
1060 MeV. Data from our accepted events were similarly sorted y(note that the 40 MeV bin width is somewhat larger than the average
invariant mass measurement errors, shmm in Table A V-2). Then a
computer least-squares fit (using program
NIN,
the variable metricminimization method34)) attempted to match combinations of the generated
spectra to the data in each energy region (isobar and dipion spectra
were fitted simultaneously). The fitting procedure included
statisti-cal errors in the generated events as well as the data. Background was
then subtracted from phase space after fitting.
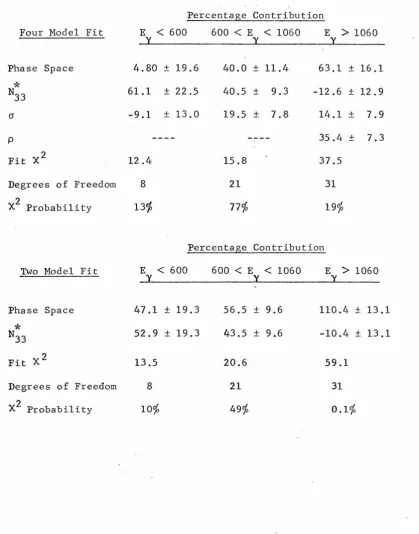
Parameters resulting from fitting all four models to the data (the
p is allowed only in the highest energy region) and from limiting the
*
fit to only·phase space and N are sho>m in Table 3, It is clear that
the data cannot be fit without including the p meson. The case for
the
er
meson is dubious; the fit significantly improves in the centralenergy region when i t is added, but within our limited statistics the
42
-Table 3
Parameters from Model Fit to Data
Percentage Contribution
Four Model Fit
E
<
600
600
<
E
<
1060
E
>
1060
Phase Space
4.80
±
19.6
40.0
±
11.4
63.1
±
16.1
*
N33
61.1 ± 22.5
40.5 ± 9.3
-12.6
±
12.9
(J
-9.1
±
13.0
19.5 ± 7.8
14.1
±
7.9
p
----
35.4 ± 7.3
Fit
x2
12.4
15 .8
37.5
Degrees of Freedom
8
21
31
X
2
Probability13°f,
77%
19°/o
Percentage Contribution
Two Model Fit
E
<
600
600
<
E
<
1060
E
>
1060
Phase Space
47.1
±
19.3
56.5
±
9.6
110.lf
±
13 .1
*
43.5
N33
52.9
±
19.3
±
9.6
-10.4 ± 13.1
Fit
x2
13.5
20.6
59.1
Degrees of Freedom
8
21
31
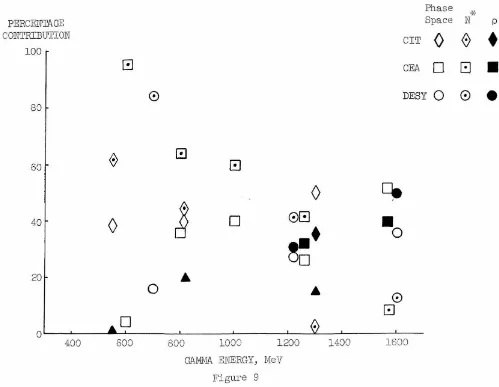
[image:54.533.40.460.109.644.2]Figure 9 shows a comparison of the four model fit to similar fits (excluding the cr meson) obtained by CEA and DESY. The CEA fitting procedure did not fit the dipion and isobar distributions simultaneously; in order to include their results in the comparison we have assumed that a resonance reflected into the other system wocld look like phase space production, and have assigned to phase
*
space the fraction of t~e total rate not attributed to N or p in each energy region.
*
There is poor agreement between our relative assignment of Nand phase space contributions and theirs. We believe that a combination of several factors makes our assignments unreliable. At low energy the curves for the two models look almost identical, making the relative contribution assignment strongly dependent on accidents of statistics and model assumptions made in the generated events (for
*
instance, taking the N center-of-momentum angular distribution flat
*
instead of matching the CEA data changed the N contribution from about 50 percent to 100 percent below 600 MeV gamma energy). In fact, we question whether anyone has good enough statistics to make a reliable estimate at 600 MeV. Even at higher energies, our curves are qualita-tively similar for the two models, an unfortunate consequence of the
+
-fact that we cannot tell the 1{ from the 1{ and therefore have to lump
Phase
-x-PERCENTAGE Space N p
er
CONTRIBUTION
loo
r
CIT0
0
•
A
G
CEA0
G
•
0
DESYQ
0
•
80
0
[!]
so
t
EJ
-i:-0
~
4
o
r
0
~
0
0G
•
~·
0
20
f-
•
0
6
0
EJ
D
o
'
I••
400 600 800 1000 1200 1400 1600
GAM:rll.A ENERGY, Me V
Figure 9
[image:56.687.107.606.70.457.2]indications were that reasonable changes in some of these quantities could make a change in the N* contribution of the order of 20% to 30%, even in the range 600
<
• y E<
1060. Since we were forced to generate a limited number of events for economic reasons, statistical errors in the generated histograms can affect the fit even though those errors are taken into account. We believe that these statistical variations are responsible for the fact that two of the fit coefficients went negative (though were within the probable error of being zero). For Figure 9 these negative values were subtracted fTom the phase space contributions and the negative models assigned zero contribution. A more serious difficulty with event generation was that we could not leave the resonance shape parameters free to be determined by the data;therefore, small biases in the data can change the fit appreciably
*
(we used 1233 instead of 1238 for the N mass because our isobar peak seemed to be of the order of 5 MeV low). Thus we conclude that the CEA and DESY experiments are much more reliable in determining the
*
relative contribution of N and phase space, and we adopted their values in determining our chamber efficiency.
The situation with the p meson is not quite so unfortunate. Even though our p detection efficiency is low due to its forward-peaked distribution, our data for its relative contribution is in good agree-ment with the other experiments. This is no doubt the case because