1
The effect of pH and ionic strength of dissolution media on in-vitro release of two model
drugs of different solubilities from HPMC matrices
Kofi Asare-Addo1, Barbara R. Conway1, Hassan Larhrib1, Marina Levina2, Ali R. Rajabi-Siahboomi2, John Tetteh3, Joshua Boateng3, Ali Nokhodchi4*
1
Pharmacy and Pharmaceutical Science, University of Huddersfield, Huddersfield, HD1 3DH, UK
2
Colorcon Ltd, Flagship House, Victory Way, Crossways, Dartford, Kent DA2 6QD, UK
3
Department of Pharmaceutical, Chemical and Environmental Science, School of Science, University of Greenwich, Kent, ME4 4TB, UK
4
Chemistry and Drug Delivery Group, Medway School of Pharmacy, University of Kent, Kent, ME4 4TB, UK
*corresponding author (Ali Nokhodchi)
E-mail: [email protected]
Tel: +44 1634 202947
2
Abstract
3
hydrochloride. This methodology can be used as a valuable tool for predicting potential ionic effects related to in vivo fed and fasted states on drug release from hydrophilic ER matrices.
Keywords: Ionic strength, HPMC polymeric matrix tablets, Similarity factor, Kinetics of drug release, Hydration, Diltiazem HCl, Hydrochlorothiazide.
1. Introduction
4
There are three types of hydration water, each possessing different physical properties [9]. Type I (freezing or free, bulk-like water) melts at the normal melting point of pure water (0 o
C). Type II (freezing or bound water) weakly interacts with macromolecules and displays a lower melting point than pure water (< 0 oC). Type III (bound water) strongly interacts with hydrophilic and ionic groups of the polymer and shows non freezing behaviour. According to Aoki and co workers [10] during the initial stage of dissolution, water penetrates into the matrix and usually acts as non-freezing (bound) water. In the next stage, the water content of the matrix increases and freezable water is detected at levels that are related to drug release. They also reported that the transport of solutes mainly occurs through the free water and that only little transport occurs through bound water. Yoshioka and co workers [11] studied hydrophilic polymeric gelatin gels and also claimed that bound water did not participate to any significant effect in the hydration process and that the hydrolysis/water uptake rate depended mainly on the amount of free water present in the system. Therefore, knowing the dynamics and state of water molecules in hydrogels enables a better understanding of the swelling process of the hydrophilic matrices and the release of drugs from these systems [12].
5
media pH on a cationic drug and a poorly soluble drug using the USP III Apparatus. This study also explores a differential scanning calorimetry (DSC) methodology as reported by the same authors to determine free and bound water to explain drug release in the different media. This study also explores a Texture analysis (TA) methodology in order to understand ionic strength and its impact on the gel layer strength and drug release. This study gives a greater insight into potential fed and fasted effects on drug release from hydrophilic extended release matrices.
2. Materials and methods
2.1. Materials
Hydrophilic matrix tablets were prepared using Diltiazem hydrochloride (Sigma) or Hydrochlorothiazide (Spectrum) as the model drug and HPMC (METHOCEL™ Premium K100LV, K4M, K15M and K100M (Colorcon Ltd, UK) polymers as the hydrophilic matrix former. Dissolution buffers were prepared according to the USP 2003 using the following materials: potassium chloride (Acros Organics, UK) and hydrochloric acid (Fisher Scientific, UK) for pH 1.2 and pH 2.2 and potassium phosphate monobasic (Fisher BioReagents, UK) and sodium hydroxide (Fisher Scientific, UK) for pH 5.8, 6.8, 7.2 and 7.5 media.
2.2. Tablet Preparation
6
2.3. Dissolution testing and influence of ionic strength
An automated USP type III Bio-Dis (Varian, US) was used to carry out the dissolution studies. The dip rate used for the ionic strength studies was 20 dpm. The absorbance of the released diltiazem hydrochloride and hydrochlorothiazide was measured at 240 nm and 272 nm respectively, using a UV/Visible spectrophotometer (Varian, Cary 50). Drug-release behaviour of all the above formulations was investigated in deionised water and in six dissolution media to determine sensitivity of different grades of HPMC to pH and ionic strength. The dissolution testing was conducted for 310 minutes for all formulations. The influence of media ionic strengths on diltiazem hydrochloride and hydrochlorothiazide release from the METHOCEL K100LV, K4M, K15M and the K100M tablet matrices was studied. 0.2 M and 0.4 M sodium chloride was added to regulate the ionic strength in buffers with pH of 1.2, 2.2, 5.8, 6.8, 7.2 and 7.5. All four HPMC (K100LV, K4M, K15M and K100M) formulations for each model drug were tested using this methodology. This allowed discrimination of the effect of the ionic strength on the formulations where different grades of HPMC were used [14, 15].
2.4. Similarity factor
To determine the similarity between the obtained drug release profiles, f2 factor [16, 17] was calculated as detailed in [14]. Drug release in deionised water was used as the reference in the determination of f2.
7
DSC (Mettler-Toledo) was performed on samples of physical mixtures of drug and polymer after blending described in Section 2.2 were placed in standard 40 µm aluminium crucibles and sealed. The aluminum crucibles were heated from 25 to 300 oC at 10 oC/min rate under nitrogen gas to identify any potential material interactions. The methodology for DSC hydration was taken from [14].
2.6. Texture Analysis of Hydrated HPMC Tablet Matrices
Tablets, prepared as described in section 2.2, were hydrated in either deionised water (0 ionic strength), pH 1.2, pH 1.2 (+ 0.2 M NaCl) and pH 1.2 (+ 0.4 M NaCl) for 10 and 30 minutes using a USP Apparatus II (Paddle) (Varian) at 100 rpm (to mimic dissolution conditions). To avoid the adhesion of the hydrated tablets to the bottom of the dissolution vessel, the dissolution test was modified using a mesh device similar to that described in Durig et al., [18]. After the tablets were placed onto the device, the distance between rotating dissolution
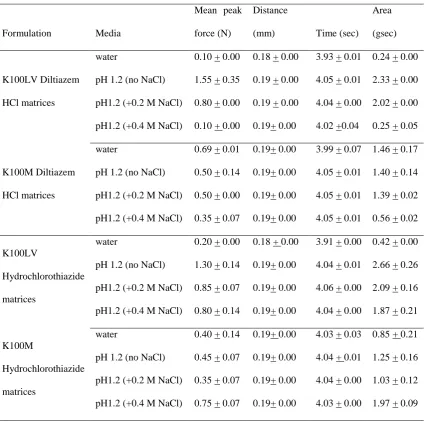
paddle and the device was adjusted back to 2.5 cm (the distance between the paddle and the lower part of the dissolution vessel in the absence of the devise used). After hydration, tablets were removed from the dissolution vessels and placed directly on the platform of texture analyzer (Stable Micro System) equipped with an interchangeable load cell of 5 kg. The 2 mm SMS P/2 was used as the penetration probe. A pre-test, test and post-test speed of 0.05 mms-1, 0.05 mms-1 and 0.20 mms-1 were used respectively. Gel strength was determined as the work of penetration integrated to the first peak normalised by the tablet thickness to the first peak (distance travelled by the probe). The extremes of HPMC K chemistry viscosities (i.e., K100LV and K100M) for both drugs were studied. All experiments were analysed in controlled environment at room temperature and done in triplicate.
8
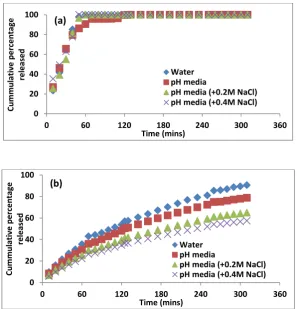
Compacts containing diltiazem HCl had similar volumes (0.282-0.283 cm3) and tablet porosities (35 %). All hydrochlorothiazide tablets also had similar volumes (0.252-0.254 cm3) and similar tablet porosities (27 %) (For full details please refer to supplementary materials Table S1). Figures 1 and 2 show the influence of ionic strength on drug release from tablets
9
ionic effect decreasing the diltiazem HCl dissolution. Mitchell and co workers [22] found that some drug substances such as propananol HCl increased the hydration of HPMC; and that many electrolytes have the ability to depress gel points of polymers by affecting dehydration. It was noted with regards to the poorly soluble drug hydrochlorothiazide that there was a general increase in drug release as the ionic strength of the media was increased. This however was very minimal and not significant. Hydrochlorothiazide is a bivalent acid, with pKa of 8.6 and 9.9 so mostly unionized at pHs studied [23].
10
hydrochlorothiazide was similar at all ionic strengths studied (f2 = 56-81). Also f2 values in “pH media” were the highest (72-81). The K100M tablets were the most robust of all the matrices studied (see supplementary materials Table S3). For the purposes of this study, the similarity values obtained give an indication of the ability of the HPMC matrices to withstand the impact of increases in ionic strength that could occur in the body. This can help to decide which formulations could be excellent candidates for producing drug dissolution profiles affected to a lesser degree by foods rich in ion content. The results of this study show that with hydrochlorothiazide as a model drug, all polymers used could be excellent candidates for producing drug dissolution profiles not significantly affected by foods rich in ionic content. Care must however be taken with regards to the nature of drug used as in the case of diltiazem hydrochloride.
The diltiazem hydrochloride HPMC matrices showed a general decrease with increasing ionic strength (See supplementary materials Figure S3a). This general negative slope in Figure S3a for the diltiazem hydrochloride tablet matrices indicates a reduction in drug
11
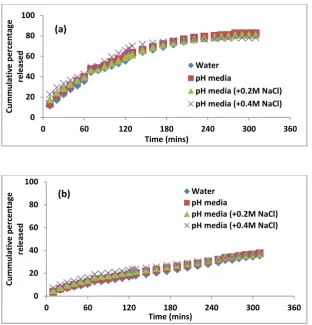
an increased erosion taking place as the ionic strength of the medium increased. These hydrochlorothiazide results were similar to the data obtained for the theopylline matrices as reported by Asare-Addo and co workers [14]. Hydrochlorothiazide release from K100LV matrices increases from 35 % in deionised water to 42 % in the medium with 0.4 M NaCl after 60 minutes. This less significant increase could also be attributed to the poorly soluble nature of hydrochlorothiazide. There was a minimal increase in drug release as compared to the K100LV matrices with increasing ionic strength. For example, 18 %, 15 % and 10 % of drug was released in water and when the ionic strength was increased with the addition of 0.2 M NaCl, the amount of the active released increased to 21 %, 21 % and 14 % for the K4M, K15M and K100M tablets respectively (see supplementary materials Figure S4 and S5). A closer look at the slopes obtained from plotting % release vs. square root of time for different ionic strenths (see supplementary materials Table S4) show that for the HPMC polymers, values were in the order of K100LV > K4M > K15M > K100M. This could be due to a number of reasons, i.e. the gel formed on the surface of the tablet upon its introduction into the medium limiting the amount of drug being transported into the solution as the apparatus moved the matrix from one medium to another. The change in the tablets geometry as a result of agitation in previous medium/media also meant the remaining tablet matrix had a decreased surface area making the little drug remaining in the gel layer to have a relatively lower slope upon its introduction into the ensuing fresh volume of the medium. The K100M tablets however had lower slope values as compared to the K4M and K15M matrices for the model drugs thus demonstrating the resilience of K100M polymer to the effects of agitation.
12
13
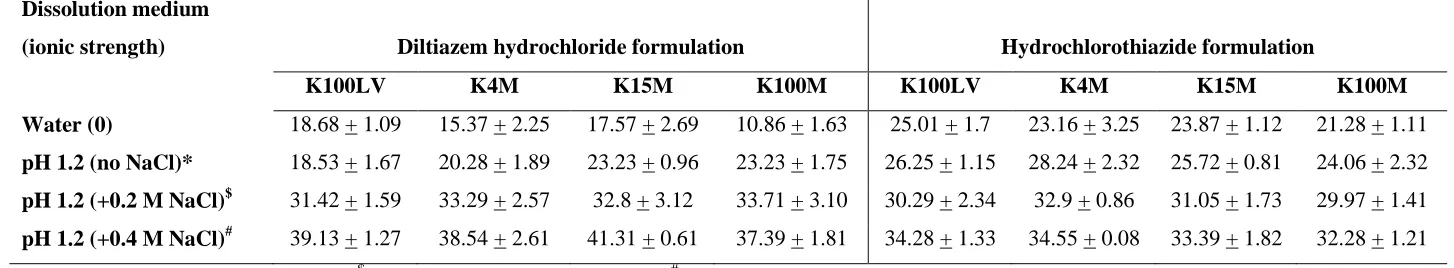
According to Aoki and co workers [10] during the initial stage of dissolution, water penetrates into the matrix and usually acts as non-freezing (bound) water. In the next stage, the water content of the matrix increases and freezable water is detected at levels that are related to drug release. Before hydration of the whole matrix, water penetrates into the dry portion of the matrix, hydrates and swells the polymer. Further penetration of water does not increase the water content of the hydrated portion but newly hydrates a dry portion of the matrix. After hydrating the whole matrix, the amount of water at the surface gradually increases with time. Aoki and co workers [10] also reported that the transport of solutes mainly occurs through the free water and that only little transport occurs through bound water. The K100LV diltiazem hydrochloride formulation, after 10 minutes hydration in the relevant media showed approximately 19 %, 19 %, 31 % and 39 % uptake of bound water in water media, pH 1.2, pH 1.2 + 0.2 M NaCl, and pH 1.2 + 0.4 M NaCl respectively. For hydrochlorothiazide K100LV matrices, 25 %, 26 %, 30 % and 34 % uptake of bound water had occurred in the media as outlined above. This increase in the amount of bound water with increasing ionic strength of the media was evident for all the polymers in the study (Table 1). This increase in bound water suggested that there was less free water available for polymer hydration to form the gel layer necessary for controlling drug release.
14
Hydrochlorothiazide released after 10 minutes also correlated with the DSC hydration experiments. It was observed that as the ionic strength increased, the hydrochlorothiazide release also increased. In the highest ionic strength medium, the amount of bound water was similar for all the formulations suggesting that the strength of the gel played an important role in the drug release pattern. The results show that the first few minutes of hydration are the most important because this period corresponds to the time when the protective gel layer is formed around the matrix [29].
Table 2 shows the mean peak values and areas (obtained by the integration of the area under
15
hydrophilic matrices in deionised water, possibly due to its high aqueous solubility. However when ionic strength was increased, drug release rate was reduced. This phenomenon may be due to interactions between the drug, the polymer and the salt contents in the other media (pH 1.2 (no salt), pH 1.2 (+ 0.2 M NaCl) and pH 1.2 (+ 0.4 M NaCl)). Kavanagh and Corrigan [24] showed the time to attainment of maximum wet weight of K100LV discs to increase with increasing ionic strength with this effect being much less for the higher molecular weight polymer K15M. They showed that dissolution uptake rate decreased linearly with increasing ionic strength and also that the decrease in erosion rate occurring with the increase in ionic strength could be attributed to salting out and loss of water of hydration.
16
also observed that there was a general decrease in the value of n with an increase in the ionic of the media for all hydrochlorothiazide matrices. The poorly soluble nature of this drug however meant that all DE, MDT and MDR values were low compared to diltiazem HCl matrices.
4. Conclusion
Ionic strength of dissolution media had a significant effect on diltiazem release from K100LV matrices. K4M, K15M and K100M were however resilient to the influence of media ionic strength. The poorly soluble nature of hydrochlorothiazide meant that, despite the low amount of HPMC used in this study (20 %), ioinc strength did not impact release rates. The DSC hydration method proved to be useful in explaining the mechanism of hydrochlorothiazide release from HPMC matrices. As a general trend it was found that freely water-soluble diltiazem hydrochloride seemed to increase the drug release rate from the hydrophilic matrices in the presence of deionised water only. However, when ionic strength was increased, drug release rates were reduced. Texture analysis proved useful in explaining these results. Changing dissolution medium ionic strength in this research has shown that this method could be an additional tool in allowing for foods with differing salt contents to be screened, and that both the matrix former and the drug will impact results.
5. References
[1] B. Sasa, P. Odon, S. Stane, and K. Julijana, Eur. J. Pharm. Sci. 27(2006) 375-383.
17
[3] W. N. Charman, C. J. H. Porter, S. Mithani, J. B. Dressman, J. Pharm. Sci. 86 (1997) 269-282.
[4] J. L. Johnson, J. Holinej, M. D. Williams, Int. J. Pharm. 90 (1993) 151-159.
[5] M. C. Bonferoni, S. Rossi, F. Ferrari, M. Bertoni, C. Caramella, Int. J. Pharm. 117 (1995) 41-48.
[6] A. C. Hodsdon, J. R. Mitchell, M. C. Davies, C. D. Melia, J. Control Release 33 (1995) 143-152.
[7] A. Lindahl, A. L. Ungell, L. Knutson, H. Lennernas, Pharm Res 14(1997)497-502.
[8] K. Mitchell, J.L. Ford, D.J. Armstrong, P.N.C. Elliott, C. Rostron, J.E. Hogan, Int. J. Pharm. 66(1990) 233-242.
[9] M. S. Jhon, J. D. Andrade, J Biomed Mater Res 7 (1973) 509-522.
[10] S. Aoki, H. Ando, M. Ishii, S. Watanabe, H. Ozawa. J Control Release 33 (1995) 365-374.
[11] S. Yoshioka, Y. Aso, T. Terao. Pharm Res 9(1992)607-612.
[12] S. Baumgartner, G. Lahajnar, A. Sepe, J. Kristl Investigation of the state and dynamics of water in hydrogels of cellulose ethers by 1H NMR spectroscopy. AAPS PharmSciTech 3 (2002) E36.
18
[14] K. Asare-Addo, M. Levina, A.R. Rajabi-Siahboomi, A. Nokhodchi, Colloids Surf. B: Biointerf. 81 (2010)452-460.
[15] K. Asare-Addo, W. Kaialy, M. Levina, A.R. Rajabi-Siahboomi, M. U. Ghori, E. Supuk, P. R. Laity, B. R. Conway, A. Nokhodchi, Colloids Surf. B: Biointerf. 104 (2013) 54-60.
[16] J. W. Moore, H. H. Flanner, Pharm Technol 20(1996) 64-74.
[17] J.E. Polli, G.S. Rekhi, L.L. Augsburger, V.P. Shah, J. Pharm. Sci. 86 (1997) 690–700.
[18] T. Durig, R. Fassihi, J Control Release 67(2000) 37-44.
[19] L.S.C. Wan, P.W.S. Heng, L.F. Wong, Int. J. Pharm. 116 (1995) 159–168.
[20] J. Siepmann, N. A. Peppas, Adv. Drug Deliv. Rev. 48 (2001) 139-157.
[21] M.C. Bonferoni, S. Rossi, F. Ferrari, E. Stavik, A. Pena-Romero, C. Caramella, AAPS Pharm. Sci. Tech. 1 (2) (2000). article 15.
[22] K. Mitchell, J.L. Ford, D.J. Armstrong, P.N.C. Elliott, J.E. Hogan, C. Rostron, Int J Pharm 100(1993)165-173.
[23] M.F. Tutunji, H.M. Ibrahim, M.H. Khabbas, L.F. Tutunji, J Chromotogr B. 877 (2009) 1689-1697.
[24] N. Kavanagh, O.I. Corrigan, Int. J. Pharm. 279 (2004) 141–152.
[25] D.A. Alderman, Int. J. Pharm. Technol. Prod. Manuf. 5 (1984) 1–9.
[26] I. Katzhendler, K. Mader, M. Friedman, Int. J. Pharm. 200 (2000) 161– 179.
19
[28] A. Nokhodchi, S. Raja, P. Patel, K. Asare-Addo, BioImpacts 2 (2012) 175-187.
20
Table 1. Amount (%) of bound water for different grades of HPMC resulting after 10 min hydration with the relevant media of different ionic strength (n=3)
Dissolution medium
(ionic strength) Diltiazem hydrochloride formulation Hydrochlorothiazide formulation
K100LV K4M K15M K100M K100LV K4M K15M K100M
Water (0) 18.68 + 1.09 15.37 + 2.25 17.57 + 2.69 10.86 + 1.63 25.01 + 1.7 23.16 + 3.25 23.87 + 1.12 21.28 + 1.11
pH 1.2 (no NaCl)* 18.53 + 1.67 20.28 + 1.89 23.23 + 0.96 23.23 + 1.75 26.25 + 1.15 28.24 + 2.32 25.72 + 0.81 24.06 + 2.32
pH 1.2 (+0.2 M NaCl)$ 31.42 + 1.59 33.29 + 2.57 32.8 + 3.12 33.71 + 3.10 30.29 + 2.34 32.9 + 0.86 31.05 + 1.73 29.97 + 1.41
pH 1.2 (+0.4 M NaCl)# 39.13 + 1.27 38.54 + 2.61 41.31 + 0.61 37.39 + 1.81 34.28 + 1.33 34.55 + 0.08 33.39 + 1.82 32.28 + 1.21
21
Table 2. Peak force values and integrated areas of curves obtained from texture analysis for three model drugs (n=3)
Formulation Media
Mean peak
force (N)
Distance
(mm) Time (sec)
Area
(gsec)
K100LV Diltiazem
HCl matrices
water 0.10 + 0.00 0.18 + 0.00 3.93 + 0.01 0.24 + 0.00
pH 1.2 (no NaCl) 1.55 + 0.35 0.19 + 0.00 4.05 + 0.01 2.33 + 0.00
pH1.2 (+0.2 M NaCl) 0.80 + 0.00 0.19 + 0.00 4.04 + 0.00 2.02 + 0.00
pH1.2 (+0.4 M NaCl) 0.10 + 0.00 0.19+ 0.00 4.02 +0.04 0.25 + 0.05
K100M Diltiazem
HCl matrices
water 0.69 + 0.01 0.19+ 0.00 3.99 + 0.07 1.46 + 0.17
pH 1.2 (no NaCl) 0.50 + 0.14 0.19+ 0.00 4.05 + 0.01 1.40 + 0.14
pH1.2 (+0.2 M NaCl) 0.50 + 0.00 0.19+ 0.00 4.05 + 0.01 1.39 + 0.02
pH1.2 (+0.4 M NaCl) 0.35 + 0.07 0.19+ 0.00 4.05 + 0.01 0.56 + 0.02
K100LV
Hydrochlorothiazide
matrices
water 0.20 + 0.00 0.18 + 0.00 3.91 + 0.00 0.42 + 0.00
pH 1.2 (no NaCl) 1.30 + 0.14 0.19+ 0.00 4.04 + 0.01 2.66 + 0.26
pH1.2 (+0.2 M NaCl) 0.85 + 0.07 0.19+ 0.00 4.06 + 0.00 2.09 + 0.16
pH1.2 (+0.4 M NaCl) 0.80 + 0.14 0.19+ 0.00 4.04 + 0.00 1.87 + 0.21
K100M
Hydrochlorothiazide
matrices
water 0.40 + 0.14 0.19+ 0.00 4.03 + 0.03 0.85 + 0.21
pH 1.2 (no NaCl) 0.45 + 0.07 0.19+ 0.00 4.04 + 0.01 1.25 + 0.16
pH1.2 (+0.2 M NaCl) 0.35 + 0.07 0.19+ 0.00 4.04 + 0.00 1.03 + 0.12
22
Table 3. The influence of varying ionic strength of the dissolution medium on mechanism of diltiazem HCl release
Drug-release characteristics
Tablet
Formulation Ionic strengths
Agitation
(dpm)
DE310mins
(%)
MDT
(min)
MDR
(%min-1)
RSQ
(r2) n
K100LV Water (0) 20 92.34 23.74 0.27 0.9869 0.9862
K100LV (no NaCl) 20 91.12 27.52 0.26 0.9372 0.6238
K100LV (+0.2 M NaCl) 20 91.87 25.21 0.27 0.9459 0.8960
K100LV (+0.4 M NaCl) 20 92.75 22.49 0.23 0.9941 0.5598
K4M Water (0) 20 69.27 87.52 0.31 0.9688 0.6599
K4M (no NaCl) 20 67.87 99.60 0.31 0.9922 0.7571
K4M (+0.2 M NaCl) 20 54.93 111.57 0.26 0.9924 0.6685
K4M (+0.4 M NaCl) 20 54.65 94.93 0.23 0.9864 0.5262
K15M Water (0) 20 62.26 27.45 0.17 0.9942 0.6410
K15M (no NaCl) 20 58.62 26.83 0.16 0.9944 0.6719
K15M (+0.2 M NaCl) 20 46.64 27.70 0.13 0.9895 0.6325
K15M (+0.4 M NaCl) 20 42.04 27.70 0.12 0.9852 0.5832
K100M Water (0) 20 58.74 26.72 0.16 0.9897 0.6235
K100M (no NaCl) 20 51.64 27.66 0.14 0.9906 0.6324
K100M (+0.2 M NaCl) 20 42.43 27.44 0.12 0.9896 0.6290
23
Table 4. The influence of varying ionic strength of the dissolution medium on mechanism of hydrochlorothiazide release
Drug-release characteristics
Tablet
Formulation Ionic strengths
Agitation
(dpm)
DE310mins
(%)
MDT
(min)
MDR
(%min-1)
RSQ
(r2) n
K100LV Water (0) 20 58.45 92.77 0.26 0.9828 0.5770
K100LV (no NaCl) 20 60.89 81.05 0.24 0.9788 0.5156
K100LV (+0.2 M NaCl) 20 60.32 78.82 0.22 0.9893 0.4602
K100LV (+0.4 M NaCl) 20 62.57 61.59 0.20 0.9633 0.3863
K4M Water (0) 20 36.33 135.00 0.20 0.9967 0.7668
K4M (no NaCl) 20 37.97 124.64 0.19 0.9975 0.6916
K4M (+0.2 M NaCl) 20 36.09 113.36 0.17 0.9975 0.5972
K4M (+0.4 M NaCl) 20 40.08 107.74 0.19 0.9709 0.5855
K15M Water (0) 20 29.34 134.75 0.16 0.9959 0.7137
K15M (no NaCl) 20 30.60 118.75 0.14 0.9972 0.6191
K15M (+0.2 M NaCl) 20 33.28 109.69 0.15 0.9928 0.5630
K15M (+0.4 M NaCl) 20 35.01 115.50 0.17 0.9694 0.5599
K100M Water (0) 20 19.88 135.86 0.11 0.9946 0.6861
K100M (no NaCl) 20 21.98 127.78 0.11 0.9959 0.6422
K100M (+0.2 M NaCl) 20 23.22 116.60 0.11 0.9966 0.5667
24
Figure 1. The influence of ionic strength on diltiazem HCl release from HPMC matrices over pH 1.2 – 7.5. a. K100LV b. K100M. Standard deviations smaller than the symbol size were not shown on the graphs.
0 20 40 60 80 100
0 60 120 180 240 300 360
C u mmu lati ve p e rc e n tag e re le ase d Time (mins) (a) Water pH media
pH media (+0.2M NaCl) pH media (+0.4M NaCl)
0 20 40 60 80 100
0 60 120 180 240 300 360
C u mmu lati ve p e rc e n tag e re le ase d Time (mins) (b) Water pH media
25
Figure 2. The influence of media ionic strength on hydrochlorothiazide release from HPMC matrices from pH 1.2-7.5 a. K100LV, b. K100M. Standard deviations smaller than the symbol size were not shown on the graphs.
0 20 40 60 80 100
0 60 120 180 240 300 360
C u mmu lati ve p e rc e n tag e re le ase d Time (mins) (a) Water pH media
pH media (+0.2M NaCl) pH media (+0.4M NaCl)
0 20 40 60 80 100
0 60 120 180 240 300 360
C u mmu lati ve p e rc e n tag e re le ase d Time (mins)
(b) Water
pH media
26
Figure 3. DSC thermograms of diltiazem HCl taken after 10 minutes hydration in relevant media of 4:1 drug:HPMC matrices a. K100LV, b. K100M
a. b.
c. d.
Water Water
Water Water
pH 1.2
pH 1.2
pH 1.2 pH 1.2
pH 1.2
(+0.2M NaCl) pH 1.2 (+0.2M NaCl)
pH 1.2
(+0.4M NaCl) pH 1.2
(+0.4M NaCl)
pH 1.2 (+0.4M NaCl)
pH 1.2 (+0.4M NaCl) pH 1.2
(+0.2M NaCl)
[image:26.595.106.493.77.312.2]27
Figure 4. DSC thermographs of hydrochlorothiazide taken after 10 minutes hydration in relevant media of 4:1 drug:HPMC matrices a. K100LV, b. K100M
a. b.
c. d.
Water Water
Water
Water pH 1.2
pH 1.2
pH 1.2
pH 1.2 pH 1.2
(+0.2M NaCl)
pH 1.2
(+0.4M NaCl) pH 1.2
(+0.4M NaCl) pH 1.2 (+0.2M NaCl)
pH 1.2
(+0.2M NaCl) pH 1.2
(+0.2M NaCl)
pH 1.2
[image:27.595.102.491.76.324.2]