The London School of Economics
and Political Science
Essays in Corporate Finance
Luana Zaccaria
Declaration
I certify that the thesis I have presented for examination for the PhD degree of the London School of Economics and Political Science is solely my own work other than where I have clearly indicated that it is the work of others (in which case the extent of any work carried out jointly by me and any other person is clearly identified in it).
The copyright of this thesis rests with the author. Quotation from it is permitted, provided that full acknowledgement is made. This thesis may not be reproduced without my prior written consent. I warrant that this authorisation does not, to the best of my belief, infringe the rights of any third party.
I declare that my thesis consists of 22,455 words
Statement of conjoint work
Abstract
Contents
1 Are Family and Friends the Wrong Investors? Evidence from U.S. Start-Ups 10
1.1 Introduction . . . 10
1.2 Data Description and Summary Statistics . . . 16
1.2.1 Small and Medium Sized Firm Financing: Capital Raising with Unregistered Securities Offerings . . . 17
1.2.2 A Proxy for Informal Finance: Non-Accredited Investors. . . 19
1.2.3 The Founders Team . . . 21
1.2.4 Rare Surnames and Informal Finance . . . 22
1.3 Empirical Strategy . . . 24
1.3.1 Empirical Specifications . . . 24
1.3.2 Rare Last Names, Informal Finance and Access to Private Capital Markets. . . 27
1.4 Results . . . 31
1.5 Direct Effects on Performance or Frictions in Private Capital Markets? 33 1.5.1 Direct Effects: The California Subsample . . . 33
1.5.2 Frictions in Private Capital Markets: the Fight for Control . . . 35
1.5.3 Alternative mechanisms . . . 36
1.6 Conclusions . . . 37
2 Private Capital Markets and Entrepreneurial Debt: Evidence from Unregistered Securities Offerings 58 2.1 Introduction . . . 58
2.2 Entrepreneurial Finance, Regulation D and Private Capital Markets . 62 2.3 Entrepreneurial Debt . . . 66
2.3.1 Early vs Late Stage . . . 67
2.3.2 Determinants of Private Debt . . . 69
3 Discipline in the Securitization Market 88
3.1 Introduction . . . 88
3.2 Model Set Up . . . 92
3.3 Solving the Model . . . 95
3.4 Discussion . . . 111
List of Figures
1.1 Summary Statistics: The Seed Round . . . 41
1.2 Summary Statistics: The Seed Round. Investors and Founders . . . . 43
1.3 Founders: Year of First Employment. . . . 49
1.4 Immigration to U.S. 1820-2007, Source: U.S. Department of Homeland Security. . . . 50
2.1 Number of Offerings and Amounts Sold by Quarter . . . 73
2.2 Median and Mean Dollar Amount Sold per Offering . . . 75
3.1 Probability of loan transaction . . . 98
3.2 Equilibrium 1 . . . 104
3.3 Equilibrium 2 . . . 105
3.4 Equilibrium 3 . . . 106
3.5 Equilibrium and market discipline . . . 108
List of Tables
1.1 Seed Round Summary Statistics: Industry . . . 39
1.2 Seed Round Summary Statistics: State of Location . . . 40
1.3 Seed Round Summary Statistics: Deal and Firm Characteristics . . . 42
1.4 Revenue Size Transition Matrix . . . 44
1.5 Seed Round Summary statistics: IF-firms vs NonIF-firms . . . 45
1.6 Ethnic/Linguistic Categories definition, founders’ team mix and follow-on funding . . . 46
1.7 Small Family and Informal Finance . . . 47
1.8 Small Family and Growth . . . 48
1.9 Founders: Education. . . 49
1.10 Ethnicity of Founders: Rare and Non Rare Surnames . . . 51
1.11 Small Family and Future Financing Events . . . 52
1.12 Bivariate Probit Model: Full Sample . . . 53
1.13 Bivariate Probit Model: Disclosed Revenues . . . 54
1.15 The California Subsample: Descriptive statistics and Business
En-tity Status (as of June 2015) . . . 56
1.16 Survival vs Follow-on Financing Probability . . . 57
1.17 Informal Finance and Control . . . 57
2.1 Deal and Firm Characteristics . . . 74
2.2 Total Offerings by Industry . . . 76
2.3 Industry Breakdown and the General Solicitation Exemption . . . . 77
2.4 Location: U.S. and Non-U.S. Firms . . . 78
2.5 Public Listings and Industry . . . 79
2.6 Public Listings and Location . . . 80
2.7 Early vs Late Stage Deals: Descriptive Statistics. . . 81
2.8 Early vs Late Stage Deals: Industry Breakdown . . . 82
2.9 Securities Issued and Use of Debt . . . 84
2.10 Use of Debt in Private Capital Markets . . . 85
2.11 Use of Debt: Early and Late Stage Deals . . . 86
“If I wanted to shake this tree with my hands I should not be able to do it. But the wind,
which we do not see, tortures and bends it in whatever direction it pleases.
It is by invisible hands that we are bent and tortured worst.”
Chapter 1
Are Family and Friends the Wrong
Investors? Evidence from U.S.
Start-Ups
1.1
IntroductionIn the staged investment process that characterizes entrepreneurial finance, reach-ing the next round of fundreach-ing is often decisive for early-stage firms. Initial rounds, typically conducted with angel investors and informal funders (e.g., family and friends), are the stepping stone to obtaining follow-on capital provided by Ven-ture Capital (VC) firms and subsequently exiting the venVen-ture via an acquisition or an IPO.1 Progression towards later financing rounds is mostly driven by the
others”.2 This paper elaborates on the idea behind this quote, focusing on
infor-mal finance. Are family and friends the wrong investors, in the sense that they deter subsequent funding? If so, what is the nature of their conflict with other in-vestors? The relevance of these questions extends beyond entrepreneurial finance and venture capital literature, since, due to a lack of accounting or market data, there is little empirical evidence on whether and how informal finance affects firms’ outcomes. This is despite entrepreneurs’ social circle provides the most accessible form of funding for young firms around the world (Bygrave and Quill [2006]). I investigate the effects of informal finance on startups’ ability to access additional capital during later funding stages. To do so, I select a sample of early-stage firms at the time of their seed funding round and track their future financing events. Dif-ferently from previous studies on early-stage and seed financing that largely rely on survey data and self reporting investors’ documentation, I use a novel hand-collected dataset based on SEC filings for private placements (Form Ds) of small and young U.S. firms.3 The advantages provided by this data are twofold. First, it
relaxes sampling bias concerns, as filing is mandatory for firms that sell unregis-tered securities to outside investors such as family and friends, angels or invest-ment funds.4 Therefore, this dataset provides a more complete picture of private
capital markets, including seed funding which precedes access to VC investments. This early investment phase has not been fully documented by the existing litera-ture. Second, it provides new information on characteristics and financing choices for a large sample of startups. For example, along with industry, location and amount of capital raised, Form Ds contain data on the age of the company, its management team, the size of its revenues and the type of security offered in the private placement.
Crucially for the purpose of this paper, Form Ds also contain information on in-formal finance, as issuers must disclose whether inin-formal investors are allowed to participate in the offering. Thus, this is one of the first studies that attempt to quantify and characterize recourse to informal finance in entrepreneurial litera-ture. In this sample, only 17% of firms use family and friends funding and when informal funders participate in initial rounds they typically co-invest with formal 2“VCs And Super Angels: The War For The Entrepreneur” posted on TechCrunch on 15 August 2010.
3See for example Lerner et al. [2015], Kerr et al. [2014], Robb and Robinson [2012], Hellmann et al. [2013].
funders.5 More importantly, I find that firms that raised capital with the support of
informal funders have a lower probability of accessing future funding. The differ-ence - at least -9% - persists after controlling for firm, seed round and management team related characteristics. This observation constitutes the basis for my empiri-cal investigation.
The ideal setting for such investigation is one where the researcher randomly as-signs either A) formal or B) a mix of formal and informal seed funding to firms with identical investment opportunities and observes subsequent financing events. In this framework, the lower probability of accessing follow-on capital associated with B) can be interpreted as a direct effect of informal finance on the supply of funds in later stages. The analysis of the interaction between informal finance and access to capital, however, is complicated by the possibility that recourse to informal finance is correlated with unobservable project qualities, which may ultimately cause the observed negative relationship. For example, suppose that financial arrangements among members of a family or social network negatively affect entrepreneurs’ so-cial relationships.6 If these social costs play a relevant role and entrepreneurs are more keen on formal rather than informal financing, then firms that resort to informal finance in seed rounds are the ones that were turned down by formal funders, who rank higher in the pecking order of financing sources.7 It is also
pos-sible that entrepreneurs that choose family and friends funders over professional investors have a distinctive managerial style, perhaps not strictly profit oriented, that affects firm outcomes. These mechanisms establish an indirect link between informal finance and firms’ performance through selection. Therefore, any attempt to empirically assess the effects of informal finance is exposed to the issue of the endogeneity of this explanatory variable.
My identification strategy relies on the idea that availability of informal funding is exogenously affected by the number of entrepreneurs’ extended family members.
5Formal investors in seed rounds can be angels, seed firms, incubators or small VC firms. 6Economic sociology provides support for this argument and suggests that the perception of financial obligations changes with the social distance between the receiver and the provider of capital, to the extent that formal, more impersonal sources of funding may be preferred because of the lower emotional burden attached to them. Dalits, the untouchables in the Indian caste system, often accept to be charged with extremely high rates by lenders outside of their village to avoid financial bonds within the community, as they create additional social obligations and dependency ( Guérin et al. [2013]). In France, low income individuals seeking consumer credit seem to prefer the discretion of financial companies that conduct their transactions over the phone or Internet, rather than negotiating in person with a banker, thus exposing themselves to (real or perceived) moral judgement (Ducourant [2009]). Although arguably distant from the American entrepreneurial environment, these examples illustrate how financial transactions within social networks and outside of them may be subject to different evaluation criteria, even when controlling for financial terms.
I construct an instrument that proxies for the size of founders’ family using the Census Frequently Occurring Surnames (FOS) dataset on U.S. surnames. The in-strument is a dummy variable (SmallFamily) that takes a value of 1 when a firm’s founder team has a small combined family network, that is when the team has a higher than average component of individuals with rare last names. I classify last names as rare if they occur less than 100 times in the FOS. While details on each rare name’s frequency are not provided, the summary statistics reported in the FOS show that the expected number of individuals that bear any one of these rare names is 4.5. Therefore, founders with rare surnames are statistically likely to have a small extended family. To illustrate the logic behind this approach, con-sider the example of a married male. Exactly five occurrences of his last name in the national survey may include records of himself, his spouse, one child and two parents. The count would easily exceed 5 if other relatives (siblings, cousins, uncles, etc.) were included.8
The relevance of this instrument is supported by its negative and significant first stage coefficient: firms withSmallF amily = 1 are 5% less likely to resort to infor-mal finance. Importantly, the SmallFamily instrument has a significant positive effect (+4%) on the probability of future financing events. Its validity, however, relies on the hypothesis that founders with rare last names have no advantage in managing a business or accessing capital markets. Clark and Cummins [2015] suggest that rare last names typically belong to recent immigrants or small local families. It can be argued that foreign-born individuals are particularly prolific innovators (Kerr [2008]) or that small families’ offspring is wealthier and better educated because of lower dispersion of family resources (Goodman et al. [2012], Downey [2001]). By means of a matching algorithm (Ambekar et al. [2009]), I associate founders’ surnames with their ethnicities. I show that the positive rela-tionship between the instrument and the outcome variable mostly originates from the subgroup of individuals with European origins and therefore it is unlikely to be due to recent immigration to the U.S. Furthermore, I collect on-line curricula for a subsample of founders. Startup founders are likely to have a college or higher de-gree and approximately ten years of working experience, but differences between the rare last names group and the rest of the sample are not significant. Thus, in my sample, I find no evidence that individuals belonging to small families possess higher education or business skills.
At the firm level, theSmallFamilyvariable is not correlated with measures of prof-itability and growth opportunities. Revenues as reported at the time of the seed round are marginally lower than for the rest of the firms in the sample and, condi-tional on receiving addicondi-tional funding, the instrument does not predict changes in revenue size between the seed and the follow-on round.
The endogeneity problem is formally addressed by means of a bivariate probit model (as in Greene [1998] and Evans and Schwab [1995]), where I simultane-ously estimate the probabilities of accessing follow-on funding and of resorting to informal finance in the seed round. The instrument is included in the regression for the binary endogenous variable. My results show that recourse to informal finance has a negative and significant effect on the probability of future financing events ranging from -15% to -19%, with the strongest effect associated with later funding provided exclusively by formal investors. The magnitude of these estimates im-plies that marginal effects or coefficients computed from a single equation probit or a linear probability model, which range from -5% to -13%, underestimate the negative impact of informal finance.
The main results in this paper suggest that funding from family and friends affects future financial constraints. Therefore, while informal finance may constitute a cheaper source of capital as it mitigates some frictions in the formal capital market (Stiglitz [1990] and Besley and Coate [1995]), it may also impose costs further down the line.9
There are at least two explanations for these findings. First, informal funders may introduce corporate governance issues that deter professional investors from participating in later rounds. Goldfarb et al. [2012] and Wong [2002] argue that, unlike angels, VC firms use staging and various contractual provisions to moni-tor managers, protect their claims and pursue their investment objectives.10 The
most direct way to exert control is to gain board seats and replace founders in the management team (Wasserman [2012]). Founders with a pronounced desire for control are likely to resist this process, and resistance can be difficult to overcome if family and friends stakeholders side with founders. Such unofficial shareholder agreements can originate from altruistic preferences of informal funders or from 9Informal finance can relax capital constraints by mitigating asymmetric information and moral hazard problems. Social and physical proximity to the entrepreneurs provide informal funders with superior information and lower monitoring costs as compared to other financial intermedi-aries (Stiglitz [1990]). Also, reputational concerns enhance and correct incentives when capital transactions are conducted within a narrow community (Besley and Coate [1995]).
non-pecuniary private benefits of retaining control within the close social circle.11
The expectation of a costly or time consuming negotiation over control with this informal coalition can discourage investments from outsiders.12 The novel dataset
employed in this paper allows to explore this hypothesis. I provide evidence that late stage investors are less likely to gain control over firms that have informal funders. Specifically, founders are more likely to retain executive positions after receiving follow-on capital if they sourced seed funding from family and friends.
A second explanation for the negative effect of informal finance on subsequent ac-cess to capital resides in its potential direct impact on businesses profitability and growth, which ultimately determines the likelihood of receiving additional fund-ing. Using survey data for Chinese firms, Ayyagari et al. [2010] show that informal financing is associated with lower sales growth and reinvestment rates. Informal finance is unlikely to provide entrepreneurs with the same level of guidance and monitoring offered by professional investors. Moreover, having relatives or friends as initial shareholders may affect the management style, for example by inducing too much risk aversion and causing firms to forgo profitable growth opportunities (Lee and Persson [2013]), or by introducing poor governance practices. If this con-jecture is true, lower probabilities of raising additional funds simply reflect inferior business performance. Evidence based on survival data for a subsample of firms located in California does not support this argumentation. Like in the full sample, informal finance is negatively correlated with subsequent formal capital raising, but it does not predict lower survival probabilities.
To summarize, family and friends seem to be the wrong investors, as they deter formal venture capital, which improves firms’ chances of survival. Then why do entrepreneurs resort to them? Informal finance may be cheaper than formal. How-ever, my data show that it is usually not sufficient to cover initial investment needs in full. Formal capital providers (e.g angels) who co-invest with family and friends may anticipate the lower probability of follow-on rounds and raise the bar for ac-cess to seed rounds, thus undoing the cheapness of informal finance. If informal capital does not materially reduce the cost of funding, the benefits of involving fam-ily and friends must have a non pecuniary nature. The data on founder-manager turnover indicate that recourse to informal finance may depend on entrepreneurs’ 11In the related family firms literature, Demsetz and Lehn [1985] refer to these benefits as the “amenity potential” of control. Informally funded firms are similar to family firms insofar as in-formal stakeholders are motivated by goals that are not purely related to financial performances. However, these firms do not necessarily share other distinctive features of family firms such as di-rect involvement of the family in the management or preference for within firm inter-generational transfers (Bennedsen et al. [2010])
taste for control and on VC investment practices. Having trustworthy stakeholders increases the probability of retaining control in founders’ hands, counterbalancing the negative effects on access to formal capital.
Thanks to the novelty and the scope of the SEC Form D dataset, this paper con-tributes to the entrepreneurial finance literature by significantly expanding empir-ical evidence on firm and founders’ characteristics and financing choices of private ventures in their early-stage investment phase. Importantly, my focus on informal finance adds to the current understanding of the role of this source of finance in startups’ capital structure (Robb and Robinson [2012]) and firms’ outcomes. The results on the negative effects of family and friends funding on access to formal capital are also new to the existing body of theoretical literature on informal fi-nance (Stiglitz [1990], Besley and Coate [1995], Lee and Persson [2013]). Finally, by providing suggestive evidence on corporate governance and performance related mechanisms, I connect informal finance literature with previous empirical and the-oretical work on entrepreneurship (Hurst and Pugsley [2010], Hamilton [2000]), family firms (Demsetz and Lehn [1985], Burkart et al. [2003], Bennedsen et al. [2007], Miller et al. [2007]) and stage financing (Hellmann and Thiele [2015]).
The remainder of the paper is organized as follows. Sections I describes the data. Section II illustrates the empirical methodology and Section III presents the re-sults. Possible mechanisms are explored in Section IV. Section V concludes.
1.2
Data Description and Summary Statistics1.2.1
Small and Medium Sized Firm Financing: Capital Raising withUnregistered Securities Offerings
Currently available data on financing choices of early-stage firms rely primarily on surveys that cover a small portion of total capital raising. In order to attenu-ate this problem, I construct a dataset based on online filings for privattenu-ate offerings conducted in exemption to US securities laws.13 Securities laws (“Securities Act”
1933, “Exchange Act” 1934) apply to all companies that issue securities. The main purpose of these laws is to protect investors as they enforce transparency and dis-closure of companies’ business and risk profile. The most common exemption for small businesses is the private placement exemption under SEC Regulation D,14
which requires non-reporting firms to notify the SEC of the sale of securities via Form D. Angel investors and VC firms, for example, make their investments by purchasing in these private offerings of unregistered securities.15 Regulation D requires that Form D must be filed within 15 days of securities first sale date, regardless of whether the total amount offered has been sold in full or not. No submission fees are charged and, beginning in March 2009, the SEC has made it obligatory to file Form D online. Despite the light work load that filing involves, it is reasonable to expect that this requirement may not be fulfilled by the totality of the firms subject to it but only by a selection of them. This can happen if en-trepreneurs are unaware of the regulation or have no access to legal counseling. In this case, my sample may be tilted towards more sophisticated and experienced entrepreneurs. This circumstance, however, is unlikely to spuriously drive results on the negative effects of informal finance on access to venture capital. To the con-trary, it may relax concerns over adverse selection of informally funded firms, as the sample excludes subsistence enterprises.
Any Form D filed is publicly available on the SEC website and contains the follow-ing information: issuer characteristics (year and state of incorporation, address, industry group, revenue range), type of securities issued (equity, debt, hybrid se-curities), offering and sales amount and the total number of investors who partici-pated to the offering.
I collect all Form Ds that were filed with the SEC between March 2009 and October 2014. For the purpose of investigating the effects of informal finance, I identify a
13See http://www.sec.gov/info/smallbus/qasbsec.htm
14Private offering can also be conducted under Section(a)(2) of the Securities Act. Ivanov and Bauguess [2013] show that the amount of capital raised through Section(a)(2) during the years 2009 to 2012 is less than 20% of the amount raised through Regulation D.
sample of issuers that display early stage business features and follow their capital raising activity over time. Each firm is uniquely identified by the Central Key Code, a numeric code assigned by the SEC.
Specifically, this restricted sample includes 6,717 non-financial firms, selected ac-cording to the following criteria:
1. All firms filed a Form D for the first time in years 2011-201216
2. Firms are less than 2 years old at the time of the first offering
3. First offerings are smaller than $6M17
4. Disclosed revenues at the time of the first offering are smaller than $5 million
5. Firms operate in the U.S. and are incorporated (if already so) in Canada or the U.S.
Filters 1. and 2. are used in order to identify young firms that access entrepreneurial finance for the first time. Filters 3. and 4. are added in order to exclude firms that, despite being young and new to private capital markets, are large in size and in a mature stage, as it would be the case for spin-offs of established companies. Filter 5. rids the analysis of potential additional complexity due to frictions in interna-tional capital markets.
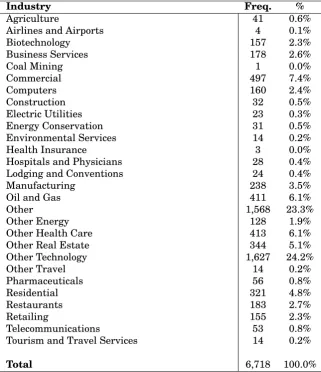
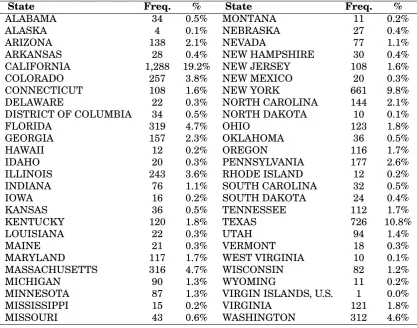
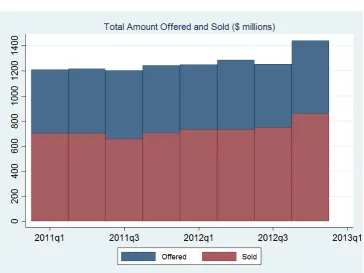
Table 1.1 shows the industry breakdown: Technology (other than Biotechnology and Telecommunications) dominates the sample with 24.2% of the observations. Other relevant sectors are Commercial (7.4%), Health Care (other than Hospitals and Health Insurance, 6.1%) and Oil and Gas (6.1%). Most firms are located in Cal-ifornia (19.2%), Texas (10.8%), New York (9.8%), Florida (4.7%) and Massachusetts (4.7%) (Table 1.2). The total amount offered by firms in the sample at the time of their first access to private capital markets ranges between $1.2 billion and $1.4 billion per quarter, while the average size of the offering is $1.5 million (see Figures 16Choosing observations from the middle years of the larger sample makes sure that it is possible to track all previous offerings and restrict the sample only to first rounds for firms less than 2 years old and allows a little over 6 quarters after the first issuance to track future financing events.
1.2a and 1.2b).18 These descriptive statistics are consistent with survey-based data
on seed financing as they match evidence and trends on angel investing highlighted by Halo Reports (provided by ARI, SVB and CB Insights) for the corresponding years.19
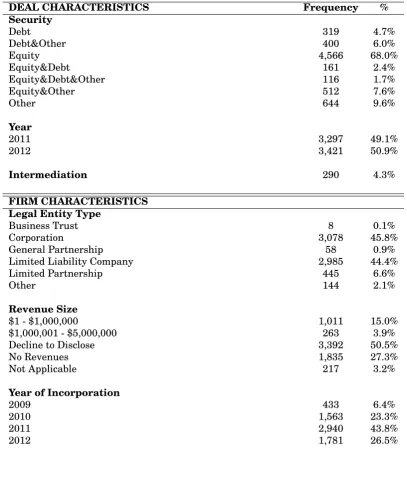
The granularity of the information contained in these filings allows for the analysis of private capital markets along novel dimensions. In terms of firm characteristics, common legal entity types are Corporations (45.8%) and LLCs (44.4%), most firms are incorporated in Delaware (49.4%), while only 0.67% of the firms were not yet incorporated at the time of the deal. Half of the firms in the sample decline to disclose revenues, 27% of them had no revenues and the rest disclose revenues smaller than $5 million. Table 3 reports characteristics of the seed round. The se-curity type used is equity (alone or in combination with other securities) for 79.7% of the observations and debt (alone or in combination with other securities) for 14.8% of the observations. The issues are rarely conducted with the support of a registered financial intermediary (less than 5%). The average number of investors per deal is 11.42 and the median is 6 (Figure 1.2a).
In order to assess firms’ ability to access private capital markets, I analyze follow-on rounds filed within six quarters of the initial round.20 Only 19% of firms in the
sample raise capital in a second offering.21 The average amount offered is
substan-tially higher than in first rounds ( $3.2 million on average) and debt (alone or in combination with other securities) is more widely used (26%). Firm characteristics are essentially unchanged: 99% of the issuers are still incorporated in the same state, only 7% report to operate in a different sector and 14% report a change in revenue size (see the revenue size transition matrix in Table 1.4).
1.2.2
A Proxy for Informal Finance: Non-Accredited InvestorsSEC disclosure requirements for private placements allow researchers to construct an empirical proxy for informal finance. Firms filing Form D must disclose whether 18Since filing of Form D is required within 15 days since the day of the first sale, amounts offered and amounts sold by the filing date can differ. On average, firms report to have sold 58% of the amount offered.
19http://www.angelresourceinstitute.org/research/halo-report/halo-report.aspx
20Conditional on observing a second offering after the first one, the average time between the first and the second issuance in the sample is 3.86 quarters, but decreases over time due to observability. 6 quarters represents the 75th percentile in the distribution of time elapsed between the first and the second offering for all of the 8 subsamples of firms by quarter of first issuance.
non-accredited investors can purchase the security offered: I use this information as the indicator for recourse to informal finance.
Regulation D (in its most commonly used rule, 506(b)) imposes restrictions to secu-rities sales based on financial sophistication and need for protection of investors.22
Specifically, buyers in a private offering are assumed to be sophisticated if they comply with the definition of accredited investor. In the context of this study, the relevant accredited investor definition includes: registered financial interme-diaries, charity organizations, directors or executives of the firm, individuals with net worth greater than $1 million or income exceeding $200 thousands per year.23
Under Rule 506(b) there are no restrictions on participation and disclosures if se-curities are sold to accredited investors, while non-accredited investors cannot be more than 35 in each single offering and must be provided with specific disclosure documents, such as certified financial statements.24 Since general solicitation, i.e.
any form of advertisement of a private securities sale, is forbidden, investors must be approached directly by the issuer.25 While financial intermediation companies
are well known to the general public through websites or advertisement, angel investors usually organize themselves in groups operating via a website, in or-der to increase their visibility to entrepreneurs. The Angel Capital Association, the largest angel organization in the world, and the vast majority of angel groups in U.S.A., only accept accredited investors as members. Thus, non-accredited in-22Private offerings in exemption of securities laws can be conducted also under Rule 504, Rule 505 and, since September 2013, Rule 506(c). Rules 504 and 505 are applicable to smaller issuances ($1 million or $5 million) and, under certain circumstances, they relax constraints on non-accredited investors participation . However, only Rule 506(b) exempts from Blue Sky law registration. This seems to be the reason why Rule 506(b) has been used in 94% of the offerings between 2009 and 2012. See Ivanov and Bauguess [2013].
23The standards for accredited investor qualification were first set 1982 when Regulation D was issued. The first revision of these criteria was introduced in 2011 with the Dodd-Frank Act and enacted in December 2012. It excluded the house of first residence from the calculation of natu-ral persons net worth. According to the Dodd-Frank Act, the SEC is now required to revise the accredited investor definition every four years.
24The constraint on the number of non-accredited investors does not appear to be binding for firms in this sample, as 96% of first round filings for completed offerings report less than 35 investors in total.
For offerings up to $2,000,000 financial statements requirements are the following : balance sheets as of the end of each of the two most recent fiscal years (only the balance sheet, dated within 120 days of the start date of the offering, must be audited);statements of income, cash flow and changes in stockholders’ equity for each of the two years preceding the date of the most recent audited balance sheet (or such shorter period as the issuer has been in business); and interim financial statements as of the end of the issuer’s most recent fiscal quarter. For offerings up to $7,500,000 the same requirements apply. However, the financial statements must be audited unless the issuer cannot obtain audited financial statements without unreasonable effort or expense. For offerings over $7,5000,000 the issuer must provide the financial statements required to be filed in a registration statement that the issuer would be entitled to use.
vestors participating in these offerings are likely to be individuals within the en-trepreneur’s social network (such as family, friends or employees). This identi-fication criterion is strict: depending on their wealth, family and friends of the entrepreneur may qualify as accredited investors and participate in the offering as such. As a consequence, the informal finance proxy may underestimate the extent to which firms rely on this type of investors for funding.
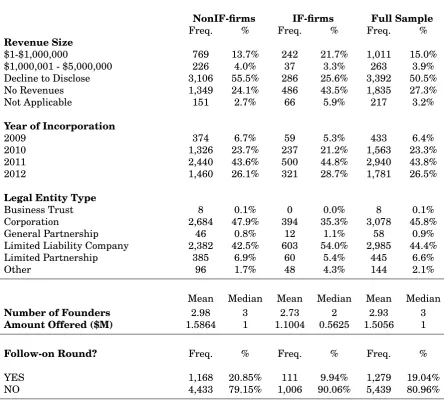
Table 1.5 provides descriptive statistics for the 1,117 firms (16.63% of the whole sample) that have informal funders among their initial investors (I will refer to this group as IF-firms) and compare them with the rest of the sample (NonIF-firms). Consistent with economic intuition, IF-firms are smaller (in terms of number of founders and amount offered in the first round) and at an earlier stage of business operations (as per revenue size, years since incorporation and entity type). More-over, location and sector distributions are more dispersed than for NonIF-firms, with smaller weights on California and Tech companies.
97% of the completed IF-firms’ first offerings have accredited investors participat-ing alongside non accredited investors. Informal finance is rarely the only source of funding and it is usually combined with professional investments.
Crucially in the context of this paper, the likelihood of raising capital in a second offering drops dramatically for the IF-firms subsample: approximately 10% of the firms access capital markets for a second time, and less than 5% do so via offerings conducted exclusively with formal investors (see Table 1.5 ).
1.2.3
The Founders Team“Have you ever noticed how few successful startups were founded by just one per-son?” asks Paul Graham in his blog.26 Undoubtedly, the size of the management
team matters for professional investors when deciding whether to finance a project. Ability to work in teams and complementarities in product development and man-agement skills are often quoted as the motive for easier access to VC capital of firms with two or more founders.
Form D contains the full name and address of “related persons”, namely issuer’s executive officers, directors or promoters.27 I refer to the group of related persons 26Paul Graham is a known tech entrepreneur, venture capitalist and co-founder of Y Combinator, a seed capital firm.
in each deal as the management team. In the absence of any legal or conventional definition, I assign the founderstatus to individuals with managerial positions in the firm at the time of its first round of capital raising, provided that it takes place within two years since incorporation. Therefore, I refer to the group of managers in the seed round as the founders.
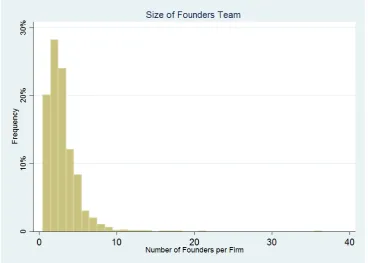
This sample contains the names of 19,498 founders: 44.13% of the individuals in this group are directors, 46.31% are executive officers and 9.56% are promoters, with 4% of them being other business entities. The size distribution of the founders management team is illustrated in Figure 1.2b. Mean and median size of founders teams is 3 and 99% of the firms have less than 9 founders. Consistently with Graham’s quote, single-founder firms (20% of the sample) are less likely to raise capital after the first deal: 13% of these issuers access the market a second time, versus 20% of firms with 2 or more founders.
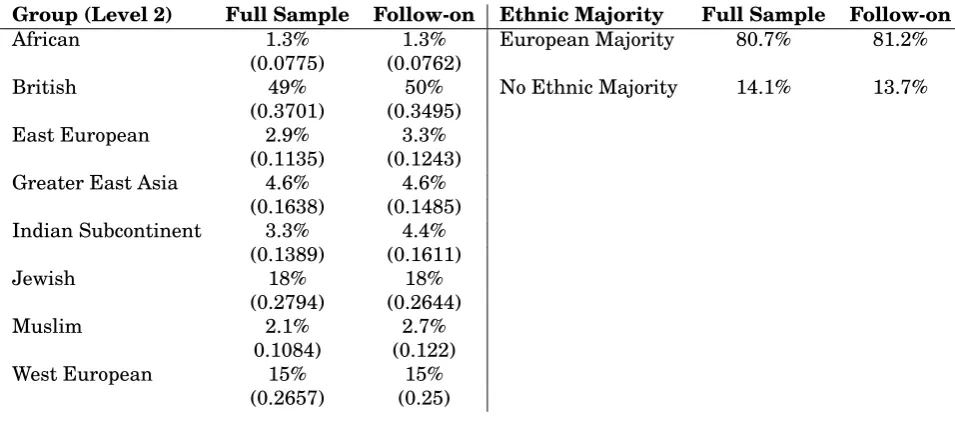
In order to gain further insight on founders’ demographics and lacking any infor-mation on their biographies, I match founders’ last names with linguistic group/ethnicity according to the algorithm in Ambekar et al. [2009]. This automated ethnicity clas-sifier uses hidden Markov models and decision trees to assign names to one of 13 ethnic/linguistic categories (Table 1.6, Panel A shows the hierarchical structure of the categories). Panel B in Table 1.6 illustrates the ethnic mix of the founders teams. The average founders team is mostly composed of individuals with a Eu-ropean descent (84%). Interestingly, the average composition of teams that access capital markets for a second time is broadly similar to the full sample’s. Similarly, teams with a majority of European descendants do not seem to be more likely to raise more funding after the first round when compared to the full sample or the subsample of firms with a balanced ethnic mix (i.e. firms where no ethnicity repre-sents more than 50% of the team).
1.2.4
Rare Surnames and Informal FinanceSince financing decisions are made by firms’ managers, investigating personal characteristics of founders can help identify sources of variation in the use of in-formal finance. For example, the size of founders’ extended family network might affect the supply of informal funds. I construct a proxy for small combined family
network of the founder team, based on information on founders’ surnames con-tained in the Frequently Occurring Surnames dataset (FOS) provided by the Cen-sus Bureau.
The FOS ranks all American last names (6.2 million) in order of occurrences, i.e. in terms of number of U.S. residents with each surname. This dataset shows, along with names and occurrences, statistics on ethnicity and race of individuals asso-ciated with each name. For example, the last name Smith ranks first with over 2.3 million occurrences and is mostly borne by Hispanic white (73%) and non-Hispanic black (22%) individuals. For privacy reasons related to the disclosure of such sensitive demographic data, the list is truncated to exclude names that occur less than 100 times. However, summary statistics for these rare names are pro-vided by Word et al. [2008]. There are 6,096,744 rare names that correspond to over 27 million people ( 10% of the surveyed population). Thus, each rare name corresponds on average to 4.5 individuals. Furthermore, over 90% of these rare names occur less than 10 times.28
As a consequence of this truncation, some founders’ names in my sample (13.87%) cannot be matched with the FOS list and are classified as rare. On the basis of the judgment that 4.5 expected occurrences of a last name reveal an exiguous number of familiar links, I identify founders with small family networks as the ones bearing a rare surname.
I define the SmallF amily dummy variable Si = 1 if the proportion of founders in
firmiwith rare last names is greater than the sample average. Consistently with the intuition above, firms withSi = 1(1,954 observations) are less likely to resort to
informal finance as compared to the full sample (12.69% versus 16.67%).29
Impor-tantly, these firms also seem to be associated with a higher probability of raising capital more than once (21.85% versus 19.04%).30 The issue of robustness of the
correlation betweenSi and informal finance and the question of whether channels
other than family size can affect the relationship between Si and subsequent
fi-nancing events are addressed in the next section.
28Similar distributional properties of Spanish and English last names have been exploited by Güell et al. and Clark and Cummins [2015] to establish family links among individuals and track inter-generational mobility.
1.3
Empirical Strategy1.3.1
Empirical SpecificationsA simple way to estimate the impact of informal finance on future financing events is via a single equation probit model. Let the indicator variable Yi = 1 if firm
i raises capital in private markets within 6 quarters since its first offering. The probability ofYi = 1 can be described by
Pr [Yi = 1] = Pr [Xiβ+IFiδ+i >0] = Φ [Xiβ+IFiδ] (1.1)
whereΦ [·]is the standard normal cdf, Xi is a vector of firm, seed round, founders
and time variables and IFi is a dummy variable that takes value 1 when
non-accredited investors are allowed to participate in the first offering andi is a
stan-dard normally distributed random error.
In this single-equation probit model the informal finance coefficient is treated as exogenous. There are, however, reasons why this may not be the case. Entrepreneurs who involve individuals from their social network as investors in their venture may be the ones that enjoy non-pecuniary benefits from running a business that is strongly connected with their communities and, as a consequence, they are not purely profit-oriented. This attitude may discourage outside investors. Alterna-tively, if entrepreneurs prefer formal to informal finance and the supply of capital is limited, the best projects will receive full financing by professional investors while other projects will either not receive funding or will be funded by informal investors.31 The best projects are also more likely to successfully raise capital in a
second round. Thus, the informal finance effect is due to an unobservable omitted “project quality” variable rather than a causal link with future access to capital. Notice however that the richness of the SEC data allows for extensive controls on size, revenues and age and, more importantly, almost all of the seed round offerings with informal funders are also subscribed by other investors. Informal finance thus does not seem to be correlated with rejection by early stage professional investors like angels.
In order to allow for the possibility of endogeneity, I estimate model (1.1) jointly with a probit model for the informal finance variable (see Greene [1998] and Evans and Schwab [1995] for applications in education economics).
Suppose that the probability ofIFi = 1is described by
Pr [IFi = 1] = Pr [Ziθ+µi >0] = Φ [Ziθ] (1.2)
whereZi is a vector of observable andµi is a random error.
In this setting, both the outcome variable and the potentially endogenous regres-sor are dichotomous and as a consequence both the first stage and the structural model are non linear. Following Heckman [1978], I employ a bivariate probit model approach.32
This model is identified if at least one variable (the instrument) in Zi is not
con-tained inXi.33 Equation (1.2) can be rewritten as
Pr [IFi = 1] = Pr [Xiλ+Siπ+µi >0] = Φ [Xiλ+Siπ] (1.3)
where the instrument Si is the proxy for small combined family as defined in the
previous section.34
Finally, since large social networks may support founders through multiple stages of financing, the indicator dependent variable can be redefined asYi = 1 if firm i
raises capital in private markets withaccredited investors only within 6 quarters since its first offering. With this specification I evaluate the impact of informal finance on funding from formal investors.
In all of the above specifications, the full vector of covariatesXi includes:
32To account for the possibility thatIF
iandYiare determined by correlated unobservable
vari-ables ( say “project quality”) I assume thatiin (1.1) andµiin (1.2) are distributed bivariate normal
withE[i] =E[µi] = 0,var[i] =var[µi] = 1andcorr[i, µi] =ρ. In this model there are 4 possible
states of the world (IFi = 0orIFi= 1andYi= 0orYi = 1) and corresponding likelihood function
is a bivariate probit.
33Han and Vytlacil [2013] extend this identification result to a wider class of models that includes bivariate probit models as a special case
34 An alternative strategy consists in a 2SLS estimation where non linear fitted values for IF
i
• Firm characteristics: industry, revenue size, legal entity type, state of loca-tion, state of incorporaloca-tion, year of incorporation
• Founders Team characteristics: size, ethnicity mix (based on Level 2 as per Table 1.6), a Corp dummy that takes value 1 if one or more of the related persons are other business entities, afamilydummy that takes value 1 is two or more founders have the same last name
• Seed Round characteristics: amount offered, number of investors, quarter of issuance, type of security issued, an Intermediationdummy that takes value 1 if the offering was conducted with the support of a registered financial in-termediary, a Hot Deal dummy that takes value 1 if more than 80% of the amount offered was sold at the time of the filing (approximately half of the sample).
• An interaction term between year of incorporation and quarter of first is-suance, to capture the effect of firms’ age in different capital markets condi-tions
The coefficient of interest isδin equation (1.1), which captures the effect of informal finance on future financing.35 Any claim of causality relies on the relevance and
validity of the instrument, which are discussed next.
35 In order to measure the qualitative importance of the covariates I report Average Marginal Effects. For the j-th covariate, these are given by
AM Ej=γi
1
n n X
i=1
ϕ(Aiγ)
for continuous covariates and
AM Ej=
1 n n X i=1 n
ΦAiγ|γ j i = 1
−ΦAiγ|γ j i = 0
o
for dummy variables , wherenis the sample size,Ai is the full vector of covariates andϕ(·)is
1.3.2
Rare Last Names, Informal Finance and Access to Private CapitalMarkets
For the bivariate probit model to be identified we needa) the instrument to belong to the set of explanatory variables in (1.2) and b) the instrument to be excluded from the structural model in (1.1). In order to verify the relevance of instrumentSi
I estimate the first stage single equation probit in (1.3).
Estimated coefficients and average marginal probabilities are reported in Table 1.7 together with coefficient estimates for a linear probability model . Results show thatSi has a significant negative effect (-5%) on the probability of firms resorting
to informal finance. The interpretation of this coefficient is relatively straightfor-ward: if the founders team has a small combined family network it is less likely for the firm to have informal investors. The magnitude is considerable when com-pared with the unconditional probability of resorting to informal finance for firms in my sample (17%). Incidentally, coefficients estimates of equation (1.3) offer an interesting insight on startups financing choices. Informal finance is less likely for larger offerings, but the size of the management team does not seem to play a significant role. The estimated coefficient for theHot Dealdummy is negative and significant: first rounds that are open to professional investors only are subscribed faster.
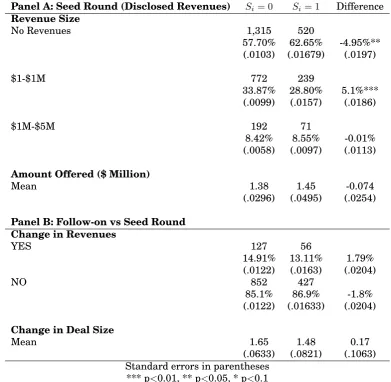
As the relevance of the instrument is confirmed, the credibility of the identification strategy relies on the hypothesis that the proxy for founders family network size does not affect the ability of the firm to raise capital in private markets a second time (other than via less frequent recourse to informal finance). At the firm level, small combined family networks do not seem to be associated with higher growth potential. Table 1.8 shows that the instrument is not correlated with higher rev-enue size or capital raised in the seed round, nor it is predicts changes in revrev-enue size for firms that access follow-on financing. Hence, in this sample, availability of family and friends’ financial support does not make it easier for entrepreneurs to kick-start their business. Furthermore, the instrument does not explain faster expansion processes where financing needs (measured by proportional change in capital raised between seed and follow-on round) grow more rapidly. This evidence is consistent with the idea that founders’ preferences for non-pecuniary benefits of entrepreneurship are orthogonal to family size, while correlated with family and friends’ investments.
question, I examine further the demographics of the rare last names group and compare it with the rest of the sample. As suggested by Clark and Cummins [2015], individuals’ surnames classify as rare in three instances
1. Small local families
2. Early generations immigrants
3. Spelling mistakes/name mutations.
Each of the above classification groups poses specific challenges to the identifica-tion strategy.
Firstly, an instrument that oversamples individuals belonging to small American families can fail the validity test if these families have larger wealth or more pow-erful social networks, as this might imply better access to funding. Such conjec-ture is consistent with the idea that lower fertility can improve the socioeconomic conditions of descendants because of lower dispersion of family resources (Good-man et al. [2012], Downey [2001]). Concerns over the validity of the instrument motivated by the argument above are mitigated by the fact that the population of start-up founders in this sample is likely to be more homogeneous in terms of social background and education than the broad U.S. population.36
would not be part of the rare surname subsample (Garcia is the 8st most common surname in U.S.), even if she just moved from Mexico to California.
Finally, while unable to verify the incidence of name mutations (i.e. surname spelling mistakes at the time of registration in public records), spelling mistakes are unlikely to be frequent in the dataset as the filings are filled in by the founders themselves (or their representative) and machine readable. Of course, if name mu-tations and spelling mistakes were the major reason why surnames are classified as rare the conjectured link with the family size would no longer be grounded. In that case, however, it would be difficult to make sense of the first stage results presented in Table 1.7.
To investigate whether individuals with small families in my sample are more likely to have higher social stata or business skills, I extract information on founders education and past working experience from LinkedIn, an internet-based profes-sional network. Each individualj, founder of firmiis uniquely identified if first and last name correspond to a member of the network and if this member’s curriculum includes a working experience in firmi. Although the working experience criterion reasonably ensures that individuals in the sample are correctly paired with net-work members, it reduces the probability of matching, as legal entity names often do not coincide with company names used on CVs or for commercial purposes. As a result, only 24% (4,422 individuals) of the founders were uniquely matched with a member’s profile. The matched subsample however appears to be representative of the population, as the differences in the distributions of matched and unmatched individuals by location, sector, revenues size, team size, role and ethnicity are not statistically different from zero.37 Insofar as education is strongly correlated with
socioeconomic background and business skills, the results support the validity of the instrument. Education attainments and the length of past working experience are remarkably similar between the two groups (see Table 1.9 and Figure 1.3). The representative founder has college or higher level education and approximately 10 years of previous working experience, with no significant difference between indi-viduals with rare and non rare last names.38
37The test statistics and p-values for Chi-squared tests of homogeneity in the distributions of matched and unmatched individuals by State, Sector, Revenue Size, Team Size, Role and Ethnicity are as follows: χ2
(df)= 46.33(51), Prob=0.659;χ2(df)= 9.25(6), Prob=0.16;χ2(df) = 1.76(3), Prob=0.624;
χ2
(df)= 20.44(18), Prob=0.093;χ2(df)= 1.06(2), Prob=0.588;χ2(df)= 16.62(12), Prob=0.165;
Finally, Panel A in Table 1.10 shows the ethnic classification of the rare last names group versus the full population sample. The comparison of the two distributions is largely in line with the idea of foreign born individuals being over-represented, but presents some peculiar features, especially when examined in juxtaposition with U.S. immigration dynamics over the last century (Figure 1.4). East Asian and Hispanic ethnicities are under-represented in the rare last names group, despite China and Mexico being the largest contributors to recent immigration in terms of country of origin. Indian origin is over-represented, consistently with strong Indian immigration flows in the 2000s, but so is the Italian, even though strong immigra-tion flows from this country substantially stopped in the 1980s. This mixed picture reveals that rare last names do not predominantly belong to early generation im-migrants. Different surnames distributions of different linguistic groups are due to historical, cultural, geographical and biological evolution (Manrubia and Zanette [2002]) and affect the probability of surnames from these groups to fall into the rare category. Italian last names distribution, for example, is one of the most dis-persed while the Chinese and Korean ones are very concentrated.39 As immigrants
over time bring the name distribution feature of their linguistic group into the host country, names belonging to groups with more (less) dispersed distributions can qualify as rare (non-rare) even for second-or-later (first) generations. There-fore, the ethnicity classification is insightful but not fully informative of whether rare last names mostly belong to foreign born individuals.
An additional characterization of the rare last names group in terms of early immi-grants versus small American families can be provided by looking at first names. I split the sample inAmericanversusEarly Generationindividuals by matching first names with the list of the 2,438 most common given names as reported in the 1990 Census. The logic behind this classification is that names that were popular at the beginning of the 1990s must belong to the dominant cultural/ethnic heritage of current second-or-later generation Americans. Therefore, names within the list are labeled as American and unmatched names are labeled as Early Generation. In the rare subsample, American individuals have mostly European origins (88%) while Early Generation ones have more diverse ethnic background (Table 1.10, Panel B). Importantly, the American component in the non-rare subsample is significantly higher than in the rare group (89% versus 75%).
The ethnicity mix of founders is included in the set of explanatory variables Xi,
generations Americans to conduct robustness checks.
1.4
ResultsFirms with small combined founders’ family are 4% more likely to access follow-on capital. Coefficient estimates and average marginal effects for a probit model of the follow-on funding outcome on the exogenous variables and the SmallFam-ily instrument Si are presented in Table 1.11, together with estimates for a
lin-ear probability model. The full set of covariates is employed as control. In Panel B the outcome variable is redefined as Yi = 1 if firm i raises capital in private
markets withformal investors only within 6 quarters since its first offering. The coefficient on the instrumentSi is significant at conventional levels in both
specifi-cations. Other results in Table 1.11 are consistent with the intuition and anecdotal evidence on entrepreneurial finance. Firms with larger founders teams are more likely to secure subsequent financing while larger initial offerings are less likely to be followed by second offerings in the immediate future.
The main results on the effect of informal finance on subsequent access to ven-ture capital stem from the joint estimate of (1.1) and (1.3) with a bivariate probit model and are illustrated in Table 1.12. Columns 1, 2 , 5 and 6 show coefficient estimates and average marginal effects using the two proposed definitions for the outcome variableYi. Results of 2SLS estimations are presented for comparison in
columns 3 and 7. Despite the potential endogeneity issue related to the informal finance choice, I include estimates of average marginal effects for the single equa-tion probit model in (1.1) in columns 4 and 8. Informal finance has a negative and significant effect on the probability of future financing events ranging from -15% to -19%, with the strongest effect associated with follow-on funding from formal investors only.40 Notice that the Hot Deal variable does not affect probability of
the entrepreneurial idea. It is possible that some early stage formal investors an-ticipate a lower probability of securing further finance in the future for informally funded firms and this drives the negative relationship between the Hot Deal vari-able and informal finance in the seed round. This interpretation is supported by the fact that informal finance coefficients and marginal effects as computed with the single equation probit model are smaller in absolute value as compared to the ones computed using the instrument. In other words, it appears that the bar for accessing formal seed financing is set higher for firms open to informal funding, effectively producing a positive, rather than adverse, selection bias.
Revenue size is arguably a relevant variable for this analysis and unfortunately approximately 50% of the firms in the sample decline to disclose this information. In order to check whether the results above are driven by bad controls for revenues size I estimate the same models for the restricted sample of firms that disclose revenues: the average effect of informal finance is still negative (-14%) and signifi-cant when follow-on rounds are conducted exclusively with formal investors (Table 1.13).
The main results presented above are computed using models that include all vari-ables in the control set Xi defined in Section 3.1. Table 1.14 shows that average
marginal effects in a bivariate probit model that only includes firm size controls (column 2) or firm size, industry and location controls (column 3) are not signif-icantly different from estimates for the full model.41 Thus, a more parsimonious
specification with only size, industry and location controls is viable with no sig-nificant loss in the explanatory power of informal finance. Further robustness checks are presented in Table 1.14. In columns 4 and 5 I make use of the eth-nicity classification for founders in different ways. Instead of using the proportion of people belonging to each ethnic/linguistic group for each firm, I include either a dummy variable that takes value 1 if the majority of the founders have European descent or a dummy variable that takes value 1 if no ethnic group represents more than 50% of the founders team. The purpose of these different specifications is to account for homogeneity versus multiethnicity of the founders team composition rather than focusing on the specific ethnicity breakdown. This different approach does not yield different estimates for the effects of informal finance. In column 6 I restrict the sample to firms where the majority of the founders have European origins. In doing so, I verify that the effects of informal finance are not related to recent immigration of founders. Finally I restrict the sample to Hot Deals, namely firms that sold at least 80% of the offering amount at the time of the filing for their seed round. Column 7 shows that the magnitude and significance of marginal
fects on funding from all investors types drop for this subsample but stay constant when follow-on funding from formal investors only is used as dependent variable.42
1.5
Direct Effects on Performance or Frictions in Private CapitalMar-kets?
Having documented the effect of informal finance on the ability of firms to secure financing, I now turn to explore some possible explanations.
Family and friends stakeholders can directly affect firms performance by influenc-ing the management style. For example, they can induce higher risk aversion, which can curb growth and expansion or even generate losses. Informal finance could also lead to bad management practices, such as hiring under-qualified fam-ily members or friends in return for financial support. IF-firms will then be less suitable for follow-on rounds within a short period of time. If that is the case, a lower ability of raising new capital further down the line stems from lack of suc-cess of the entrepreneurial project. In order to verify this conjecture, alternative measures of firm performance are needed. Given the modest size of the firms in my sample, usual accounting or market performance indicators are not available. As a second best approach, I examine survival probabilities for the subsample of California firms.
1.5.1
Direct Effects: The California SubsampleI collect data on corporate status as reported on the Business Entities section of the Secretary of State (SoS) webpage (as of June 2015) for California-based firms. Cali-fornia SoS provides information on the status of companies registered in CaliCali-fornia and companies that perform repeated and successive transactions in the state, re-gardless of the jurisdiction of incorporation. The search criterion is the legal entity name. Records of corporate status were found for 1046 out of 1288 California firms in the sample.
another business entity), converted out (the business entity converted to another type of business entity or to the same type under a different jurisdiction as provided by statute), term expired (if the business entity’s term of existence has expired, as provided by the entity’s Articles of Incorporation), inactive.43
Descriptive statistics are provided in Table 1.15. Not surprisingly, the technolog-ical sector dominates this subsample. IF-firms are more likely to operate in the service industry and are smaller in terms of revenues size. The interesting fact emerging from Table 1.15 is that the distributions of corporate status are identi-cal (differences are not statistiidenti-cally significant) for IF and NonIF firms. In other words, informal finance does not seem to affect survival probabilities. Moreover, among firms that did not raise further capital after the first offering, IF-firms are marginally more likely to survive. This evidence is investigated more formally in what follows.
DefineYS
i = 1if firmi’s status is reported as active or merged out. I estimate
PrYiS = 1 = Pr [Ziγ+IFiδ+ui >0] = Φ [Ziγ+IFiδ] (1.4)
whereZi ≡ [Xi, Yi]and ui is a random error. Thus,Zi includes all controls in (1.2)
plus the financing event dummy Yi . Marginal effects of IF and Y are reported
in Table 1.16, together with marginal effects obtained by estimating (1.2) on the California sample.44
The effect of informal finance on the probability of future financing events confirms the general findings based on the analysis of the full sample and discussed in the previous section. In model (1.4), follow-on financing events are associated with higher probabilities of survival. There are several possible explanations behind this result. Formal investors in follow-on rounds may be able to select successful firms or they may directly contribute to performance improvement with mentoring and guidance. Crucially, marginal effects of informal finance are positive but not significant. Hence, informal finance does not negatively affect performance (prox-ied by survival probabilities).
A consistent interpretation of these results suggests that late stage professional investors are more inclined to provide capital to firms where family and friends of founders are not involved as stakeholders but the motivations behind such prefer-ence are not directly related to the quality of the entrepreneurial project.
1.5.2
Frictions in Private Capital Markets: the Fight for ControlAn alternative explanation is related to the business model of the venture capital industry. Late stage, VC-type investors typically demand some degree of manage-rial control over the firms they finance. This praxis is generally grounded on the premise that, once the start-up has successfully overcome its embryonic phase and the business idea has been proven commercially viable, professional management is needed in order to grow revenues and scale up operations. This often implies displacing founders’ leadership, for example by replacing existing managers and directors with individuals chosen by the investors. In a 2008 article on the Har-vard Business Review, this is how Noam Wasserman describes his findings on the issue of founders control: “When I analyzed 212 American start-ups that sprang up in the late 1990s and early 2000s, I discovered that most founders surrendered management control long before their companies went public. By the time the ven-tures were three years old, 50% of founders were no longer the CEO; in year four, only 40% were still in the corner office; and fewer than 25% led their companies’ initial public offerings”.45
Founders-entrepreneurs, who are often motivated by non pecuniary goals such as decisional autonomy in the workplace (Hurst and Pugsley [2010], Hamilton [2000]), are likely to resist this transition process. In the article cited above, Wasserman continues: “Founders don’t let go easily, though. Four out of five en-trepreneurs, my research shows, are forced to step down from the CEO’s post. Most are shocked when investors insist that they relinquish control, and they’re pushed out of office in ways they don’t like and well before they want to abdicate”.
The clash over managerial leadership can be costlier and more time consuming for outside investors if existing shareholders/friends side with the founders. Such support may be granted on the basis of altruistic preferences of informal funders. A plausible conjecture follows: informal finance may discourage funding from formal investors because it makes it harder to impose control on funded firms.
To test this hypothesis, I examine changes in the management team for the sub-sample of firms that tap private capital markets at least 3 times (674 observations).
For all of these firms, I can observe the names of managers in officeafterthe follow-on round. The majority of these companies (55%) operate in the technological in-dustry and are mostly located in California (24%), New York (11%), Massachusetts (8%) , Washington (6%) and Texas (5%). The proportion of founders in the man-agement team at the time of the third round of funding is higher for IF-firms. The median (mean) value for this proportion is 82% (71%) for IF-firms and 67% (63%) for NonIF-firms. Moreover, IF-firms are more likely to have founders controlled teams (proportion of founders>51%): 67% versus 59% for NonIF-firms, on average. At the time of the seed round, 846 founders had an executive officer role and, in line with Wasserman’s findings, only 46.2% of them retained this position after the follow-on round. I use this sample of founders-CEOs to estimate the effects of informal finance on the probability of founders retaining executive positions.
DefineEj,i = 1if founder j of firm istill holds an executive position at the time of
the third financing event. I estimate
prob[Ej,i = 1] = Φ [Aj,iθ+IFiϑ]
whereAj,iis a set of controls that includes industry, revenue size, location, number
of quarters between round 1 and round 3, founder’s ethnicity.46 Both the marginal
effect of the single equation probit and the coefficient of a linear probability model are positive and significant, indicating that informal finance increases the proba-bility of executive-founders maintaining their roles by approximately 19% (Table 1.17).
1.5.3
Alternative mechanismsThe evidence provided so far suggests that family and friends are the wrong in-vestors for start-ups because, by helping founders retain control, they discourage late stage outside investors.
control increases for entrepreneurs when family and friends are involved in the venture. In this case, some of the informally funded firms that did not receive follow-on capital may have successfully financed expansion differently, for example with bank loans. This mechanism places the origin of the causal effect of informal finance on a reshuffle of firms’ financing sources pecking order, but hinges on the same argument based on control as the supply driven explanation proposed above.
Alternatively, professional investors may forgo investment opportunities in firms with informal stakeholders because of potential constraints on exit options, such as IPOs or acquisitions. An IPO process can be suspended by the SEC if the issuer has not previously complied with the regulations concerning exemptions to securities laws (such as Regulation D). The length of the necessary checks and the probabil-ity of a breach can increase with the higher regulatory fulfillment requirements associated with offerings conducted with non accredited investors, increasing legal risks for existing shareholders. If, instead of going pubic, the firm is acquired by another company, the merged entity will have to disclose its financial statements to non accredited shareholders. This can discourage acquisitions by non publicly traded companies.
Whether regulations imposed to financial markets in order to protect unsophisti-cated investors can impose additional constraints to entrepreneurship, as the ar-gument above suggests, is an interesting and relevant question. However, because of lack of exit data, it cannot be addressed within this study.
1.6
ConclusionsDespite the strong interest that entrepreneurship and its role in economic growth attracts among the general public and policy makers, there is limited empirical knowledge on small and young firms choices in terms of financing sources and what repercussions these may have on firms’ survival and success. This is mostly due to lack of relevant and readily available databases. In this paper I contribute closing this gap by examining whether recourse to family and friends financing during the early stages of business investment affects firms ability to raise capital in later rounds.
finance. Incidentally, the extensiveness of the collected dataset sheds new light on a blind spot of entrepreneurial finance literature, namely the pre-VC phase of startups.
In order to address the issue of endogeneity of informal finance, I construct an instrument based on founders’ surnames which is employed as a proxy for small family size. A bivariate model is estimated, where the instrument is included in the regression for the potentially endogenous variable. I find that informal finance reduces the probability of future financing events in private capital markets by 15% to 19% . These results suggest that, while informal finance can relax financial constraints in early stages, it can impose additional restrictions on future access to capital.
Table 1.1: Seed Round Summary Statistics: Industry
Frequency of first financing events (i.e. seed rounds) by Industry. The list of industry categories is provided on Form D. The filing issuer chooses the one that best qualifies its business.
Industry Freq. %
Agriculture 41 0.6%
Airlines and Airports 4 0.1%
Biotechnology 157 2.3%
Business Services 178 2.6%
Coal Mining 1 0.0%
Commercial 497 7.4%
Computers 160 2.4%
Construction 32 0.5%
Electric Utilities 23 0.3%
Energy Conservation 31 0.5%
Environmental Services 14 0.2%
Health Insurance 3 0.0%
Hospitals and Physicians 28 0.4%
Lodging and Conventions 24 0.4%
Manufacturing 238 3.5%
Oil and Gas 411 6.1%
Other 1,568 23.3%
Other Energy 128 1.9%
Other Health Care 413 6.1%
Other Real Estate 344 5.1%
Other Technology 1,627 24.2%
Other Travel 14 0.2%
Pharmaceuticals 56 0.8%
Residential 321 4.8%
Restaurants 183 2.7%
Retailing 155 2.3%
Telecommunications 53 0.8%
Tourism and Travel Services 14 0.2%