2018 International Conference on Modeling, Simulation and Optimization (MSO 2018) ISBN: 978-1-60595-542-1
Using Logic Regression Algorithm to Analyze and Predict
NBA Game Data
Xiao-qin TU
The College of Arts and Sciences Yunnan Normal University, 650222 Kunming China
Keywords: Data analysis, NBA, Logistic regression, K-means clustering, Result prediction.
Abstract. By collecting the basic statistics of NBA players, teams, seasons, and league matches over the last three years, The data were analyzed by K-Means method, The analysis results are sorted according to the strength of the team and divided into five grades; Each team's past matches and Elo grades are used as characteristic vectors, The relationship between each game and the winning team is analyzed by machine learning logic regression method, Finally, through the python programming can predict probability of each team in each game, and with all the strength of the team was compared to verify the prediction results.
Introduction
K-Means is one of the most commonly used clustering algorithms. The biggest feature of the algorithm is simple, good understanding and fast operation. In which K represents the number of categories, and Means the mean. The K-Means algorithm divides the similar data points through the preset K values and the initial centroid of each category. The optimal clustering results are obtained by means of the mean iteration optimization after division. Logistic regression is a commonly used machine learning method in the current industry. The possibility of estimating something. In this paper, the logical regression method is used to predict the probability of each team winning in each game.
Data Analysis
NBA's game data, there are 5 tables per year. The average performance statistics of each team, the statistics of each opponent's average match, the comprehensive statistics, and the data of the 5 tables of progress and result are presented. It includes the competition team ranking, the number of participating in matches, the number of hits, the number of shots, the number of hits in the 3 points, the probability of winning based on Pythagorean theory, and the probability of transport based on Pythagorean theory. The proportion of the number of times the number of throws is taken. To calculate the odds of each team winning each game, Team Per Game Stats, Opponent Per Game Stats and Miscellaneous Stats (then referred to as T, Stats and table) are used to form the data of the three tables, and the two teams' respective grades are used to represent the characteristics of a team in the competition.
K-means Cluster Analysis of the Strength of Each Team
Distance and phase degree are the basis of clustering. There are many methods to calculate the degree of phase heterogeneity, such as scalar, two variable, classified variable, ordinal variable, vector and so on. In this paper, the scalar method is used to calculate the phase difference. The effect of the large range of values on the distance is higher than that of the small value range. To balance the effects of each attribute on the distance. Usually, each attribute is mapped to the [0,1] interval, and the mapping formula is:
[0,1] normalization of data in a comprehensive statistical table by mapping formula. Let k=5 be divided into 30 groups. The 5 teams are randomly divided into 5 groups: Golden State Warriors, Los Angeles Clippers, Philadelphia 76ers, Sacramento Kings, and Sacramento 5.
d x, y x y x y ⋯ x y (2) Calculate the distance from each group to 5 points randomly selected. The calculation process according to the K-Means clustering method is as follows:
The k elements are randomly selected from the set D as the respective centers of the K clusters.
The differences between the remaining elements and the center of the K cluster are calculated respectively, and these elements are classified into the lowest phase of the phase.
According to the results of clustering, the center of each k cluster is recalculated. The calculation method is the arithmetic average of the respective dimensions of all the elements in the cluster.
All the elements in D are re - cluster according to the new center.
Fourth steps are repeated until the result of clustering is no longer changed. Output the result.
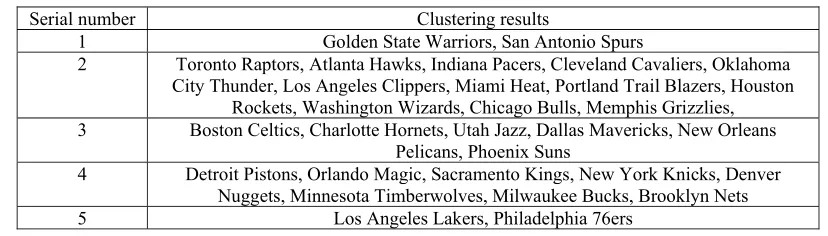
[image:2.612.97.511.321.439.2]Using Python programming, the following results are obtained.
Table 1. NBA team's comprehensive strength ranking (5 grades).
Serial number Clustering results
1 Golden State Warriors, San Antonio Spurs
2 Toronto Raptors, Atlanta Hawks, Indiana Pacers, Cleveland Cavaliers, Oklahoma City Thunder, Los Angeles Clippers, Miami Heat, Portland Trail Blazers, Houston
Rockets, Washington Wizards, Chicago Bulls, Memphis Grizzlies, 3 Boston Celtics, Charlotte Hornets, Utah Jazz, Dallas Mavericks, New Orleans
Pelicans, Phoenix Suns
4 Detroit Pistons, Orlando Magic, Sacramento Kings, New York Knicks, Denver Nuggets, Minnesota Timberwolves, Milwaukee Bucks, Brooklyn Nets
5 Los Angeles Lakers, Philadelphia 76ers
According to the results of clustering, we can see that, Golden State Warriors, San Antonio Spurs two teams in the last three years of the competition, the high strength, And through the data of nearly three years, Los Angeles Lakers, Philadelphia 76ers two teams relatively weak strength. From the data in the table1, the number 1 has the highest team level, followed by the team in the sequence number 2 and the lowest level in the serial number 5.
ELO Grade Score
The Elo rating system was created by the Hungarian American physicist Elo to measure the level of all kinds of chess players. It is an accepted and authoritative approach to the evaluation of game level today, this method is widely used in chess, go, basketball, football and other sports.
Suppose the current levels of A and B are divided into Ra and Rb, A winning expectations for the
B value of Ea:
E ⁄ (3) B on A win rate expected value is Eb:
E ⁄ (4) If the A in the game's true score Sa and his winning expectation Ea, Then his grade should be
So we'll use a feature vector that represents a game's data (join A and B): the A team Elo Score, the A team's T, O, and M table statistics. the B team Elo Score, the B team's T, O, and M table statistics.
Result prediction:
There are 82 games for each team. In each field, the result of the results of each game is predicted by using the logic regression algorithm. Suppose that our sample is {x, y}, y is 0 or 1, representing a positive class or a negative class. x is a sample feature vector of m dimension. So the sample x belongs to the positive class, that is, the "probability" of y=1 can be represented by the following logical function.
p y 1|x; θ σ θ x (6) Among them, θ is the model parameter, that is, the regression coefficient, and the σ is the sigmoid function. In fact, this function is derived from the logarithmic probability transformation below. That is, the logarithm of the ratio of the X to the possibility of the positive class and the negative class.
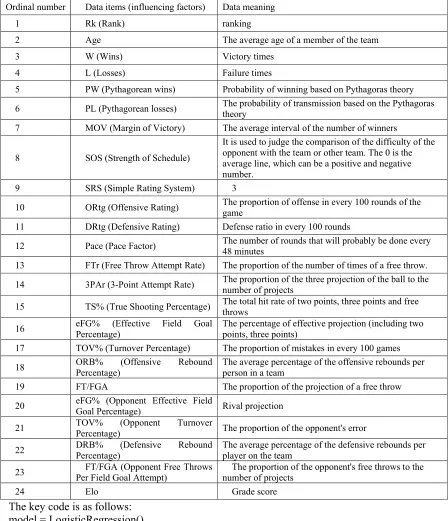
Table 2. Influencing factors.
Ordinal number Data items (influencing factors) Data meaning
1 Rk (Rank) ranking
2 Age The average age of a member of the team
3 W (Wins) Victory times
4 L (Losses) Failure times
5 PW (Pythagorean wins) Probability of winning based on Pythagoras theory
6 PL (Pythagorean losses) The probability of transmission based on the Pythagoras theory
7 MOV (Margin of Victory) The average interval of the number of winners
8 SOS (Strength of Schedule)
It is used to judge the comparison of the difficulty of the opponent with the team or other team. The 0 is the average line, which can be a positive and negative number.
9 SRS (Simple Rating System) 3
10 ORtg (Offensive Rating) The proportion of offense in every 100 rounds of the game
11 DRtg (Defensive Rating) Defense ratio in every 100 rounds
12 Pace (Pace Factor) The number of rounds that will probably be done every 48 minutes
13 FTr (Free Throw Attempt Rate) The proportion of the number of times of a free throw.
14 3PAr (3-Point Attempt Rate) The proportion of the three projection of the ball to the number of projects
15 TS% (True Shooting Percentage) The total hit rate of two points, three points and free throws
16 eFG% (Effective Field Goal Percentage) The percentage of effective projection (including two points, three points)
17 TOV% (Turnover Percentage) The proportion of mistakes in every 100 games
18 ORB% (Offensive Rebound
Percentage)
The average percentage of the offensive rebounds per person in a team
19 FT/FGA The proportion of the projection of a free throw
20 eFG% (Opponent Effective Field Goal Percentage) Rival projection
21 TOV% (Opponent Turnover
Percentage) The proportion of the opponent's error
22 DRB% Percentage) (Defensive Rebound The average percentage of the defensive rebounds per player on the team
23 Per Field Goal Attempt) FT/FGA (Opponent Free Throws number of projects The proportion of the opponent's free throws to the
24 Elo Grade score
The key code is as follows: model = LogisticRegression() model.fit(X, y)
for index, row in schedule1617.iterrows(): team1 = row['Vteam']
team2 = row['Hteam']
else:
winner = team2 loser = team1
result.append([winner, loser, 1 - prob])
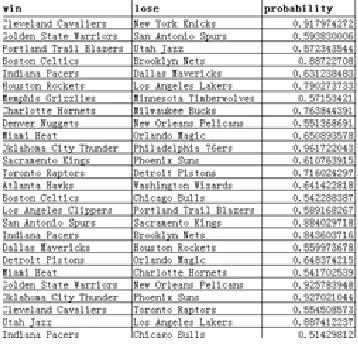
The results are stored in the excel table, and the result of the winning probability of each team is shown as shown on the right. As you can see from the diagram, Cleveland Cavaliers is PK with New York Knicks, and the probability of winning the Cleveland Cavaliers is 91.79%.
Conclusion
In this paper, the NBA game data of the last three years are modeled and analyzed by machine learning method. Predict the results of each game. In the result of the prediction, no positive and negative points are given, but the probability of winning is given. The results of the comparative analysis of the comprehensive strength of Table 1 and the prediction results of Figure 1 can be found. In Table 1, teams with relatively high strength are more likely to win. For example, Golden State Warriors team, because of the overall strength and the San Antonio Spurs team in the same class, so the winning probability is less than 59.38%; Figure 2 shows the probability of winning the Golden State Warriors team in each game in 82 games. In Figure 3, the probability of a weak Philadelphia 76ers team failed because of its weak strength, so the probability of failure is also larger. Through the analysis above, the higher the strength of the team, the greater the probability of winning. The smaller the weaker team won, the smaller the probability of winning. This is in line with the results in Table 1. The changes in the players were not taken into account in the data considered. At the same time, this model needs further improvement. Combined with different regression and decision machine learning models, we can build a more comprehensive and accurate prediction model.
[image:5.612.216.395.389.561.2]
Figure 2. Golden State Warriors Team forecast. Figure 3. Philadelphia 76ers Team forecast.
Reference
[1] Peter Harrington. Machine Learning in Action [D]. Manning Publications Co. Development editor. 2014.
[2] Zhou Zhihua. Machine learning [D]. Tsinghua University Press. 2015.58-60.
[3] Wesley Chun. Python core programming [D]. people post and Telecommunications Press. [4] Luan Hongbo, Wen Fuan. The application of data mining in the prediction of College English performance, [J]. Software, 2016, 37 (3): 67-69