AN INVESTIGATION INTO THE RELATIONSHIP
BETWEEN POST OCCUPANCY BEHAVIOUR AND
ENERGY EFFICIENCY IN RESIDENTIAL BUILDINGS
IAN MICHAEL LEMON
PhD
ii
A
BSTRACTCurrently scientists remain concerned regarding the earth’s temperature and forecast that the earth’s temperature will rise due to global warming by 2050. The earth has reached its hottest in nearly 3 million years. This has had a major effect on climate conditions, causing extreme weather fronts, flooding and storms the strength of which have never been encountered before. Taking all these events into account, global warming, weather conditions, CO2 emissions and energy usage, Government agencies, Engineers and Designers need not only to set targets, offer incentives, design and construct new buildings and improve the existing housing stock with energy saving technologies in mind, but consider the end user and how each one of these will perceive the technologies.
Occupants remain unique in their behaviour, understanding and beliefs relating to energy conservation. Therefore, this project analysed the relationship between occupancy behaviour and energy efficient technologies. The assessment of behaviour and energy usage was achieved by investigating innovative technologies that had been installed in an energy efficient retrofitting pilot case study. These technologies included Balco glazing system, air source heat pumps, voltage optimisation units, phase change material, thermodynamics, passivents, energy efficient boilers, solar panels and external structural insulation.
This pilot study consisted of 51 dwellings, based on 5 property types including a mixture of semi-detached houses British Iron and Steel Federation (BISF), semi-detached and mid terraced bungalows and flats, all constructed in the south east of the UK between 1950 -1970.
Behaviour traits of occupants along with energy usage were collected over a period of 2 years. Data was collected through questionnaires, before and after the energy efficient retrofitting works had been carried out, supported by interviews and random observations.
iii
characterised by structural insulation, boilers and solar panels. Furthermore, all the occupants living in this type of retrofitted properties were employed. They were conversant with maintenance manuals and the use of the internet, familiar with the types of energy efficient technologies that had been fitted and they paid their energy bills by pre-payment card.
The outcomes of this investigation could further advance the research in the area of the energy retrofitted residential housing in order to maximise their energy efficiency based on occupants’ behaviour, matched against user-friendly technologies, thus supporting designers, management agents, manufactures as well as responding to the occupants’ needs.
iv
TABLE OF CONTENTS Abstract ... ii
Table of contents ... iv
List of Figures ... xv
List of Tables... xix
List of Abbreviations ...xxii
Acknowledgment ...xxiv
Introduction ... 1
1.1 Problem statement... 5
1.2 Aim and objectives of the research ... 7
1.3 Contributions ... 7
1.4 Development effort ... 10
1.5 Structure of the thesis ... 10
Literature Review ... 13
2.1 Scope ... 13
2.2 Government policy ... 14
2.2.1 Energy efficiency of the residential buildings ... 14
2.2.2 BREEAM ... 15
2.2.3 Home Information Pack and Home Energy Report ... 17
2.2.4 Warm Front Scheme ... 18
2.2.5 London Plan ... 20
2.2.6 Code for Sustainable Homes ... 21
2.2.6.1 Cessation for the Code of Sustainable Homes ... 23
v
2.2.8 Feed-In Tariffs and Renewable Incentives ... 24
2.2.9 Stamp Duty Relief ... 24
2.2.10 Carbon Emission Reduction Target ... 25
2.2.11 Energy Performance Certificate (EPC) ... 26
2.2.12 Green Deal ... 28
2.2.13 Summary of Government Policies ... 30
2.3 The influence of the occupants’ behaviour on energy efficiency ... 31
2.3.1 Age ... 31
2.3.2 Lifestyle ... 33
2.3.3 Behaviour Change ... 34
2.3.4 Occupants Habits ... 35
2.3.4.1 Fuel Poverty ... 38
2.3.4.2 Well Being ... 39
2.3.4.3 Household size ... 40
2.3.4.4 Type of Resident (Owner /Tennant) ... 41
2.3.5 Occupancy and Design ... 42
2.3.6 Time Constraints ... 44
2.3.7 Financial Objectives ... 45
2.3.8 Landlord’s obligation ... 46
2.3.9 Summary ... 47
2.4 Buildings ... 49
2.4.1 Housing Stock ... 49
2.4.2 Listed Buildings ... 50
2.4.3 Demolition ... 50
2.4.4 Retrofitting Buildings ... 51
2.4.5 Building Fabric ... 54
vi
2.5 The effect of the green technologies on energy efficiency ... 55
2.5.1 Renewable Energy Systems ... 56
2.5.2 Improvements to energy performance ... 57
2.5.2.1 Household Energy Consumption ... 58
2.5.2.2 Emerging Technologies ... 58
2.5.2.3 Cost effectiveness of new technologies ... 59
2.5.3 Smart Monitoring Systems ... 59
2.5.4 Smart Thermostat Systems ... 61
2.5.4.1 Security- smart systems ... 62
2.5.4.2 Cost saving ... 63
2.5.5 Heating appliances... 63
2.5.6 Insulation ... 64
2.5.6.1 Windows ... 66
2.5.7 Passive Heating and Cooling ... 67
2.5.7.1 EU Commitment ... 69
2.6 After Care ... 70
2.6.1 Post-Handover Monitoring ... 70
2.6.2 Current Best Practice ... 72
2.6.3 Soft Landings ... 73
2.7 Building Performance and Design ... 75
2.8 The Benefits of delivering Green Technologies ... 78
2.9 Summary ... 79
2.9.1 Gap in knowledge ... 79
Methodology ... 81
vii
3.2 Characteristics of the residential buildings ... 81
3.3 Outline of the research methods ... 82
3.4 Technology study I... 84
3.5 Occupants study ... 86
3.5.1 Questionnaires’- ... 86
3.5.2 Interviews ... 88
3.5.3 Eco Clinics ... 88
3.6 Energy study iii ... 89
3.7 Data Analysis methods ... 90
3.7.1 Grounded Theory approach. ... 90
3.7.2 Descriptive Statistics ... 90
3.7.3 Cluster Analyses ... 91
3.8 Data preparation ... 92
3.8.1 Questionnaires’ Analysis and Classification of the Variables ... 92
3.8.2 Statistics Analysis using the SPSS Software ... 92
3.8.3 Principle Component analyses ... 93
3.9 Ethics ... 94
3.10 Summary ... 94
3.10.1 Contribution to the field of Sustainable Development. ... 95
Questionnaire study ... 96
4.1 Introduction to Occupants ... 96
4.2 Presentation Evening... 97
4.3 The Questionnaire ... 97
4.4 C Properties ... 98
4.5 L Properties ... 100
4.6 P Properties ... 101
viii
4.7 PA Properties ... 103
4.7.1 Summary ... 104
4.8 PB Properties ... 104
4.8.1 Summary ... 105
4.9 R & WC Properties ... 105
4.9.1 Summary ... 106
4.10 Eco Clinic ... 107
Energy efficiency of the residential buildings in relation to interventions ... 109
5.1 The Project ... 110
5.1.1 Types of the interventions ... 116
5.1.1.1 Structural External Wall Insulation- SEWI ... 116
5.1.1.2 External Wall Insulation ... 117
5.1.1.3 Vacuum Insulated Panels (VIP Insulation) ... 119
5.1.1.4 Balcony Enclosure ... 121
5.1.1.5 Micro CHP... 122
5.1.1.6 Air Source heat pumps ... 123
5.1.1.7 Single Heat Recovery Ventilation ... 124
5.1.1.8 Phase Change Material ... 124
5.1.1.9 Photovoltaic Panels ... 125
5.1.1.10 Thermodynamics ... 125
5.1.1.11 LEDS-Light emitting diodes ... 126
5.1.1.12 Voltage optimization ... 126
ix
5.1.1.14 Wi Fi Hubs ... 127
5.1.1.15 Smart metering ... 127
5.1.2 Properties and interventions ... 128
5.1.2.1 Properties C ... 128
5.1.2.2 Properties L... 137
5.1.2.3 Properties PA ... 140
5.1.2.4 Properties PB ... 144
5.1.2.5 Properties P ... 146
5.1.2.6 Properties R and WC ... 151
5.1.2.7 Thermal Imaging ... 155
5.2 Data analyses ... 156
5.2.1 Cluster Analyses ... 156
5.3 Overview of the data ... 156
5.3.1 Intervention data ... 156
5.3.2 Energy efficiency data ... 158
5.4 Results- Hierarchy Clustering ... 159
5.4.1 Hierarchy Cluster analyses ... 159
5.4.2 Clustering of the properties ... 159
5.4.2.1 6 Clusters ... 161
5.4.3 Energy efficiency in relation to type of intervention ... 164
5.4.3.1 Comparison of Gas usage- 2013 and 2015 [Technologies] ... 164
5.4.3.2 Comparison of Electricity usage 2013-15 [Technologies] ... 168
5.5 Discussion ... 172
x
5.5.2 Why there is a difference or no difference in Clusters ... 173
5.6 Supporting literature ... 173
5.7 Conclusions ... 175
Energy efficiency of the residential buildings in relation to occupants behaviour ... 177
6.1 Occupants’ characteristics/Profile – Exploratory data analysis ... 178
6.1.1 Background ... 179
6.1.2 Age of the occupants ... 179
6.1.1 Government Policy’s ... 181
6.1.2 Energy Consumption in Domestic Buildings ... 183
6.1.3 Energy Monitoring ... 185
6.1.3.1 Smart meters ... 185
6.1.3.2 Data loggers... 186
6.1.4 Lifestyle ... 191
6.1.5 IT Skills ... 192
6.1.6 Household Size ... 194
6.1.7 Well being ... 195
6.1.8 Uptake of New Technologies (by technology) by occupants ... 197
6.1.9 Discussion ... 202
6.1.9.1 Government policies ... 202
6.1.9.2 Energy Results ... 203
6.1.9.3 IT ... 204
6.1.9.4 Smart Meters ... 204
6.1.9.5 Well- being ... 204
xi
6.1.9.7 Approachable Estate Department ... 206
6.1.10 Summary ... 207
6.2 Bivariate statistics: relationship between occupants’ characteristics 208 6.2.1 Government policy’s- data analyses ... 209
6.2.2 The internet- data analyses ... 210
6.2.3 Eco clinic Data-analyses ... 212
6.2.4 Improvements in comfort levels ... 213
6.2.5 Management Organisation (SEH) ... 215
6.2.6 Summary ... 217
6.3 Multivariate statistics: Principal Component Analysis ... 218
6.3.1 Phase 1 Study ... 219
6.3.1.1 (a) Results-Scree plot – Likert Scale/Ordinal data ... 219
6.3.1.2 Summary data for stage 1 and stage 2 ... 221
6.3.1.3 Phase 1. Rotated Matrix-Ordinal data ... 223
6.3.1.4 Phase 1. Rotated Matrix-Nominal data ... 225
6.3.1.5 Summary Data (Phase 1) Ordinal data -Likert scale ... 226
6.3.1.6 Summary Data (Phase 1) Nominal data ... 226
6.3.1.7 Phase 1 –Questionnaire ... 227
6.3.1.8 Results Phase 1 PCA. Ordinal Data-Likert Scale ... 228
6.3.1.9 Results Phase 1 PCA. Nominal Data ... 231
6.3.1.10 Summary ... 233
6.3.2 Phase 2 Study - 2nd Questionnaire ... 233
6.3.2.1 Results-Scree plot- Likert scale /ordinal data ... 234
6.3.2.2 Summary data for stage 1 and stage 2 ... 235
xii
6.3.2.3 Phase 2. Rotated Matrix-Ordinal data ... 237
6.3.2.4 Phase 2. Rotated Matrix-Nominal data ... 237
6.3.2.5 Summary Data (Phase 2) Ordinal data -Likert scale ... 240
6.3.2.6 Summary Data (Phase 2) Nominal data ... 240
6.3.2.7 Phase 2 – 2nd Questionnaire- ... 241
6.3.2.8 Results Phase 2 PCA. Ordinal Data-Likert Scale ... 242
6.3.2.9 Results Phase 2 PCA. Nominal Data ... 244
6.3.2.10 Summary ... 246
6.3.3 Phase 1 vs Phase 2 ... 247
6.3.3.1 Discussion- Phase 1 vs PHASE 2 -Ordinal ... 248
6.3.3.2 Discussion- Phase 1 vs Phase 2 -Nominal ... 250
6.3.3.3 Conclusion ... 250
6.4 Cluster analysis ... 251
6.4.1 Overview of the data ... 251
6.4.2 Clustering of the occupants based on their characteristics ... 251
6.4.3 Energy efficiency in relation to Occupants’ profile ... 263
6.4.3.1 Comparison Gas usage 2013-2015 [occupants] ... 264
6.4.3.1.1 Analyses of data-Gas ... 266
6.4.3.2 Comparison Electricity 2013-2015 [ occupancy ] ... 268
6.4.3.2.1 Analyses of data electricity ... 270
6.5 Discussion ... 270
xiii
Energy efficiency of the residential buildings in relation to technologies fitted and occupants behaviour ... 272
7.1 Introduction ... 272
7.2 Relationship between occupant profile and technology fitted in residential buildings ... 273
7.2.1 Occupants profile-technologies ... 274
7.2.1.1 Group A ... 274
7.2.1.1 Group B ... 276
7.2.1.2 Group C ... 277
7.2.1.3 Group D ... 277
7.2.1.4 Discussion ... 278
7.3 Energy efficiency – gas ... 279
7.3.1 Summary- Gas usage ... 281
7.3.2 Discussion ... 282
7.4 Energy efficiency - electricity ... 283
7.4.1 Summary- Electricity usage ... 286
7.4.2 Discussion ... 288
7.5 Chapter Conclusions ... 289
Discussion ... 290
8.1 Methods of investigation ... 291
8.2 Technology section ... 292
8.3 Occupancy Section. ... 294
8.3.1 Aftercare ... 295
8.4 Technologies v Occupants Behaviour ... 295
xiv
Conclusions ... 297
9.1 Main research conclusions ... 297
9.2 Limitations of Study ... 302
9.3 Contribution to Knowledge ... 302
References... 305
Appendix 1 Questionnaires ... 317
Appendix 2 Interventions ... 335
Appendix 3 Classification of Variables ... 336
Appendix 4 Energy ... 342
xv
LIST OF FIGURES Figure 2.1 Average Energy Consumption of a domestic building 2009. ... 33
Figure 2.2 Historical projected numbers of households in fuel poverty in England 1996 to 2016 (Department of Trade and Industry, 2007) ... ... 38
Figure 2.3 Average house price from 1991 to 2015 (Economicshelp.org, 2015) ... 46
Figure 2.4 Passipedia-The passive house resource Francis Bosenick (2015). . ... 68
Figure 5.1 The Eco Clinic: sustainable timber frame building for site meetings/ Friendly drop in centre (a) external view (b) internal view. ... 112
Figure 5.1a Construction format ... 112
Figure 5.2 Location of the properties investigated in this study. ... 115
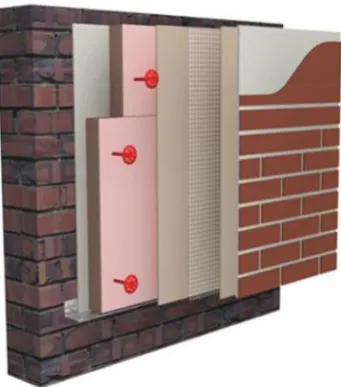
Figure 5.3 Structural external wall insulation. ... 117
Figure 5.4 External wall insulation structure ... 119
Figure 5.5 Vacuum insulation panels (VIP). ... 120
Figure 5.6 Balco system. ... 121
Figure 5.7 Ceramic Fuels cells (a) Bluegen boiler (b) Back up boiler ... 122
Figure 5.8 Air Source Heat Pump. ... 123
Figure 5.9 Single heat recovery units. ... 124
Figure 5.10 Phase change material (PCM). ... 124
Figure 5.11 Photovoltaic Panels. ... 125
Figure 5.12 Thermodynamics (Smart house technical data, 2013) ... 126
Figure 5.13 Light emitting diodes (LEDs). (Edison tech centre, 2013) ... 126
Figure 5.14 Voltage Optimisation Unit (Smart house technical data, 2013) .. 127
Figure 5.15 DC Circuits. (Smart house technical data, 2013) ... 127
Figure 5.16 Smart metering and monitoring system (Smart house technical data, 2013). ... 128
Figure 5.17 Properties C1-C7. ... 130
Figure 5.18 BIS Property. ... 131
xvi
Figure 5.20 Works carried out on BIS properties.(a) BIS property with scaffolding erected. (b) Structural insulation fitted to the entire house. (c) Structural insulation fitted to front elevation. (d) Passive vents. ... 134
Figure 5.21 Works carried out on BIS properties. (a) prior to rendering. (b) rendered coat being applied to gable end 1st storey. ... 135
Figure 5.22 BIS Properties (a) before works (b) after works. ... 135
Figure 5.23 PCM Phase Change Material- ceiling boards (a) PCM Phase chase material-ceiling boards (b) PVA sealer being applied to PCM. 136 Figure 5.24 (a) Prepared PCM ceiling (b) Plastered ceiling (c) decorated ceiling (d) Existing floor ... 137
Figure 5.25 Properties L1-L8. ... 138
Figure 5.26 Properties L1-L8 ... 139
Figure 5.27 Properties PA1-PA3 ... 141
Figure 5.28 Rear elevation of property PA (a) EWI (b) Final coat render being applied (c ) Completed rendered panels replicating brickwork (d) Gable end finish replicating face brickwork. ... 142
Figure 5.29 Completed EWI and rendered finish replicated face brickwork. . 143
Figure 5.30 Properties PB1-PB10. ... 144
Figure 5.31 Properties PB. ... 145
Figure 5.32 View of the terrace block of bungalows. (a) Mid terrace (b) End terrace ... 146
Figure 5.33 Properties P1-P14. ... 148
Figure 5.34 Original balcony (a) rear elevation (b) front elevation. ... 149
Figure 5.35 Balco (a) rear elevation flats (b) 1st storey balcony walls removed (c) lifting operation (d) Completed Balco system. ... 150
Figure 5.36 Heating system placed in the loft area (a) CHP Boiler (b) Blue Gen Boiler... 151
Figure 5.37 Properties R1-R6 and WC1-WC4. ... 152
xvii
Figure 5.39 Thermal imaging to BIS Properties R and Wc prior to the insulation ... 155
Figure 5.40 Thermal imaging to BIS Properties R and Wc after the insulation ... ... 155
Figure 5.41 Dendrogram ... 160
Figure 5.42 Distribution of difference in gas usage between 2013 and 2015 data for residential buildings clusters. ... 165
Figure 5.43 Distribution of difference in electricity usage between 2013 and 2015 data for residential buildings clusters ... 169
Figure 6.1 Average age of occupants. ... 180
Figure 6.2 Understanding Government Policies. ... 182
Figure 6.4 Energy providers. ... 183
Figure 6.5 Method of payment. ... 184
Figure 6.6 Understanding of how a smart meter works (a) Phase 1. (b) Phase 2. ... 186
Figure 6.7 (a) Temperature logger. (b) Thermal Imaging camera. (c) Thermal image BIS property prior to the fitting of EWI. (d) Thermal image after EWI has been fitted. ... 187
Figure 6.8 Six results from temperature logger installed in BISF (R1) property. ... 188
Figure 6.9 Energy usage R & WC properties. ... 190
Figure 6.3 Life style. ... 191
Figure 6.10 Own a Computer. ... 192
Figure 6.11 Computer skills. ... 192
Figure 6.12 Household size. ... 194
Figure 6.13 Drawing curtains at night. ... 195
Figure 6.14 Improvements to health. ... 195
Figure 6.15 Explanation regarding Technologies’. ... 197
Figure 6.16 Cost monthly energy bills. ... 198
Figure 6.17 How approachable were the estates department (a) [Phase 1]. (b) [Phase 2]. ... 199
Figure 6.18 Improvements in energy bills. ... 200
xviii
Figure 6.20 Government policies ... 209
Figure 6.21 Internet Skills ... 211
Figure 6.22 Eco clinic ... 212
Figure 6.23 Improvement in comfort levels ... 213
Figure 6.24 Management Organisation (SEH) and Interventions ... 216
Figure 6.25 Scree plot, Inflection point –Likert scale (Phase 1). ... 220
Figure 6.26 Scree plot, Inflection point –Nominal scale (Phase 1). ... 220
Figure 6.27 Scree plot, Inflection point –Likert scale (Phase 2) ... 234
Figure 6.28 Scree plot, Inflection point –Nominal scale (Phase 2). ... 234
Figure 6.29 Distribution of difference in gas usage between 2013- 2015 data for occupant groups. ... 265
Figure 6.30 Distribution of difference in electricity usage between 2013- 2015 data for occupant groups. ... 268
Figure 7.1 Mean and median of the gas usage difference in the groups (occupants-technology) ... 279
Figure 7.2 Mean and median of the gas usage difference in the groups (occupants-technology) for groups with N>2 ... 279
Figure 7.3 Mean and median of the electricity usage difference in the groups (occupants-technology) ... 283
xix
LIST OF TABLES Table 1.1 Mapping objectives to specific research questions and contributions. ... 8
Table 1.2 Mapping objectives to specific research questions and contributions (continued from previous page). ... 9
Table 2.1 London Plan Proposed Energy Efficient Measures ... 21
Table 2.2 Code for Sustainable Homes Carbon Reduction Schedule ... 22
Table 2.3 Percentage of CO2 emissions reduced from behavioural changes using pair semi-detached houses as a case study. Bio Regional (2012) ... 35
Table 2.4 Glass ratings for-England, Scotland and Wales ... 66
Table 3.1 Interventions (cont.) The highlighted interventions were not fully commissioned at the end of the data collection period. ... 85
Table 5.1 Property and technologies installed. ... 130
Table 5.2 Property type and technologies installed. ... 139
Table 5.3 Property type and technologies installed. ... 141
Table 5.4 Property types and technologies installed... 145
Table 5.5 Property and technologies installed. ... 148
Table 5.6 Property types and technologies installed... 152
Table 5.7 Coding of Interventions ... 157
Table 5.8 Group 1 –cluster set ... 162
Table 5.9 Group 2 –cluster set ... 162
Table 5.10 Group 3 –cluster set ... 163
Table 5.11 Group 4 –cluster set ... 163
Table 5.12 Group 5 –cluster set ... 163
Table 5.13 Group 6 –cluster set ... 163
Table 5.14 Summary statistics showing the difference in gas usage between 2013 and 2015 data for residential buildings clusters. ... 164
Table 5.15 P-values from Dunn’s Kruskal-Wallis multiple comparison test for gas 2013-15 ... 166
xx
Table 5.17 P-values from Dunn’s Kruskal-Wallis multiple comparison test for electric 2013-15 ... 170
Table 6.1 Summary data for stage 1 and stage 2. ... 221
Table 6.2 Rotated Matrix - [phase 1]- Ordinal (Likert Scale). ... 224
Table 6.3 Rotated Matrix- [phase 1] - (Nominal Data) ... 225
Table 6.4 Summary Data (Phase 1) Likert scale. Ordinal data ... 226
Table 6.5 Summary Data (Phase 1) Nominal Data ... 227
Table 6.6 Summary data for stage 1 and stage 2 (Phase 2). ... 235
Table 6.7 Rotated Matrix- [phase 2] - Ordinal (Likert Scale) ... 238
Table 6.8 Rotated Matrix- [phase 2] (Nominal Data) ... 239
Table 6.9 Summary Data (Phase 2) Likert scale data ... 240
Table 6.10 Summary Data (Phase 2) nominal data. ... 240
Table 6.11 Summary Data- Phase 1 vs Phase 2 Likert scale. ... 247
Table 6.12 Summary Data- Phase 1 vs Phase 2. Nominal data. ... 248
Table 6.13 Summary Data- Phase 1 vs Phase 2 ... 252
Table 6.14 Group A- cluster set ... 253
Table 6.15 Group B- cluster sets ... 255
Table 6.16 Group C- cluster sets ... 257
Table 6.17 Group D- cluster sets ... 259
Table 6.18 Showing strongest links in groups A, B, C & D cluster 4 ... 262
Table 6.19 Showing 4 distinctive cluster groups A, B, C & D. ... 263
Table 6.20 Summary statistics showing the difference in gas usage between 2013 - 2015 data for residential buildings. ... 264
Table 6.21 P-values from Dunn’s Kruskal-Wallis multiple comparison test for gas 2013 -2015 ... 265
Table 6.22 Summary statistics of difference in electricity usage between 2013 - 2015 data for occupant groups. ... 268
Table 6.23 P-values from Dunn’s Kruskal-Wallis multiple comparison test for electricity 2013 -2015 ... 269
Table 7.1 Technology Clusters v Occupants Clusters ... 273
Table 7.2 Property groups- interventions mapped with behaviour ... 274
xxi
Table 7.4 % of the electricity usage difference in the groups (occupants-technology) for groups with N>2 ... 285
Table A3.1 Variables Classification ... 336
Table A3.2 Code used on SPSS - Questionnaire Section 1 ... 337
Table A3.3 Code used on SPSS - Questionnaire Section 2 ... 339
Table A3.4 Code used on SPSS - Questionnaire Section 3 ... 341
Table A4.1 Gas usage for Type C Properties – Gas 2013-2015 ... 342
Table A4.2 Electricity usage for Type C Properties – Electric 2013-2015 .... 342
Table A4.3 Gas usage for Type L Properties – Gas 2013-2015 ... 343
Table A4.4 Electricity usage for Type L Properties – Electric 2013-2015... 343
Table A4.5 Gas usage for Type P Properties – Gas 2013-2015 ... 344
Table A4.6 Electricity usage for Type P Properties – Electric 2013-2015 .... 344
Table A4.7 Gas usage for Type P Properties – Gas 2013-2015 ... 345
Table A4.8 Electricity usage for Type P Properties – Electric 2013-2015 .... 345
Table A4.9 Gas usage for Type PB Properties – Gas 2013-2015 ... 346
Table A4.10 Electricity usage for Type PB Properties – Electric 2013-2015 .. 346
Table A4.11 Gas usage for Type R & WC Properties – Gas 2013-2015 ... 347
xxii
L
IST OFA
BBREVIATIONSBISF British Iron and Steel Federation
BRE British Research Establishment
BREEAM Building Research Establishment Environmental Assessment Method
CAT Centre of Alternative Technology
CERT Carbon Emission Reduction Target
CFTs Compact Fluorescent Lamps
CO2 Carbon Dioxide
CIOB Chartered Institute of Building
DECC Department of Energy and Climate Change
ERDF European Regional Development Fund
GHE Greenhouse gas emission
HER Home Energy Report
HIP Home information Pack
LED Light – Emitting Diode
NB N Build
PCA Principal Component Analyses
PVC Polyvinyl Chloride
R A language and environment for statistical computing and graphics
SC Southend Council
xxiii
SPSS Statistical Package Social Sciences
xxiv
A
CKNOWLEDGMENTI would like to thank my supervisors, Dr Mihaela Ciupala and Dr Brian Whiting, for their continuing support, guidance, experience, supervision and above all encouragement throughout the project. Without their help, this project would not have been possible.
I would like to thank Tim Holland ‘SBC’, George Avery ‘SEH’ and all supporting staff to allow me the opportunity to collect data and information from their Really Smart House. The data collected made this project possible.
Special thanks go to my colleagues at UEL, Aloy, Anne, Linda, Cheryl and Graham for their help, advice and guidance throughout my study period.
Additional thanks go to Thiago, Isabella, Ardiana, David and Sarah M for their assistance at various stages of the project.
Without the life coaching skills of Tom, Sarah C and Kinga, inspiring, listening and advising this journey would have been very difficult.
Finally, the support, faith, belief by my wife Carol, our children and grandchildren that I could achieve this dream, was truly inspiring and made the journey worthwhile.
I
NTRODUCTIONAlong with the expansion of the construction industry, the perception of modern day techniques has been continually changing. The simplest example is concrete, the patent for the manufacture of the first Portland cement in 1824 changed the building industry radically (Crook and Day, 2008). Engineers were overwhelmed with the almost boundless possibilities for the use of concrete. They could build bigger, longer, taller - greater and faster than ever before. The main concern of the time was to build safe concrete-structures. Later, next to the safety, the economical aspect of the construction appeared. Nowadays, engineers, clients and the end users are looking not only for safe, economical structures but also for those structures to be sustainable and user friendly.
To fulfil the criteria for the sustainable buildings like The Code of Sustainable Homes and BREEAM standard rules, engineers have to look into the performance of the building in terms of the energy, management, health and well-being, to name but a few (BRE Global Ltd, 2011). Although the designers and builders tick all the boxes for safety, economy and sustainability, the post-completion performance of many buildings continues to disappoint. It often happens that the building results in higher-than-modelled energy consumption and emissions, as well as operational problems for occupants (Usable Buildings Trust, 2014).
construction process and considers the lifecycle of the project involving constructors and designers beyond practical completion. This allows for the observations and learning from the buildings and their performance. Collecting valuable information by energy managers regarding building usage and performance that can be used in the future.
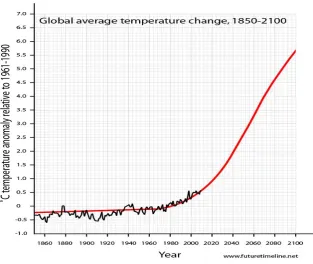
[image:26.595.117.431.390.654.2]Looking beyond the actual performance of the building and the expectations set out by designers the bigger picture includes climate conditions. Scientists remain sceptical regarding the earth’s temperature and forecast that the earth’s temperature will rise due to global warming by 2050. (Fig 1) The earth has reached its hottest in nearly 3 million years. This has had a major effect on climate conditions, causing extreme weather fronts, flooding and storms the strength of which have never been encountered before.
Fig. 1.1 Global average temperature change, 1850-2100
Global average temperature change, 1850-2100 ('2050 Demographics Projections |
Prediction | Future | Technology | Timeline | Trend | 2050 Space Travel | 2050 Global
Increased concentrations of greenhouse gases (Dakwale, Ralegaonkar, and Mandavgane, 2011), which include carbon dioxide, methane, CFCs, halons, nitrous oxide, ozone and peroxyacetyl nitrate in the atmosphere raise the earth’s temperature by trapping heat that has subsequently been radiated by the earth’s surface.
Therefore Building Engineers face a huge task in delivering dwellings that not only address global warming but provide acceptable internal conditions while also considering the external impact and environmental conditions that ultimately affect the amount of energy used in the building (Malmqvist, and Glaumann, 2009).
To further add to these problems, estimations have found that the temperature of the planet has risen by 0.74 degrees Celsius since 1900. Rainfall in England has risen since rain records began in 1766, whilst heavy rain was experienced during the summer of 2012 and as recently as January 2014. (Met Office Hadley Centre, 2016). Subsequently this has led to heavy flooding in Cumbria 2009, and Somerset in January 2014. Somerset encountered some of the worst flooding ever recorded with properties staying underwater for weeks, with many power lines out of commission due to the extreme weather conditions. To add to this, further floods hit Cumbria (figure 1.2) for a third time in December 2015 some of the worst ever encountered.
Figure 1.2 Flood to Cumbria 2015. Macleod, J (2015)
Prior to these events, in 1997 in Kyoto, Japan, the United Nations Framework Convention on Climate Change (UNFCCC) came together to discuss measures that would reduce greenhouse gases in the ensuing years. During this first conference, it was agreed by the UNFCCC delegates that greenhouse gases (or GHG) were likely as a result of developed countries’ industrial activities spanning over the past 150 years (UNFCCC, 2012b).
The Kyoto agreement, drafted on 11th December 1997, stated that the objective of the UNCCC and the resultant Kyoto Protocol is the "stabilization and reconstruction of greenhouse gas concentrations in the atmosphere at a level that would prevent dangerous anthropogenic interference with the climate system” (UNFCCC, 2012a).
accounted for nearly 55% of global greenhouse emissions. The signers of the Protocol pledged to reduce emissions by over 5% by 2012 ('Kyoto Protocol comes into force,' 2005).
To meet the targets set down by the Kyoto Protocol, energy policies subsequently enacted have required that buildings improve their energy efficiency; occupants will need to understand new technologies to enable energy consumption to be reduced. Currently, approximately one third of our energy requirements are used by the building sector (Gonzalez et al., 2011). .
Natural resources such as oil and natural gas can been seen as being responsible for greenhouse gases due to the growing worldwide demand .(Gonzalez et al, 2011)
Taking all these events into account, global warming, weather conditions, CO2 emissions and energy usage, Government agencies, Engineers and Designers need not only to set targets, offer incentives, design and construct new buildings and improve the existing housing stock with energy saving technologies in mind, but consider the end user and how each one of these will perceive the technologies.
Occupants remain unique in their behaviour, understanding and beliefs relating to energy conservation. This project will analyse whether a relationship exists between occupancy behaviour and energy technologies.
1.1 P
ROBLEM STATEMENTthe building design and how it performs but the end user- the occupant. Understanding how occupants behave when assessing energy consumption can be an extensive process. In a textbook environment, investigations on large samples provide a cross sectional view of the occupant, behaviour patterns and energy usage. What can be reasoned is the level of accuracy from the data received from them, many contributing factors such as timing, interpretation and accuracy of responses may influence the results? Additionally, undertaking studies on small populations can allow an informal relationship and trust to be built up by the researcher providing clearer explanations leading to improved results.
Further in-depth studies into occupants understanding of new technologies will also be investigated, along with their understanding of government agency’s policies and targets encouraging a greener future for all. New technologies with little or no history will be included within the pilot scheme and will contribute toward the investigation.
The results from this study may not always be transferable to other geographical locations, inferences such as education, behaviour, types of buildings, disposable income and location may affect the results.
The study further contributes toward meeting government targets to reduce CO2 emissions and energy consumption by 2050.
Based on the problem statement the research question set out in section 1.2 were designed.
1.2 A
IM AND OBJECTIVES OF THE RESEARCHThe main aim of this research is to critically assess, the new technologies government agencies have introduced to reduce carbon emissions in the sustainable built environment and to investigate the relationship between post occupancy behaviour in buildings and energy efficiency.
In line with the aforementioned aim of the research, the following objectives of the present study were identified:
1. Analyse data taken from the retro fit (refurbishment) project through interviews, questionnaires, random observations and systematically data analyses. The study will investigate a mixture of flats, semi-detached bungalows, terraced bungalows and semi-detached BISF houses built between, 1950-1970.
2. Investigate new technologies and the way occupants adapt to them. To obtain energy efficiency, occupants will need an understanding of modern day technology and have the ability to use it effectively.
1.3 C
ONTRIBUTIONSTable 1.1 Mapping objectives to specific research questions and contributions.
Objective Research questions Case studies Contributions Chapter
Analyse data taken from the retro fit (refurbishment) project through interviews,
questionnaires, random observations and systematically data analyses.
The study will investigate a mixture of flats, semi-detached bungalows, terraced bungalows and semi-detached BIS houses
built between 1950-1970.
An investigation into the relationship between post occupancy behavior and energy efficiency in residential buildings
Assess new Technologies Government Agencies have introduced to reduce carbon emissions in the sustainable built
environment
Government agency policies.
Very Smart House Project based on questionnaires, interviews
& observations
Evaluation of occupants’ behaviour with new technologies
& energy efficiency
5
Table 1.2 Mapping objectives to specific research questions and contributions (continued from previous page).
Objective Research questions Case studies Contributions Chapter
Investigate new technologies
and the way occupants adapt to
them.
To obtain energy efficiency,
occupants will need an
understanding of modern day
technology and have the ability to
use it effectively.
Investigate the relationship between post occupancy behavior in buildings and
energy efficiency.
Case study
Really Smart House
R & WC properties.
Identification and selection
1.4 D
EVELOPMENT EFFORTThe investigation into occupant’s behaviour required data from questionnaires to be analysed. Different procedures were considered within the investigation process, these included inferential data analyses, observations and statistical analyses.
To meet government targets to improve energy consumption, reduce CO2 emissions, and introduce new technologies a greater understanding of occupant’s behaviour would be required.
The research has been carried out within the limits of the specific boundaries of research. Each study was subjected to the constraint of time, instruments, opportunities, and location.
1.5 S
TRUCTURE OF THE THESISThe thesis contains nine chapters, the content of which are as follows:
Chapter One includes the background, aim and research questions, the boundaries of the research and the brief description of the contribution to knowledge as an outcome of this research.
in the sustainable built environment. The relationship between post occupancy behaviour in buildings and energy efficiency are identified within the review.
Chapter Three provides an outline of the methods used in this thesis to assess the relationship between technologies used and energy efficiency of the buildings as well as occupant’s behaviour and energy efficiency of the buildings they live in. Both quantitative and qualitative types of methodologies were employed in this research. The research methods used for data collection and analysis are described in section 3.7, and provide a brief description to support the methods chosen.
Chapter Four will look at the questionnaires, the design of the questions and reflect on several of the key responses received from occupants that extended beyond the scope of the questionnaires. Two questionnaire methods were considered at inception; self-administered and Interviewer administered, these will be discussed further within this section
Chapter Five focuses on the types of property’s that formed part of this research
project, the technology’s that were chosen by the design team, SEH and Southend Council including the funding method used to finance the scheme. The study investigated a mixture of flats, semi-detached bungalows, terraced
bungalows all brick built and semi-detached BIS houses built between,, (1950 - 1970).
Chapter Six investigates the characteristics of the occupants, their behaviour patterns that formed part of the research questions, Information extrapolated from questionnaires will be analysed using Inferential Analyses, Bivariate Statistics, (PCA) Principle Component Analyses and Cluster Analyses.
As in any refurbishment project, it is very important to understand how occupants behave (the end users) and can the technology be fully understood and utilised by the occupant.
Chapter Seven presents the energy efficiency of residential building in relation to technologies fitted and occupants’ behaviour. Results from previous cluster analyses investigations were taken from the technology and occupant’s groups from chapters 5 & 6 and compared.
Chapter Eight presents the discussion of the investigation, this will be undertaken by breaking the results down from chapters 5,6 & 7 and carrying out an in depth post - mortem on the results.
L
ITERATURER
EVIEWThe Literature Review will explore the topics outlined in section 1.2. It will discuss emerging green technologies and their introduction into the UK housing stock. The literature review will also discuss past and current handover procedures, and introduce the concept of post-handover monitoring from a viewpoint of sustainability and user behaviour. Energy efficient schemes set forth by the government will be introduced and reviewed. Design, implementation, construction and retrofitting of UK homes will be overviewed. Finally, occupant behaviour and its effect on energy efficiency will be discussed.
2.1 S
COPE2.2 G
OVERNMENT POLICYLegislation, particularly in the United Kingdom, has been a major force in driving forward green innovation and technological advances in construction. Stemming from the Kyoto accords, government policies has led the way to the construction of greener homes across Britain through strategies such as home information pack (HIP), warm front scheme, green deal and energy performance schemes. In addition, addressing the issue of unsuitable and costly housing for low-income earners has been a high priority among several different government departments.
2.2.1 ENERGY EFFICIENCY OF THE RESIDENTIAL BUILDINGS
Changes in UK building regulations have addressed issues such as energy conservation through such policies as requiring a minimum amount of cavity and loft insulation. Between 1930 and the 1990’s, significant reductions in space heating costs were reduced by 70% through energy conservation policies. This reduction in energy costs was spurred on by on-going scientific discussions regarding climate change and energy consumption (Gaterell and McEvoy, 2005).
Securing energy for the future remains at the top of the British agenda. Newly introduced policies and legislation provide measures to ensure that energy usage is managed efficiently to preserve future supplies. Government bodies, stakeholders and occupants must understand how buildings behave and how energy efficient measures influence that behaviour. In order to achieve the desired long-term success in building energy performance, the benefit to energy conservation and impact of the energy efficient measures must be understood from the early design stages (Heeren et al., 2013).
In the 1990’s, when world energy consumption came to the forefront of the public consciousness, Western European countries such as Denmark and Belgium typically used 30% of their total energy consumption on domestic use. In 2006, energy labelling of homes in Denmark became compulsory, causing a debate as to how Danish occupants viewed potential home purchases (Gram-Hanssen et al., 2007). Gram-Hanssen et al. found that energy labels did not control what Danes purchased but did influence how they approached energy efficient home improvements once they acquired the property. While the Danish government labelled a property’s efficiency, the UK government went one-step further by recommending the building of carbon neutral homes in new builds.
From BREEAM and the Home Information Pack through to the Green Deal, the UK government has pursued legislation that would make existing housing stock more energy efficient and encourage the building of zero carbon new homes.
2.2.2 BREEAM
1990, in order to further support UK sustainability initiatives, the then-executive agency Building Research Establishment (BRE) developed this new environmental assessment system in order to appraise and evaluate the efficiency of sustainable construction technology.
Subsequently recognised as the internationally leading environmental assessment for buildings points are awarded through a credit rating system based on the environmental performance of a building. Additionally further aims include the mitigation of the building lifecycle impacts on the environment and enabling buildings to be recognised according to their environmental benefits. Lastly, the assessment aims to provide a credible environmental label for buildings and to stimulate demand for sustainable homes (BREEAM, 2012).
Additionally, strategies are used to reduce carbon emissions and a method for educating the population regarding the importance of living in, or owning, environmentally sustainable buildings and homes. It aims to provide market recognition of buildings with low environmental impact and to ensure that environmental best practice is incorporated in building planning, design, construction and operation. By raising awareness among building users and construction industry members it reduces the life cycle impact on the environment and allowing organisations to demonstrate progress towards corporate environmental objectives (BREEAM, 2012).
or telephone surveys with occupants during the first 3 months of occupation up to a 12-month period, there are requirements for longer periods of support.
The standards can be applied to any type of building – new build, retrofit, commercial, residential, large project or small. It is the accumulation of best practice standards in sustainable design and construction. Minimum standards include: sustainable procurement, responsible construction practices, stakeholder participation, visual comfort, water quality and monitoring, low water consumption, reduction of CO2 emissions, energy monitoring, incorporation of low carbon or zero carbon technologies, responsible materials sourcing, reduction and management of construction and operational waste, and mitigation on any ecological impact. Completed buildings are ranked according to weighted success of those standards, from Outstanding (less than 1% of UK buildings, an innovator) to Pass (top 75%, standard good practice) (BREEAM, 2011).
While BREEAM was originally developed by the government as a means to measure and reward innovation in sustainable building practices, most government programmes have focussed on identifying improvements and incentivising homeowners and builders to install energy efficient appliances and insulation.
2.2.3 HOME INFORMATION PACK AND HOME ENERGY REPORT
reports detailing energy efficient improvement recommendations. The most common recommendations in these reports included the changing of light bulbs to more energy efficient ones, installation of loft and cavity insulation and draught proofing. A survey carried out into the effectiveness of this report indicated that 27.1% of homebuyers and occupants took this advice seriously. At the same time, the low rate of implementation of these recommendations revealed by the same survey indicated that the scheme needed improvement in order to be effective (Parnell et al., 2005). Parnell et al. (2005) concluded that the overall significance of HIP recommendations was unclear to home buyers and thus the report never obtained the envisaged momentum of improving home efficiency. Indeed, it was inferred that only a minority of homeowners were committed to a plan to reduce their carbon footprint and improve home energy efficiency as a result of this programme.
2.2.4 WARM FRONT SCHEME
Introduced in 2000, the Warm Front Scheme was developed by the Department of Energy and Climate Change (DECC) to aid funding and enable dwellings to become more energy efficient. Households who spent 10% or more of their income on fuel in order to sustain a temperature of 21°C were classified as the fuel poverty bracket and eligible for funding. Improvements to properties promoted under this scheme included: the addition of loft and cavity wall insulation, draught proofing, installation of insulating tanks, gas room heaters with thermostatic controls and central heating, as well as the conversion of solid fuel open fires to glass-front fires. Critics of the scheme claimed that funds made available were grossly underspent in vulnerable areas, it was shown that retrofitted properties were warmer, more energy efficient and healthier (Department of Energy & Climate Change, 2012).
In addition to those classified as in fuel poverty, the scheme targeted other vulnerable populations in the UK. It also allowed grants to those with disability aid in order to tackle fuel poverty. Studies carried out by Hong et al. (2006) found that improvement in bedroom and living room temperatures aided the thermal comfort and contentment of occupants. Additionally, Oreszczyn et al. (2006) found that properties with Warm Front Scheme interventions such as heating and insulation improvements had living room temperatures increased by 1.6°C and bedroom temperatures by 2.8°C. Significant improvements in bedroom temperatures indicated that further living space was available at night, encouraging occupants to use these rooms to watch TV, study or relax. Both studies concluded loft space insulation provided the most significant reduction in heat loss under the scheme.
Emission Reduction Target (CERT) integrated reduction in carbon emissions with energy efficient home improvement schemes. The Warm Front Scheme ran until 2013, but was partially superseded in 2008 with the introduction of CERT followed by the Green Deal in 2012.
2.2.5 LONDON PLAN
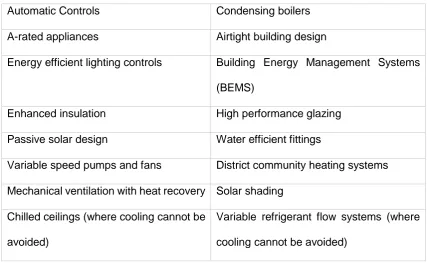
To further support energy efficiency initiatives set out by the government, London was the first city to address carbon emissions, which it did by introducing the London Plan. In 2004, the Mayor of London outlined intentions to cut carbon emissions in the capital by 10% through the introduction of new technologies into building applications. Many London boroughs followed suit and included similar policies within their strategy and development plans. As a result, developers have had a duty at the planning stages to incorporate energy policies that would demonstrate carbon emission reductions in excess of 10%. Developers now have to submit a detailed energy plan demonstrating the benefits of the proposed energy saving technologies through the savings in CO2 emissions (Day et al., 2009). New energy efficient measures proposed by homebuilders is found in table 2.1.
Table 2.1 London Plan Proposed Energy Efficient Measures
Automatic Controls Condensing boilers
A-rated appliances Airtight building design
Energy efficient lighting controls Building Energy Management Systems (BEMS)
Enhanced insulation High performance glazing Passive solar design Water efficient fittings
Variable speed pumps and fans District community heating systems Mechanical ventilation with heat recovery Solar shading
Chilled ceilings (where cooling cannot be avoided)
Variable refrigerant flow systems (where cooling cannot be avoided)
2.2.6 CODE FOR SUSTAINABLE HOMES
The UK government committed to targets set out in the Kyoto accord to reduce greenhouse gases by reducing carbon emissions. Initiatives introduced in December 2006 proposed that all new properties built after 2016 should be built to zero carbon standards, otherwise referred to as carbon neutral (McManus et al., 2010). Known as the Code for Sustainable Homes, the aim of these initiatives is to reduce the amount of embedded carbon, reducing pollution, and increasing energy efficiency in new build homes.
reduction and set out a timeline by which to achieve these levels as shown in Table 2.2.
Table 2.2 - Code for Sustainable Homes Carbon Reduction Schedule
Level Percentage Carbon Reduction Deadline
Level 1 ♦ 10% 2007
Level 2 ♦♦ 18% 2008
Level 3 ♦♦♦ 25% 2010
Level 4 ♦♦♦♦ 44% 2013
Level 5 ♦♦♦♦♦ 100% 2016
Level 6 ♦♦♦♦♦♦ Zero Carbon (including appliances)
Under the new codes, houses are required to be designed and built to the higher environmental standard and measured by the carbon reduction outlined above. In all, nine key areas are monitored, including: energy and CO2 emissions, water, materials, surface water runoff, waste, pollution, health and wellbeing, management and ecology. All newly constructed homes are rated in each of these categories, ensuring that the objective of the designer and constructor is to provide zero carbon properties under the measured criteria. By 2010, the carbon reduction was to be a mandatory 25% (level 3) and raised to 44% (level 4) by 2013. By 2016, all homes must be built to the “zero carbon” (Level 6) level (The Guardian, 2005).
carbon neutral project, contractors and designers need to know what such a project entails and what practical issues arise from these projects.
2.2.6.1 CESSATION FOR THE CODE OF SUSTAINABLE HOMES
In 2014 the government announced plans that the CSH was to be withdrawn by March 2015 and integrated into building regulations where possible, this meant that local authorities could no longer stipulate compliance with code levels. This step down by the government caused much debate amongst professionals and the green building industry; constructors would now only be working closer to code 4 requirements. Critics were worried that the step down would have a detrimental effect on achieving carbon targets set down ‘Under the Climate Change Act’ by 2050. (Ares, 2016).
2.2.7 EUROPEAN REGIONAL DEVELOPMENT FUND
Applicant SMEs are encouraged to support new projects by providing new technologies and using innovative ideas (European Union, 2011). This project was jointly funded between SC and ERDF as discussed in later chapters.
2.2.8 FEED-IN TARIFFS AND RENEWABLE INCENTIVES
Using incentives, the UK government encouraged energy users to produce electricity from renewable sources and sell the surplus back into the UK energy grid. This renewable incentive allows consumers to both reduce their carbon footprint and energy bills. Proposed feed-in tariffs would allow the consumer the opportunity to receive payments for the energy they generated. These tariffs would assist in achieving the government’s own renewable energy targets, set at 15% by 2020 (Couture and Gagnon, 2010).
Feed-in tariffs produce three financial benefits. First, there is a payment for all renewable electricity that is produced, even if it is used by the consumer. Secondly, there is a reduction in electricity bills, as consumers will use most if not all the electricity they generate. Lastly, there is a bonus for any surplus energy exported back onto the grid (Couture and Gagnon, 2010).
Domestic householders would have the added gratuity of not having to pay income tax on earnings generated from renewable electrical production, providing it is for the private use by domestic consumers (Couture and Gagnon, 2010).
2.2.9 STAMP DUTY RELIEF
energy efficiency, the government introduced a stamp duty reduction on zero carbon homes in 2007, providing relief on all homes up to £500,000 until the end of September 2012 (Sayce et al., 2007).
However, government proposals did not make clear what actually constituted a ‘zero carbon’ home. Developed by former Chancellor Gordon Brown, these ambitious plans followed the possibly miscalculated Code for Sustainable Homes, which stated that all homes built after 2016 must be carbon neutral. In introducing the stamp duty relief, Brown defied critics, stating that Britain would be the first country in the world where every newly built property in the following decade would be zero carbon
(UK scraps zero carbon homes plan, 2015).
Unfortunately as discussed earlier, in this chapter the pathway for the Code of Sustainable Homes took a huge U-turn in 2015 changing the direction and reducing the potential to save on CO2.2.2.10 CARBON EMISSION REDUCTION TARGET
Following on from the guidelines put forward by the Kyoto Accord, the government set targets such as the Carbon Emission Reduction Target (CERT) to further reduce carbon emissions by the domestic sector. The Carbon Emission Reduction Target ran from 2008 to 2012, and was developed as a way to both contribute to the government’s on-going fuel poverty strategy and achieve a reduction in carbon emissions generated by the domestic sector.
and benefits included income-related Employment and Support Allowance, income-based Job Seeker’s allowance, income support and state pension credit (Ofgem, 2012).
Suppliers that individually, or within a group of companies under the same ownership, had over 250,000 domestic customers were required to comply with CERT. Under CERT legislation, these energy suppliers were obligated to achieve certain energy targets. These included a carbon emissions reduction of 293 million lifetime tonnes of CO2. Additionally, suppliers were compelled to improve the affordability of a warm home in priority groups through actions such as the replacement or repair of a boiler to make it more energy efficient. Insulation targets were introduced, aiming to save 73.4 lifetime tonnes of CO2 through professionally installed domestic cavity wall and loft insulation (Ofgem, 2012).
As of 2013, CERT was superseded by the Energy Company Obligation (ECO) which has largely the same targets as its predecessor, such as carbon emissions reduction, carbon saving community obligation and home heating cost reduction (Ofgem, 2015).
2.2.11 ENERGY PERFORMANCE CERTIFICATE (EPC)
the highest and most efficient rating. The majority of properties fall into the D and E categories. The type of building, size, orientation, type of heating, window glazing, lighting, amount and type of insulation all influence this rating. Older buildings with single glazing, solid brick walls and limited insulation will underperform and receive a low rating (Watson, 2010).
Information provided allows the occupant to evaluate the energy performance of a building and consider future running costs. In addition, recommendations are provided to the occupants as to how to improve energy efficiency and details possible opportunities to obtain financial assistance from government departments for further energy efficient domestic interventions.
However, in addition, whether or not the rating influences behaviour and approach to energy efficiency or whether occupants understand the significance of a rating system remains to be seen.
The certification is based on a number of assumptions such as standardised heating patterns; number of occupants, hot water usage. These factors may vary between different households because the system is calculated based on standard occupancy rather than how the individual uses the property and the appliances within their homes; such as cooking or electrical products are not accounted for the energy used for heating.
her assessment criteria when addressing the household’s elements such as thermal insulation in dwellings. This is not always possible, as the occupant would not have been notified prior to the visit, which then brings in the case of assumptions.
Unfortunately, this assessment does not take into account the physical condition or quality of the element, but rather the energy efficiency of a dwelling’s performance in part relating to each element such as walls, heating systems and roofs for an approved rating and not the appearance in summary to the extent to which the element contributes to the fuel costs. (Department for Communities and Local Government, 2016)
2.2.12 GREEN DEAL
reduction in use of fossil fuels and high cost suppliers (Department of Energy and Climate Change, 2011).
By signing up for the deal, households were offered the chance to lower their bills by using less energy. For those that qualified, energy providers would provide loans for the installation of new energy efficient technologies. The loans were paid back by occupants, offsetting the lower bills due to energy savings.
From the Warm Front Scheme to the Green Deal, the UK government has provided many incentives for UK homeowners and tenants to retrofit their properties with more energy efficient appliances and energy saving insulation. Through programmes like BREEAM certification, the Home Information Pack, London Plan and Code for Sustainable Homes, constructors and users alike have been encouraged to build or purchase a zero or low carbon home. Despite all of these programmes, it remains to be seen how knowledgeable end users are when it comes to operating these green technologies and buildings. A gap between the expected energy savings and actual saving may be quite significant, should occupants not fully understand the purpose and best methods to use the energy efficient tools at their disposal.
2.2.13 SUMMARY OF GOVERNMENT POLICIES
This section has summarized government policies over the last decade, this has included, incentive schemes, targets, procedures and methods to reduce energy usage along with improving the carbon footprint. Government agencies have worked to address these issues in pursuing a common goal in conserving depleting energy sources, reduce usage and address affordability to the less fortunate. It is evident from this overview that a large number of schemes are available Also, whether the end user fully understands the benefits these may represent and subsequently are not confused by choice or jargon.
2.3 T
HE INFLUENCE OF THE OCCUPANTS’
BEHAVIOUR ON ENERGYEFFICIENCY
Solving energy issues for the environment requires integrated solutions considering not only the building but also the end user. Encouraging occupant’s awareness and participation in the future of a sustainable energy world will involve such things as the use of electricity and gas. Current energy policies will have a lasting impact on human and ecological systems leaving alternative solutions as the only answer (Klein and Coffey, 2016). The market is keen to encourage early adopters the opportunity to pursue new greener technologies, but a balance must be struck between affordability and use ability. What does this mean; the technology must have the capability to be understood by the user with clear concise manuals provided along with one to one support if required for the system to function efficiently. Furthermore, everyone has different priorities in life, behaviour patterns very dependent on the type of occupant, age and social background.
2.3.1 AGE
important issue. Each occupant's needs may vary due to their ability to pay, social upbringing or commitment to green issues. Further predictions show that by 2033 the ratio between the working populations to that of people of a pensionable age will fall from 3.2 to 2.8 per person based on 2008 calculations. (Parliament.uk 2011). Whilst the increase in age is set to rise this will not be seen proportional to good healthy life which will put additional strains on the NHS to support occupants in not only health conditions but in their living environment. Elderly people suffer more from weather conditions especially the cold and this added to their health will also add further demands to their energy usage.
For older people, health is widely known as a barrier towards the ageing process. It was discovered by ‘The Royal Commission on Long-term Care 1999’ that retaining appropriate living conditions within the environment should be considered crucial to maintaining and enhancing independent living and quality of life in particular for the elderly. (Dalley, 2000).
2.3.2 LIFESTYLE
[image:57.595.112.478.303.537.2]Early findings by the Centre of Alternative Technology (CAT) in 2009 supporting energy usage revealed that (figure 2.1) 57% of energy was consumed in domestic households by space heating, 24% by hot water systems, 16% from lighting and 3% by cooking and catering. This confirmed the fact that large proportions of energy are currently being used to provide simple everyday needs such as heating affecting many occupant’s ability to pay, subsequently categorising them into the fuel poverty bracket once 10% or more is used on fuel bills every year.
Figure 2.1 Average Energy Consumption of a domestic building 2009.
(Source; Centre for Alternative Technology (2010, p.88)
However, since 2010 the drive towards more efficient technologies has remained at the forefront of government initiatives. Companies are now developing more efficient combination boilers proving not only an economical heating system but also hot water that is only paid for on demand. More advanced boilers include CHP (Combined Heat and Power), providing not only heat and hot water but electricity as well. The problem is affordability; until the costs are reduced, the
16% 3%
24% 57%
Energy consumption in
domestic buildings
general consumer will not invest. Lighting systems over the last 7 years have changed dramatically; the phasing out of high wattage standard bulbs to energy saving bulbs, LED’s and low voltage systems, have paved the way for consumers to reduce their energy consumption by using these commodities.
What remains to be seen is the lifestyle, the type of occupant and their views on government initiatives along with green issues. The challenges that lay ahead include lifestyle changes when purchasing such things as boilers, double-glazing, insulation and even light bulbs. The question that needs to be asked here is does the payback period off-set the additional cost, will the occupant look for early savings or long-term investment.
As buildings become more energy efficient and automated, the role of occupants becomes more significant to assist buildings to reach their full potential. Bringing forward the behaviour of energy consumptions for the occupant has been identified with building management system operations. The case of individual energy profiles has now more than ever been on the increase, to improve the effectiveness of energy efficiency methods to assess supportive means in order to better predict control for the occupant in the short and long term (Khosrowpour, Gulbinas, and Taylor, 2016).
2.3.3 BEHAVIOUR CHANGE
A study undertaken by the Bio Regional group2012 found that on a pair of semi-detached houses significant reductions in CO2 emissions were obtained when occupants were fully conversant with energy saving measures. (Table 2.3) outlines these benefits and concludes that an overall saving of 12.9% was achieved once a change of habits was implemented. The biggest saving was found to be when the thermostat was turned down; 1 degree produced a saving of 2.7% and by further reducing the temperature 2 degrees this produced an overall energy saving of 5%. Using the tumble drier unnecessarily ranked third with a reduction of 1.8%, this simple exercise demonstrated that it is possible to chang