2017 3rd International Conference on Artificial Intelligence and Industrial Engineering (AIIE 2017) ISBN: 978-1-60595-520-9
Component Implementation of Gis-based IoT Trend
Display and Control System
Rui ZHOU, Bo CHENG
and Shuai ZHAO
Beijing University of Posts and Telecommunications, Beijing 100876, China
Keywords: Componentization, Gis map, Integrated visualization.
Abstract. This article aims to design and implement GIS-based IoT trend display control system. Taking regional protection monitoring as the application scenario, this paper studies how to construct a system by using components and how to use GIS technology to organize the information collected by multiple sensors and visualize the information. It is proposed to build the IoT trend display and control system by using MVC framework based on B-S mode and the componentized web page structure by using React framework based on the MVVM pattern. The system will use API interfaces for JavaScript from the cloud GIS platform and a graphical display technology based on the HTML5 / CSS3 / JavaScript language to achieve visualization.
Introduction
The Internet of Things (IoT) is a network that enables the exchange of information and communications between goods and articles, people and goods, people and people based on the Internet infrastructure. Nowadays the number and variety of sensors used in the Internet of things system with the main functions of monitoring, target identification and tracking, alarm and so on are various. There are radar, sound sensors, ultrasonic sensors, laser range finder and other equipment in the field of national defense, and there are infrared detectors, sound sensors, surveillance cameras and other equipment in the field of home security. Some of these monitoring devices operate independently and some are linked together. Together they comprehensively monitor and analyze the various targets within the scope of monitoring through multi-dimensional and comprehensive measures. In the face of increasingly complex application scenarios and a large number of interrelated monitoring tools, the traditional way of displaying and controlling sensors has been unable to meet people's needs for convenient, intuitive, multi-dimensional and omni-directional observation. In order to better visualize the overall situation, combining Internet of Things technology with GIS technology has become one of the best choices.
Geographic Information System (GIS) is a technology system which is based on the geospatial database, with the support of computer hardware and software, using the theory of systems engineering and information science to scientifically manage and comprehensively analyze the geospatial data with spatial connotation to provide the necessary information for management decision-making[1,2]. Its basic function is to convert tabular data (whether it comes from a database, a spreadsheet file, or directly into a program) into a geo-graphical display and then browse, manipulate, and analyze the display.
System Structure
IoT trend control system using B / S (browser / server) mode to achieve.
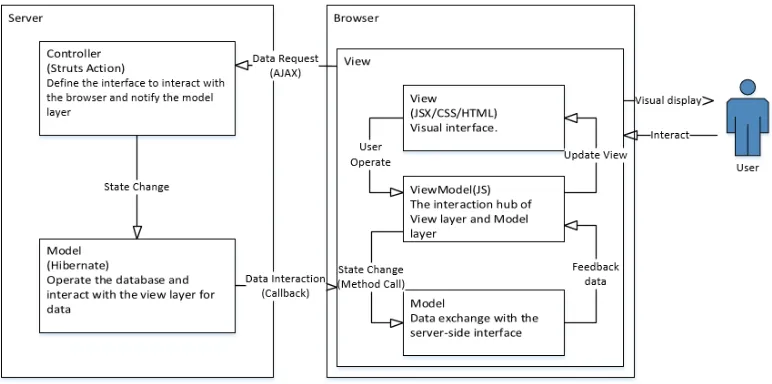
The server of the system refers to the web-based background system of the Internet of Things trend-controlling system. It is built using the Java Web Spring MVC framework and implemented in a pattern separated by the Model View Controller (MVC). Browser side refers to the user interface displayed through the browser, which can be accessed by any authorized user who can access the system network. On the browser side, it's built with the React framework[3] and implemented in a pattern that's separated by the MVVM (Model View ViewModel).
[image:2.612.115.501.288.480.2]System architecture is shown as Figure 1, in which identified the technology and data interchange format applied in the trend Display and Control System. The Modal layer responsible for handling data and the control layer handling front-end interfaces are deployed on the server side. The View layer responsible for visualizing and interacting with the user is deployed on the browser side. The browser-side view layer is divided into Modal layer which is responsible for data interaction with the background, view layer which is responsible for the visualization of graphics and user interaction, and the ViewModal layer which is the information transfer and processing center of Modal layer and View layer.
Figure 1. System B/S-MVC-MVVM Architecture.
Reasons to Build a System in a Componentized Way
The IoT display control system developed by using the native web front-end technology has the disadvantages of fuzzy module division, high coupling ratio, low code reuse rate, and disorderly structure.
First of all, from the developer's point of view, whether it is access to new equipment, or modify the old equipment, development efficiency are greatly dependent on the developer's overall understanding of the system as a whole system and master.
Second, from the perspective of the system requirements side, the demand and application scenarios are increasingly diversified and complicated. The large systems that are highly coupled between parts are not flexible enough to meet scalability requirements.
Figure 2. System component structure.
Design and Implementation of Functional Modules
From the system components diagram can be seen that the system has the following three functions:
(1)GIS map access display and switch functions
The gis map is accessed using the JavaScript APIs provided by supermap[4]. However, formats of
gis map are diverse, and gis map has a large number of projection system. There is also a gap between
resolution and scale between different projection systems. And for security and confidentiality, there
are two types of unbiased and unbiased maps for each map. Therefore, there is also a big difference
between the API of the cloud gis platform used for accessing different maps and the parameters
corresponding to the API. After consulting gis map projection system related knowledge, combined
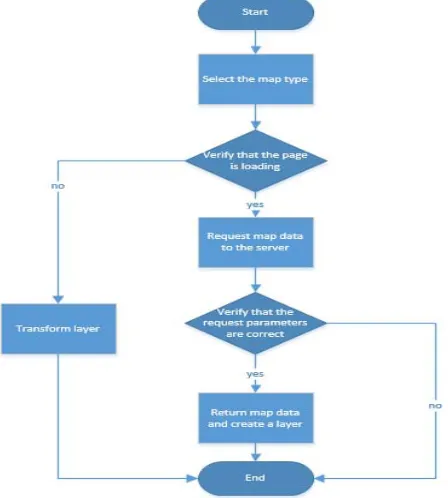
with the supermap map service functions and API interface, as well as access to gis map resources, the system chose to access two wmts service standard gis maps, which are 4326 projection system
and 3857 projection system. Projection system request parameters in Table 1. Two maps can be freely
switched by clicking the button to achieve multi-dimensional monitoring area, the functional flow chart is shown in Figure 3.
[image:3.612.191.415.470.719.2](2)Device display and control functions
[image:4.612.84.531.159.356.2]Device display and control functions are mainly divided into equipment detection data and equipment detection range. Equipment detection data has the target current position data, the target movement track, the target related information and so on. The target trajectory is extracted from the target historical position data by an array, and then the Bezier curve[5] is used to fit the curve array and displayed on the gis map. The actual track effect obtained by the Bezier curve fitting is shown in Figure 4.
Figure 4. Sailing track of the ship.
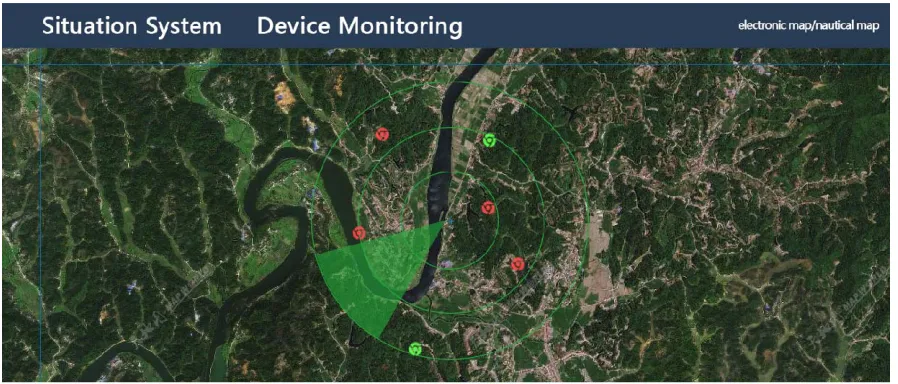
[image:4.612.83.532.421.613.2]Equipment detection range using HTML5 CANVAS technology[6,7]. According to different equipment detection range and detection angle is different, showing different color and size of the circle and fan-shaped scan, the specific effect shown in Figure 5.
Figure 5. Radar detection range
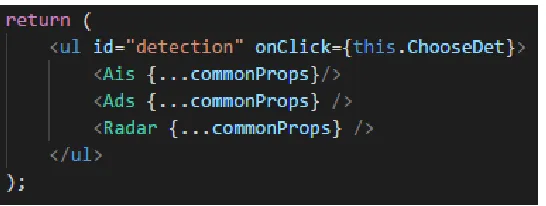
(3)Multi-means comprehensive function
Figure 6. Code of components composition.
Summary
This paper presents a gis-based IOT trend control system implementation. The integrated system is designed and built in a componentized way. It can access a variety of gis maps, can be combined with a variety of detection equipment, as well as having equipment display and control functions. The system is highly scalable and can quickly adjust its detection methods for different application scenarios. It can play an important role in security construction in many areas such as shipping monitoring, campus security and so on.
Acknowledgement
This work is supported by National Natural Science Foundation of China (Grant No.61501048); The Fundamental Research Funds for the Central Universities (Grant No. 2017RC12); National Natural Science Foundation of China (Grant No. 61372115);
References
[1] Jia Ping, Liu Juhai,Wang Yuan. GIS Based on Cloud Computing and Internet of Things [J]. Information Forum, 2012 ,6.
[2] Kang-tsung Chang Introduction to Geographic Information Systems (7th Edition. McGraw-Hill Higher Education, 2014.
[3] Information on https://github.com/facebook/react/ [4] Information on https://github.com/SuperMap/iClient9
[5] Information on http://blog.csdn.net/shenziheng1/article/details/54410816 [6] CSS3 Transitions[EB/OL]. http://www.w3.org/TR/css3-transitions, 2013.
[7] Grady M. Functional Programming Using Javascript And The Html5 Canvas Element [J]. Journal of Computing Sciences in Colleges, 2010, 26: 97-105.