2017 2nd International Conference on Communications, Information Management and Network Security (CIMNS 2017) ISBN: 978-1-60595-498-1
Design and Implementation of Campus Information
Analysis System Based on Spark
Xiao-zheng WANG, Xiao-xiao WEI, Sheng-tao WANG and Tian-tian XIE
Nanjing Xiaozhuang University, Jiangning, Nanjing, China
Keywords: Data mining, Spark, Django, Data visualization.
Abstract. In order to mine the data of "campus card" system, a campus information analysis system based on Spark is designed. The front end of the system is developed using the Django framework. The front end of the system is developed using the Django framework, and the data processing uses the Spark distributed framework, and the results of the analysis by way of chart visual feedback to the user, so as to realize data preprocessing, data analysis, data presentation and other functions.
Introduction
"Campus card" system as an important part of the construction of digital campus, has been popular in major universities. But these storage data do not cause the attention of the majority of managers, most users only concerned about the function of the system, and generated data of the management with not enough attention, there is no analysis of these data implied information. Most of the student management systems used in Colleges and universities do not have the data analysis function of students' campus activities, and so far there is no relatively mature scheme for the analysis of student campus activities. We use data mining technology to mining the campus data generated in the process of using “campus card" system, and using the algorithm of clustering analysis to get the deep information of data, so as to provide more convenient and perfect digital service for school management.
Requirement Analysis
Now, the smart phone has become an essential tool in people's lives, and it has become possible to use the browser anytime and anywhere. Therefore, we use web development technology, using matpiltlib and plotly tools to realize data visualization, the core data analysis module using scala language development, and is based on Spark distributed cluster technology[1,2]. The system implements the following functions:
(1) User management. The system provides the functions of user login, registration and cancellation, in order to protect user data, that is, student privacy. Not logged in, users can only view the home page. For landing users, the system can display the results of data analysis and provide other operational functions.
(2) File upload function. Users provide data files that need to be analyzed and uploaded in Excel or CSV format, the file must contain the fields required by the system.
(3) Data preprocessing function. The function includes data cleaning, integration, transformation, selection, specification and other operation steps. The system filters the redundant data in the file provided by the user, including the required fields, and to form a new data set.
(4) Data analysis function. The processed data is imported into the Spark cluster, and then the correlation analysis and clustering analysis are performed.
System Design
The system is divided into three modules: data processing module (core), data visualization module and web presentation module. The Web presentation module interacts directly with the user, and the user can perform a series of operations through the web page.
Data Processing
Data processing module mainly implements data preprocessing, data analysis and integration of analysis results. This part uses spark cluster for data processing. Because spark is based on memory processing, its biggest advantage is fast to deal with large-capacity data[3]. The received data is stored in the distributed file system (HDFS), submit applications through spark-submit, spark will create and construct a Driver process, the SparkContext initialization, master and worker will respectively schedule node resource and task and execute defined the operators and functions until all operations executed so far. Finally, the processed data is stored on the HDFS[4].
Data visualization
The visualization module mainly completes the standardization, visualization, concrete and aesthetic appearance of the conclusion data obtained after the early excavation, and makes a visual secondary analysis for some of the intermediate data with large data volume.
After the user requests the data analysis result, the corresponding data or data file is found in the preliminary result database or file system analyzed by the core analysis framework, and the visual processing program corresponding to each module protocol is called automatically. As the system uses the matplotlib library and plotly library to realize the window and the web side of the visual processing developed by the python language. So the system uses the Django framework based on python language as web development framework, and the visualization module in accordance with the initial protocol is encapsulated into image rendering module, and make the call process to achieve a seamless integration. The encapsulated visual processing program obtains the data and then judges the data form or the data file form and transforms it into the data that can be drawn, the request handler can even render the form by parameter setting control. The user can not only get the static picture file, but also get the dynamic, real-time and operational multidimensional data to draw the image, so that the user can make a detailed observation and analysis.
Web Presentation
The Web presentation module is responsible for interacting with the user. Users first need to register and log in to use the main functions of the system, otherwise they can only browse some introductory information. Logged-in users can upload the file and be able to view the data analysis results.
System Features
(1) Using web as the presentation environment, so that users can view the results at any time. (2) Using spark cluster architecture to analyze data, you can directly store the results in memory, thus eliminating the I/O operation of the disk, making the system more efficient.
(3) Using data visualization tools, Matplotlib library and plotly library, large-scale data will be displayed in the form of charts, which is convenient for users to visually analyze and analyze the results.
Key Technology Implementation in Distributed Data Analysis
One of the needs of data analysis is to find the closeness between students based on the time dependency of student consumption records. This demand needs to count the number of students consumption by any two students within a certain interval of time, and finally sums up the number of times that any two students consumption at the same time interval in a year. Because the amount of computation involved in this requirement is huge, all data are stored using open source HDFS and distributed computing framework spark is used for data analysis. Apache Spark is a fast, general purpose computing engine designed for large-scale data processing. Spark is UC Berkeley AMP Lab (University of California at Berkeley AMP laboratory) open source class Hadoop MapReduce universal parallel framework, Spark has the advantages of Hadoop MapReduce. But it is different from MapReduce; the job intermediate results can be stored in the memory, thereby eliminating the need to read and write HDFS, so Spark is better to apply to data mining and machine learning iterative MapReduce algorithm.
Through the comparison of a variety of computing schemes, the final choice of the solution is that the first step in data preprocessing to generate key (date of consumption - consumption area code), value (time consumption, account code) pairs, then through the Cartesian product operation to generate a new key value, and then through the value of the value of the time comparison and statistical summary, so as to obtain the number of simultaneous consumption of a year between the two students in a certain period of time. Finally, the intimacy between these students is obtained by clustering. The data set used in this system is a total of 18 million records of all students in one year, and is calculated by the cluster of six server machines. Among them, each server memory is 32G, the time interval selection is 5 minutes and 10 minutes in two cases, each calculation takes 25 minutes or so. The key code for data processing is as follows:
val dfConsume = sc.textFile("hdfs://master:9000/input/ttnsmflwing-200000.txt").map(_.split(",")) .map(p => Consume(p(0), p(1), p(2),p(3),p(4), p(5), p(6),p(7),p(8),p(9),p(10),p(12), p(13))).toDF()
//Data format (account code \ consumption area code \ consumption time)
val df1=dfConsume.select("FLW_ACCID", "FLW_AREID", "FLW_CONTIME") where ("FLW_AREID='01' OR FLW_AREID='03' OR FLW_AREID='05'")
//Generate key-value pairs, where key (consumption date - consumption area code), value (consumption time, account code)
val myrdd = df1.rdd.map(p =>(p(2).toString.split("")(0)+"-"+p(1).toString ,((sdf.parse(p(2).toString).getTime/60000).toInt,p(0))))
//According to the consumption date, the consumption area and the consumption time are sorted in order
val myrdd1=myrdd.sortBy(f=>(f._1,f._2._1))
val rdd2=myrdd1.join(myrdd1).filter(f=>f._2._1._2 !=f._2._2._2) .filter(f=>f._2._1._2.toString.toInt < f._2._2._2.toString.toInt) .filter(f=>(f._2._1._1-f._2._2._1<=5))
var rdd3=rdd2.map(x=>(x._2._1._2+"-"+x._2._2._2,1)) var rdd4=rdd3.sortByKey()
var rdd5=rdd4.reduceByKey(_+_)
Figure 1. RDD data set conversion flow chart.
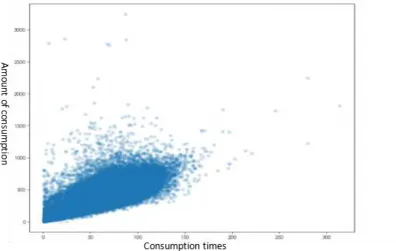
Analysis Results of the Part Data
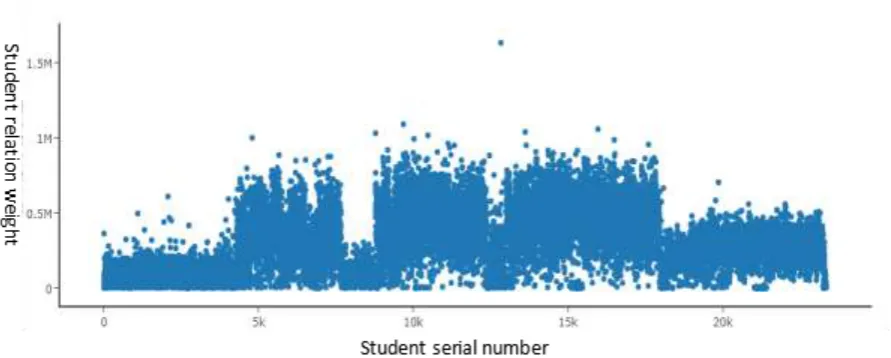
[image:4.595.107.504.412.663.2]Figure 3. Student relation weight diagram.
Conclusion
In the current era, the results of large-scale data analysis (such as large-scale research results) have played an important role in decision-making. The purpose of this system is to mining the huge data stored on campus ,so as to reuse the data which has been neglected for a long time.
Acknowledgements
This work was financially supported by Key Laboratory of Trusted Cloud Computing and Big Data Analysis (Nanjing XiaoZhuang University), Jiangsu Engineering Research Center for Networking of Elementary Education Resources (BM2013123).
References
[1] Tathagata Das, Haoyuan Li, Timothy hunter, Scott Shenker, Ion Stoica(2013). Discretized Streams: Fault-Tolerant Streaming Computation at Scala. 2013 November, SOSP .
[2] Information from https://cwiki.apache.org/confluence/display/SPARK/Powerd+By+Spark
[3] Information on http://spark.apache.org/mllib/