M anagement
Fabian G aravito
Ph.D. Thesis
Department of Finance
All rights reserved
INFORMATION TO ALL USERS
The quality of this reproduction is dependent upon the quality of the copy submitted.
In the unlikely event that the author did not send a complete manuscript and there are missing pages, these will be noted. Also, if material had to be removed,
a note will indicate the deletion.
Dissertation Publishing
UMI U613441
Published by ProQuest LLC 2014. Copyright in the Dissertation held by the Author. Microform Edition © ProQuest LLC.
All rights reserved. This work is protected against unauthorized copying under Title 17, United States Code.
ProQuest LLC
789 East Eisenhower Parkway P.O. Box 1346
1.1 Sum m ary Statistics: Inform ation V a r i a b l e s ... 43
1.2 Inform ation Score Returns - R e g r e ss io n s... 44
1.3 Sum m ary Statistics: Hierarchy V a ria b les... 45
1.4 Hierarchy Score R eturns - R e g r e s s io n s ... 46
1.5 D eterm inants of Inform ation Score ... 47
1.6 D eterm inants of Inform ation Score - N ew F u n d s ...48
1.7 Trading strategy: Value-W eighted M onthly R egressions 49 1.8 Trading strategy: Abnorm al Portfolio T ilts M onthly R e g r e s s io n s ... 50
1.9 Trading strategy: Overlapping holdings R egressions . . . 51
1.10 Trading strategy: Hard Inform ation C o m p a n ie s ...52
1.11 Fund-by-fund Self-financing trading s t r a t e g y ... 53
1.12 C ross-sectional R e g r e s s io n s ... 54
2.1 Sum m ary S t a t i s t i c s ... 85
2.2 Investm ent O bjectives ...86
2.3 Average A lpha and Factor Loadings for N ew Funds . . . 87
2.4 R eturn D ecile Regression ... 88
2.5 Characteristics o f Stocks Held by N ew M utual Funds . . 89
2.6 Stock Picking A bility o f N ew Funds ... 90
2.7 Fund Family C h a ra cteristics...91
2.8 Fund Flow R e g r e s s io n s ... 92
3.1 Sum m ary Statistics - Investm ent Styles ... 112
3.2 Sum m ary Statistics - M utual F u n d s ... 113 3.3 Sum m ary Statistics - N ew Funds’ Investm ent Styles . . 114 3.4 C onstruction of the Investm ent Style B ook to Market
R a t i o ... 115 3.5 D eterm inants of N um ber o f Funds’ IP O ’s - Poisson Re
gressions ... 116 3.6 E volution of Funds’ Average Book to M arket R atios
2.1 Average D ecile R eturn for Incubated F u n d s ... 83 2.2 Fund Flows and T N A ...84 3.1 N ew Funds vs S&P 500 M arket-to-Book R a t i o ...I l l
1 Organizational Diseconom ies in the M utual Fund Industry 12
1.1 In tro d u c tio n ...12
1.2 Theory and Hypothesis C o n s tru c tio n ...16
1.2.1 Soft and Hard In fo rm a tio n ...16
1.2.2 Hypotheses c o n s tru c tio n ...17
1.3 D ataset Construction and M ethodology... 18
1.3.1 Information variables and score c o n s tru c tio n ... 18
1.3.2 M utual Fund Variables and Hierarchy S c o r e ... 20
1.3.3 D a t a ...21
1.3.4 Summary S ta tis tic s ... 23
1.4 R e s u lts ... 25
1.4.1 Determinants of information s c o re ... 25
1.4.2 Difference in the ability to collect and use soft and hard in fo r m a tio n ...28
1.4.3 Fund-by-fund trading s tr a te g y ...33
1.4.4 Cross-sectional re g re ssio n s... 35
1.5 C onclusion...37
1.6 R eferen ces...39
2 M utual Fund Incubation: Innovation or M arketing Tool? 55 2.1 In tro d u c tio n ... 55
2.2 D a t a ... 61
2.3 R e s u lts ... 62
2.3.1 Descriptive S ta tis tic s ...62
2.3.2 Fund Incubation and Fund Families’ Incentives ... 63
2.3.3 Investment Strategies and Fund In c u b a tio n ... 65
2.3.4 Fund F l o w s ... 73
2.4 C onclusion... 76
2.5 R eferen ces... 79
3 A Catering Explanation of M utual Fund IPO s 93 3.1 In tro d u c tio n ... 93
3.2 D a t a ... 96
3.3 R e s u lts ...99
3.3.1 Determinants of the Number of Fund I P O s ... 99
3.3.2 Evolution of m utual funds’ book-to-market ratios after I P O ...101
3.3.3 New Funds’ Risk-Adjusted R e t u r n s ... 102
3.3.4 New Funds’ Expected F lo w s ... 103
3.3.5 Effect of Fund IPOs on Investment Style Fund Flows . .105 3.4 C onclusion... 106
I certify th a t the thesis I have presented for examination for the Ph.D.
degree of the London School of Economics and Political Science is solely my
own work other than where I have clearly indicated th a t it is the work of others
(in which case the extent of any work carried out jointly by me and any other
person is clearly identified in it).
The copyright of this thesis rests with the author. Quotation from it is
perm itted, provided th a t full acknowledgement is made. This thesis may not
be reproduced without the prior w ritten consent of the author.
I warrant th a t this authorization does not, to the best of my belief, infringe
My thesis explores issues concerned with delegated asset management and
their implications for asset prices. The first chapter of my thesis documents
how the organizational form of a m utual fund affects its investment strategies.
I show th a t decentralized funds allocate a greater portion of their capital to
soft (opaque) information companies than centralized funds. Consistent with
the inability of centralized organizations to handle soft information, I find th at
decentralized funds are better at investing in soft information companies than
hierarchical funds. Furthermore, I find th a t high levels of ownership by decen
tralized funds predict high future returns for soft information companies. The
second chapter shows th a t while fund families may use m utual fund incuba
tion (the creation and management of a fund before it is offered to the public)
in an opportunistic fashion, they also seem to use it to foster innovation. I
document th a t fund families tend to launch their incubated funds when their
past performance is high, consistent with a behaviour th a t aims to exploit the
convex relationship between past performance and current flows. However, I
also show th at, after their Initial Public Offerings (IP O ’s), incubated funds
tend to hold more illiquid stocks, hold more concentrated portfolios, invest in
less-popular securities and are better at purchasing stocks th an non-incubated
funds. This difference in investment strategies is due to the incubation period
as it allows managers to explore different corners of the m arket without having
th at, despite their outstanding pre-IPO track records, incubated funds attra ct
a smaller share of new-fund capital flows than non-incubated funds. The third
chapter (joint work with Dr. Mungo Wilson) shows th a t m utual fund families
cater to investors’ demand by offering funds with investment styles th a t are in
vogue. I also show th at this catering exacerbates the ’’dumb money” effect. In
other words, fund IPOs have a positive effect on the persistence of investment
I would like to thank my supervisors Christopher Polk and Michela Verardo
for all their help and time throughout my studies. Their guidance, advice and
help were instrumental during my PhD. I am specially grateful to the Financial
Service Authority (U.K.) for providing funding during my PhD studies through
the FSA PhD Scholarship in Economics and Financial Regulation. I would also
like to thank my colleagues and friends Miguel Anton and Vincent Fardeau for
their friendship, help and time spent in endless conversations about research,
academia and football.
I would also like to thank my family for their unbounded love, encour
agement and unconditional support. Without Laura and Sofia’s love, smiles,
support, patience and encouragement, I would have been unable to finish my
PhD. I would also like to thank my parents and my brother for their love and
support. Despite the distance, they have always been with me every step of
the way. Special thanks to my aunt Leonor and my uncle Alonso who have
always believed in me and who have been source of inspiration and pride.
Lastly, I would like to thank Antoine Faure-Grimaud. Antoine gave me
the opportunity to join the programme and went out of his way to help me
every time I needed a helping hand. Besides my profound admiration for his
research work, I was deeply touched by his dedication to all students. He
was very generous with his time despite his very tight agenda and multiple
responsibilities and was very caring and helpful with all his students. He
made a huge impact in my life and I will always be grateful for those long
talks, his advise, his good sense humour, and his guidance. Merci Antoine.
O rganizational D isecon om ies in
th e M u tu al Fund In d u stry
1.1
Introduction
Information collection is a central part of investing. As suggested by several
economists, the collection of information can ameliorate the adverse selection
problem faced by investors1. Moreover, it has been argued th a t the collection
of information may be influenced by organizational structure. For instance,
it has been documented th a t decentralized organizations are better suited at
processing soft information (i.e. information th a t is not quantitative in na
ture and th a t is difficult to summarize in a numeric score), since this type of
information can not be transferable within a hierarchy. On the other hand,
standardization and economies of scale make centralized organizations more
efficient at producing and processing hard information (information th a t is
quantitative in nature). The main objective of this paper is to study the ef
fect of organizational structure on information collection and investing in the
m utual fund industry.
1Stiglitz and Weiss (1980) show that asymmetric information may explain why capital does not flow to firms with positive net present value projects. Lelan and Pyle (1977), Campbell and Kracaw (1980), Diamond (1984), Haubrich (1989) Diamond (1991) describe how large institutional creditors can partially overcome the problem of adverse selection by producing information about firms and using it in their credit decisions.
Stein (2002) models the effect of organizational design (centralized vs de
centralized structures) on the collection of information in firms where division
managers compete for internal funds to finance their projects. In a centralized
organization, where research and capital allocation are carried out by different
agents, division managers (research) will know th a t the only information a
CEO will use in allocating capital across divisions is information th a t can be
credibly tran sm itt able. This type of information, also known in the literature
as hard information, is quantitative and objective in nature (i.e. sales growth
rate of a company over the past 5 years. This, in turn, means th a t any effort
exerted in collecting information th a t can not be credibly transm itt able, or
soft information (information th at can not be easily agreed upon, i.e. honesty
of a CEO), will go to waste. Division managers will know this ex-ante and will
re-direct all their efforts to collect hard information. Furthermore, competition
amongst division managers for limited internal funds will lead them to collect
as much hard information as possible on their investment projects. This will,
in turn, translate into the production of vast amounts of hard information. On
the other hand, in a decentralized organization, research and capital allocation
will be conducted by the same agent (division managers collect information on
projects and decide how to allocate capital). In this case, division managers
have the incentive to collect as much (hard and soft) information as possible
on their investment prospects in order to minimize the adverse selection prob
lem. Stein shows th a t if all information about investment projects is hard,
centralized organizations have an advantage over decentralized firms in their
ability to distribute capital across divisions within the organization. On the
other hand, if all information available about investment opportunities is soft,
decentralized organizations will have superior fund allocation across projects
than centralized firms due to their ability to collect and use soft information.
My findings are consistent with Stein’s model. I document th a t the level of
centralization of a m utual fund’s organizational structure positively covaries
with the degree with which a fund invests in hard information companies
the organizational structure changes from decentralized to centralized, so do
the incentives to collect hard over soft information. This explains the larger
portfolio tilt of centralized funds towards hard information companies. I also
exploit the difference in the ability to collect and use soft and hard infor
mation of two different organizational forms (decentralized and centralized)
by constructing buy-and-hold self-financing trading strategies th a t yield posi
tive risk-adjusted returns. For instance, a self-financing buy-and-hold trading
strategy th a t buys a basket of soft information stocks held by decentralized
funds and short-sells a basket of soft information stocks held by centralized
funds every quarter, produces risk-adjusted returns between 49 and 64 bps per
m onth (6% and 7.95% per year respectively). Moreover, consistent with the
hypothesis th a t decentralized organizations have a unique ability to collect and
use soft information, I illustrate th a t high levels of ownership by decentralized
funds predict high future returns for soft information companies. For instance
a one standard deviation in the intensity of investment by decentralized funds
in a soft information stock, predicts an additional future return of 17 bps per
month.
The distinction between soft and hard information has been studied before
in the banking literature, with particular emphasis on the incorporation of soft
and hard information in different lending technologies (i.e. credit scoring, re
lationship lending) by different organizational forms (large vs. small banks)2.
One of the main conclusions in this strand of the literature is th a t large banks
tend to be at a disadvantage when lending to small businesses. The reason
given is th a t large banks are very centralized and small businesses tend to be
informationally opaque (they mostly produce soft information). The disad
vantage emerges from the fact th a t centralized organizations are ill-suited to
use soft information 3. However, Berger Rosen and Udell (2007) argue th a t
2 For a more detailed discussion on the subject see the papers surveyed in Berger Rosen and Udell (2007).
past empirical research in this area is inconclusive since some variables of in
terest were not considered. Therefore the evidence in the banking literature
on the effects of organizational form on the collection and usage of information
is mixed.
Actively managed US equity m utual funds provide an ideal environment
to analyze the effects of organizational diseconomies in information collection
and capital allocation for several reasons. Firstly, investing is a task th a t is
information intensive. Secondly, due to disclosure requirements, it is possible
to measure fund organizational characteristics, and the information opaqueness
(hard vs. soft information) of funds’ holdings. In this paper, I construct
information and organizational complexity scores to measure the softness of
the information generated by stocks and the degree of centralization of m utual
funds.
Chen et al (2004) look at the issue of organizational diseconomies in the
delegated asset management industry. They examine a particular cross-section
of the data, September 1997, and find th a t small and solo-managed funds are
more likely to invest in and are better at choosing local stocks (companies
whose headquarters are geographically close to the fund’s main offices) th an
large and non-solo managed funds. They present this evidence as an indica
tion th a t decentralized funds are better at collecting and using soft informa
tion companies. However, they do not look at the other implications of Stein
(2002), namely whether centralized funds tilt their portfolios to hard informa
tion stocks. Moreover, their measure of organizational complexity overlooks
the effect of fund families in the way member funds operate. For instance,
Gaspar Massa and Matos (2006) and Cici Gibson and Moussawi (2006), doc
ument th a t fund families have the incentives and mechanisms to influence the
capital allocation of its member funds. This creates the kind of separation
between research and decision making found in centralized organizations. In
a concurrent project, Massa and Zhang (2009) study how the organizational
structure of an asset management company affects its strategies and perfor
funds, the authors show th a t more hierarchical structures invest less in firms
located close to them and deliver lower performance.
The paper is organized as follows. Section 2 describes the hypotheses. Sec
tion 3 describes the data, section 4 presents the results and section 5 concludes.
1.2
T heory and H yp othesis C onstruction
1.2.1 Soft and Hard Inform ation
Petersen (2004) presents a detailed characterization of hard and soft infor
mation in finance. Hard Information is the kind of information th a t can be
easily reduced to numbers. Examples of hard information in finance are fi
nancial statem ents, credit history, and stock returns. On the other hand, one
can think of soft information as information th a t can not be completely sum
marized in a numeric score. Examples of soft information in finance can be
opinions and rumours. Due to its quantitative nature, hard information can
be easily collected, stored and transm itted (these characteristics also make it
difficult to contain). A second dimension used by Petersen to characterize in
formation is the way in which it is collected. The collection of hard information
need not be personal. Therefore, the collection process can be at arms length,
autom ated and standardized. However, it places restrictions on w hat can be
collected. W ith soft information, the context under which it is collected and
the collector of the information are part of the information itself. For instance,
if I say th a t the manager of a firm has great business acumen, the information
depends on my definition of business acumen. One of the advantages of hard
information is th a t it can lower production costs through standardization and
autom atization. Hard information is easy to store as the information does
not depend on who collected it. This means th a t the information remains in
an organization even if the agent who collected it leaves the firm. However,
collection of hard information also leads to a loss of information which in some
contexts can be quite im portant (i.e. venture capital, where most of the infor
difficult to contain can keep managers from fully collecting informational rents
(i.e. in the case of equity investing, it reduces the ability an investor has to
earn abnormal returns).4
1.2.2
H y p o th eses construction
Motivated by Stein (2002), I conjecture th a t the organizational form of a mu
tual fund affects managers’ incentives to collect information. This should be
reflected in the kind of stocks th a t managers pick and in their ability to choose
stocks with different degrees of information ” softness” .
Hypothesis 1. The level of mutual fund centralization should positively co-vary with the tendency to hold a greater proportion of hard information com panies.
Hypothesis 1 follows from the fact th a t incentives to collect information are
affected by organizational form. As stated before, fund managers th a t operate
in centralized funds (where research and decision making are conducted by
different agents), know th at they will not be able to credibly transm it soft
information. Ex-ante, they decide to steer their efforts towards collecting more
hard information. Therefore, as the organizational structure becomes more
hierarchical, funds increase the share of resources allocated to hard information
stocks.
Hypothesis 2. Decentralized (centralized) funds are better than centralized (decentralized) funds at investing in soft (hard) information companies.
If decentralized funds are better suited than centralized funds at collecting
and using soft information, they should have a superior ability to invest in
soft information stocks than centralized funds. On the other hand, centralized
funds should be better than decentralized funds at investing in hard infor
m ation companies since they are better at gathering and incorporating hard
information.
Hypothesis 3. Decentralized fu n d s’ ownership of soft information stocks should forecast these stocks ’ future returns
Since decentralized funds are able to collect and incorporate soft informa
tion in their investment decisions, high decentralized funds’ ownership in soft
information stocks should forecast higher expected returns since high owner
ship should reflect the collection of positive information on a stock.
1.3
D a ta set C onstruction and M eth od ology
1.3.1
Inform ation variables and score con stru ction
The information score I construct aims at measuring the information ’’softness”
of a firm and the extent to which information about a company has been
hardened. The score is based on four variables. The first two variables, market
capitalization (SIZE) and age (AGE), measure the information softness of a
firm. These variables have been previously used in the banking literature and
the main idea is th a t information available about older and larger firms tends to
be harder than information generated by younger and smaller companies. The
other two variables, number of analyst forecasts (NUM EST) and institutional
ownership (OWN), measure the extent to which information about a company
has been hardened. The basic premise is th a t these two variables measure the
level of due diligence on a company. For instance, it is plausible to think th a t
there is more hard information about a company followed by 50 analysts than
by a company without analysts’ coverage.
1.3.1.1 Inform ation Score
The construction of the information score for each stock is based on the rank
ing of its information variables. To try and purge the size effect from the other
information variables (all other variables are highly correlated with size), I
re-spect to size. I conduct this orthogonalization by regressing age, institutional
ownership and number of estimates on size, similar to Hong et al (2000) and
Nagel (2005). The orthogonalized values of these variables are the error term
of these regressions. Since institutional ownership is bounded between 0 and
1, it is necessary to transform the variable so th a t it maps to the real line. I
perform the following logit transformation,
( O W N \
L o g it(O W N )= l o g ( T- ^ ) (1.1)
where the values below 0.0001 and above 0.9999 are replaced with 0.0001
and 0.9999 respectively. The information variable residuals are calculated by
regressing the information variables on Log Size and squared Log size. On
average, across all quarters, I find the following relations:
Logit(O W N) = —7.31 4- 1.68 Logsize — 0.09 Logsize2 + e (1.2)
N U M E ST = 2.13 — 1.90Logsize -1- OASLogsize2 + e (1.3)
Log A G E = 4.44 — 0.25Logsize + 0.035Logsize2 + e (1.4)
The basic procedure to calculate the information score is as follows. Each
quarter, I take the universe of NYSE stocks and rank them in 20 groups by size
and residual age. I use the NYSE size and residual age rank cut-off points to
rank stocks held by m utual funds. I also rank stocks held by m utual funds in
20 groups by residual institutional ownership and residual number of analysts’
estimates. For each stock, I then calculate an aggregate information variable
by summing up the ranks of the four variables for each stock. For instance,
if a stock belongs to size group 1, residual age group 2, residual institutional
ownership group 2 and residual number of analyst estimates group 10, the
aggregate information variable equals 15. Next, I group these stocks by this
aggregate information variable in deciles. The information score will be equal
1.3.2
M u tu al Fund Variables and H ierarchy Score
The main objective of the hierarchy score is to measure the organizational com
plexity of a fund. As mentioned earlier, there are two dimensions to consider,
the centralization of tasks within the fund and the organizational complexity
of the fund family to which the fund belongs. To measure the level of orga
nizational complexity within the fund, I use is the number of managers th at
control the asset allocation (NUM MGRS) and net assets under management
(AUM). As far as number of mangers, the premise is th a t funds with many
managers will tend to be team-managed. This, in turn, causes managers to
decide on an asset allocation based on consensus by sharing, and thus transfer
ring, information with other agents. Regarding net assets under management,
the main idea is th a t larger organizations are more hierarchical, since large
organizations tend to centralize activities. This variable has also been used in
Chen et al (2004) to measure the organizational complexity of m utual funds.
The third and fourth variables I use are the number of funds (NUM FUNDS)
and the total assets under management in actively managed US equity funds
(FAM SIZE) of the family a fund belongs to. These variables are motivated by
papers in fund cross-subsidization and fund proliferation (Massa (2003) and
Gaspar Massa Matos (2006)). The idea is th a t maximizing fee income at the
family level is different from maximizing fee income at the fund level. This will
lead families to cross-subsidize funds th a t are the most likely to benefit from
the convex relationship between past performance and current net flows docu
mented in Chevalier and Ellison (1997) and Sirri and Tufano (1998). Families
will also try to enhance the performance of funds th a t maximize the positive
spill over effect th a t a top-performing fund has on the its member funds’ net
flows (Nanda et al (2004)). Therefore fund families have incentives to cross-
subsidize fund returns in other to maximize their own income fee. As such, it
is reasonable to believe th a t the asset allocation of a fund will be influenced by
its family. This creates the separation between research and fund allocation
1.3.2.1 Hierarchy Score
As indicated above, the variables Number of Funds, Family Size and AUM are
highly and positively correlated. Therefore a hierarchy score based on the raw
values of the hierarchy variables would not provide much extra information.
For instance ranking funds by AUM would produce a very similar ranking if
funds are ranked by Family size. I therefore, orthogonalize the number of funds
with respect to AUM. I also orthogonalize Family Size w ith respect to AUM
and Number of Funds. On average, across all quarters, I find the following
relations:
L o g N U M F U N D S = 1.64 + Q.QULogA UM + QMZLogA UM2 + e (1.5)
L o g F A M S I Z E = 2.04 + OAOLogAUM + OMQALogAUM2
+1.81LogNUMFUNDS - 0.03ALogNUMFunds2 + e
Each quarter, I rank funds by AUM, residual number family funds, and
residual family size in quintiles. I calculate an aggregate hierarchy variable by
summing up these rankings and the number of managers (which takes values
from one to five). For instance, if a fund belongs to AUM group 1, residual
number of funds group 2, residual family size group 2 and it has 3 managers,
the aggregate hierarchy variable equals 8. Each quarter, I rank funds by this
aggregate hierarchy variable in deciles. The hierarchy score will be equal to
its aggregate hierarchy variable decile.
1.3.3
D a ta
I construct my sample of US actively managed equity funds in four steps
using the CRSP Survivor-Bias Free U.S. M utual Fund D atabase (fund char
acteristics) and from the Thompson Financial M utual Fund D atabase (fund
Free U.S. M utual Fund Database. Secondly, we eliminate funds (FUNDNO’S)
th a t have reporting gaps of more than 12 months from the Thompson Finan
cial M utual Fund Database (S13)5. Thirdly, we exclude funds th a t on average
do not hold at least 80% of NYSE-AMEX-NASDAQ common stocks from the
Thompson Financial M utual Fund Database (S13). Lastly, we merge these two
datasets by using the MFLINKS provided by WRDS. The number of shares
own by a fund on a particular issue are corrected and expressed as of the date
of disclosure6.
D ata on stock returns and prices are from the Center for Research in Se
curity Prices (CRSP) Monthly Stocks File for NYSE, Amex, and NASDAQ
stocks. I eliminate closed-end funds, real estate investment trusts (REIT),
American Depository Receipts (ADR), foreign companies, primes, and scores.
I exclude stocks below the 20th NYSE size percentile from the tests th a t look
at stocks returns due to the well-documented asset-pricing anomalies in small
stocks (Griffin and Lemmon (2002)). Market capitalization is defined as the
product between share price and shares outstanding. Age is defined as the
number of months th a t a security is present in the CRSP Monthly File. D ata
on institutional holdings are obtained from the Thomson Financial Institu
tional Holdings (13F) database. I extract quarterly holdings from the first
quarter of 1993 to the last quarter of 2006. I calculate the share of institu
tional ownership by summing the stock holdings of all reporting institutions
for each stock in each quarter. Stocks th a t are on CRSP, but without any
reported institutional holdings, are assumed to have zero institutional owner
ship7. The number of analysts’ estimates is calculated using I /B /E /S . At the
end of a company’s fiscal year, I count the maximum number of one-year EPS
5 These funds are suspect as Thompson usually recycles unique fund identifiers. See WRDS User’s Guide to Thomson Reuters Mutual Fund and Investment Company Common Stock Holdings Databases (July 2008)
6Portfolio holdings are collected every quarter (vintages). If a fund has not disclosed holdings (because it was late or because it was not supposed to), the data provider fills in ’’missing quarters” by carrying forward the holdings of the prior quarter adjusting for a range of corporate events (i.e. Stock splits). For more information, see Wermers (1999) and Gompers and Metrick (2001)
estimates th a t were outstanding during the fiscal year in question. NUM EST
is the maximum number of one-year EPS estimates in the most recent fiscal
year.
As stock return predictors, I use book-to-market (B/M ), firm-level volatility
(VOL), and turnover (TURN). The book value of equity in the nominator of
B /M is taken from the Compustat Database, and it is defined as in Daniel
and Titm an (2006). At the end of each quarter t, we calculate B /M as the
book value of equity from the most recent fiscal year-end th a t is preceding
quarter-end t by at least six months divided by the m arket value of equity at
the end of quarter t. Consistent with Fama and French (1993), I exclude firms
with negative book values. Returns on stocks are obtained from CRSP and are
corrected for delisting biases as suggested by Shumway (1997) and Shumway
and W arther (1999)
Organizational characteristics of m utual funds are taken from the CRSP
Survivor-Bias-Free US M utual Fund Database. I identify all share classes
issued by a m utual fund using the MFLINKS provided by WRDS and calculate
the m utual fund characteristics at the fund level, not a t the share class level.
The sample starts in the first quarter of 1993 and ends in the last quarter of
2006. I calculate the number of managers by counting the different names in
the database’s manager field. The funds in my sample have a maximum of 5
names in the database manager filed. However, for some funds, the manager
field is set to ’’Team Managed” . If this is the case, I set the variable ’’number
of managers” equal to five. Assets under management equals the total TNA
of the fund’s share classes. The number of actively managed US equity funds
per family is calculated at the end of each quarter. The family size variable is
the sum of all actively managed US equity funds’ TNA offered by a family.
1.3.4
Sum m ary S tatistics
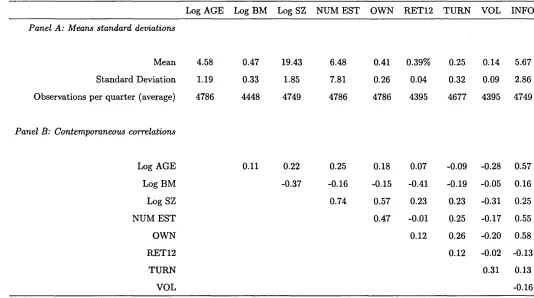
Table 1.1 presents some summary statistics on the variables used to construct
the information score (Size, Age, Number of Analyst Estim ates and Institu
tors book-to-market (B/M , its natural logarithm), firm-level volatility (VOL),
and turnover (TURN). All statistics are calculated cross-sectionally each quar
ter and are then averaged across time. These statistics are calculated for stocks
held by m utual funds. A few points a noteworthy. First, it is im portant to
note the strong positive correlation between size and all other information vari
ables. This is the reason why purging the size effect from the other information
variables is im portant when constructing the score. Otherwise the information
score would only capture variation in market capitalization of stocks in my
sample. The information score (INFO) positively correlates with all the infor
m ation variables as expected. The information score also covaries negatively
with past volatility (VOL), and performance (RET12), and positively with
liquidity (TURN) and book-to-market ratio (Log BM). In order to better un
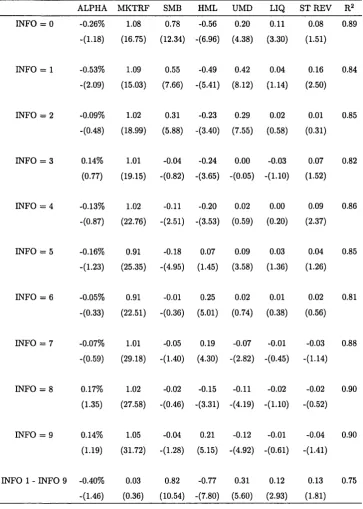
derstand the information score, I also analyze the returns of each of its deciles.
Table 1.2 describes the risk-adjusted excess returns of value weighted portfolios
of stocks in each information score group and their loadings on a set of factors.
We can see th a t the main facts from the correlation structure in Table 1.1 are
reflected in this table as well. For instance, we can see th a t the portfolio of
stocks with information score equal to zero (INFO = 0) load more on SMB
(smaller companies), UMD (momentum stocks) LIQ (Illiquid stocks) and ST
REV (short-term reversal stocks) and less on HML (high book-to-market com
panies) th an stocks in the information score equal to nine (INFO = 9). There
also seems to be a negative difference between the risk-adjusted excess returns
of the stocks in the bottom and top deciles of the information score, albeit the
statistical significance is not very high.
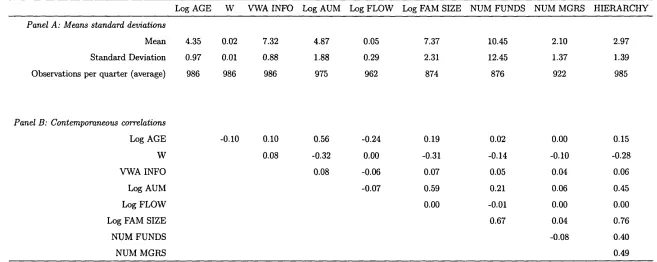
Table 1.3 presents some summary statistics on the variables used to con
struct the hierarchy score and on other m utual fund variables of interest. We
can see th a t the number of managers is not highly correlated with any other
hierarchy variable. However, NUM FUNDS, AUM and Log FAM SIZE are
highly correlated. The hierarchy score covaries positively w ith all hierarchy
variables and with the value-weighted information score of each fund. This
m ation companies. It is also im portant to note th a t the correlation between
the hierarchy score (HIERARCHY) and a concentration measure (W) is neg
ative. In other words, centralized funds tend to be less concentrated th at
decentralized funds. The hierarchy score also covaries positively with fund age
which indicates th a t young funds tend to be less hierarchical. In order top
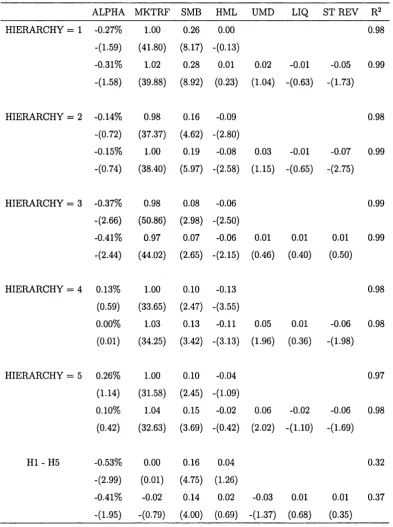
better understand the hierarchy score, I analyze the return characteristics of
each hierarchy quintile. Table 1.4 describes the risk-adjusted excess returns of
AUM-weighted portfolios of funds in each hierarchy score quintile. There is
a negative difference between the risk-adjusted excess returns of the portfolio
of funds in the bottom and top quintile of the hierarchy score distribution.
Moreover, the excess return of decentralized funds (HIERARCHY = 1) seems
to load more on the SMB factor than centralized funds (HIERARCHY = 5).
Other than th at, the returns of the bottom and top quintiles of the hierarchy
score seem to load very similarly on other factors.
1.4
R esu lts
1.4.1 D eterm in an ts o f inform ation score
My first hypothesis indicates th at centralized m utual funds will allocate a
greater share of their resources to hard information companies. In order to
determine whether centralized funds tend to invest in the higher spectrum of
the information score, I calculate the value-weighted average information score
of all holdings in a fund’s portfolio. This measures the extent to which funds
are allocated to information companies in the top of the information score
distribution.
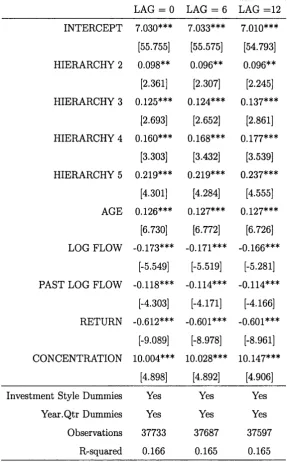
Table 1.5 regresses the value weighted average information score on dum
mies for each hierarchy score quintile and on control variables. I control for
(self-reported) investment styles and time heterogeneity by adding investment
style and tim e dummies. Furthermore, net flows can also have an impact in the
value-weighted average information score. For instance, if a fund experiences
investment styles may not allow the fund to hold cash reserves above a certain
threshold. As pointed out in Pollet and Wilson (2006) and Lou (2009), funds
tend to scale their holdings asymmetrically depending upon whether they ex
perience inflows or redemptions. Therefore, net flows should affect portfolio
holdings of existing positions and thus the value weighted average information
score. I also control for current quarterly returns and portfolio concentration
(average portfolio weight). The first column regresses the average information
score on the hierarchy dummies based on the contemporaneous hierarchy score
(LAG=0). We can see th a t as a fund increases its organizational complexity,
the information score increases monotonically. For instance, the difference be
tween the average information score of funds with hierarchy score equal to one
(decentralized fund) and funds with hierarchy score equal to five (centralized
fund) is 0.219 or 3.3% of the sample average. The effect is also statistically
significant.
One of the potential problems of this specification is the difficulty to es
tablish causality. Hypothesis 1 indicates th a t the degree of centralization of
a fund (hierarchy score) should have an effect on the type of stocks held in
its portfolio (i.e. soft vs hard information stocks). However the tests above
do not rule out th a t the effect is the other way around, i.e. the average infor
mation ’’softness” of stocks held in a m utual fund portfolio has an effect on
a fund’s organizational complexity. For instance, one could argue th a t funds
decide to concentrate in a sub-set of stocks (i.e. soft information companies)
and then decide on a hierarchy structure. This seems unlikely for two reasons.
Firstly, the tests are motivated by a theory based on the incentives to collect
information provided by different organizational structures. In other words,
theory supports the causal relationship between organizational structure and
information collection explored here. Secondly, fund families cater to investors’
demand by supplying funds with investment styles th a t are in vogue (Garavito
and Wilson (2009)). This catering takes places regardless of the information
score of an investment style. However, to partially address these concerns, I
based on past hierarchy score. The results are shown in the second (LAG = 6
Months) and third (LAG = 12 months) columns. The results are very similar
to those in the first specification.
1.4.1.1 R obustness - N ew Funds Inform ation Score
An alternative way to explore the robustness of the results above is to look at
organizational variables and future information scores of funds th a t have been
launched during the sample. This test clearly identifies the effect we want to
study since, prior to the launch of a fund, no investments are made (i.e. no
information score) but an organizational structure is put in place (i.e. number
of managers running the fund) or inherited (i.e. number of funds in the family).
These allows us to better identify the effect of organizational structure in a
sub-sample of newly launched m utual funds.
To this end, I regress the information score of newly launched funds twelve
months after their IP O ’s on two organizational variables 8. These organi
zational variables are the number of investment managers running the fund
(NUM MGRS, fund level variable), and the number of equity funds in the
fund’s family (LOG FUNDS, family level variable) just before their IPO. Fur
ther I add controls which are measured concurrently with the information score
(12 months after fund’s IPO). I do not include the hierarchy score due to data
restrictions on the organizational structure of funds at the tim e of their IPO.
Moreover, the size of newly launched funds is small and hence, the hierarchy
score of these funds will tend to be very similar. The results are found in Table
1.6. As we can see both variables, positively covary with future observations of
information score. In other words, the more hierarchical a fund is at inception,
the more it will tend to allocate capital to stocks in the higher spectrum of the
information score. These results corroborate the findings of Table 1.5.
1.4.2
D ifference in th e ab ility to collect and use soft and
hard inform ation
1.4.2.1 Value-weighted trading strategy
Hypothesis 2 states th a t decentralized (centralized) funds should better at
investing in soft (hard) information stocks than centralized (decentralized)
funds. In order to test this hypothesis, I construct a self-financing trading
strategy th a t exploits the difference in ability of decentralized and centralized
funds to collect and use soft and hard information. In order to test the in
sights of Stein’s model, I define soft information stocks as those th a t belong
to the bottom decile of the information score distribution (i.e. information
score distribution = 1). Stocks th a t are in the top decile of the distribution
(information score = 10) are labelled as ’’hard information stocks” . I apply
a similar strategy with the organizational complexity of funds. Funds in the
bottom quintile of the hierarchy score (hierarchy score = 1) are called decen
tralized funds and funds in the top quintile of the distribution (hierarchy score
= 5) are called centralized funds. From the cross-section of stocks held by
m utual funds, I identify the set of soft information stocks held by centralized
and decentralized m utual funds respectively. The first self-financing trading
strategy takes a long position in a portfolio made of soft information compa
nies held by decentralized funds at each quarter-end date. This purchase is
financed by short selling a portfolio composed of soft information stocks held
by centralized funds. The portfolio weights of each portfolio trade (long and
short portfolios) are proportional to the market capitalization of each stock.
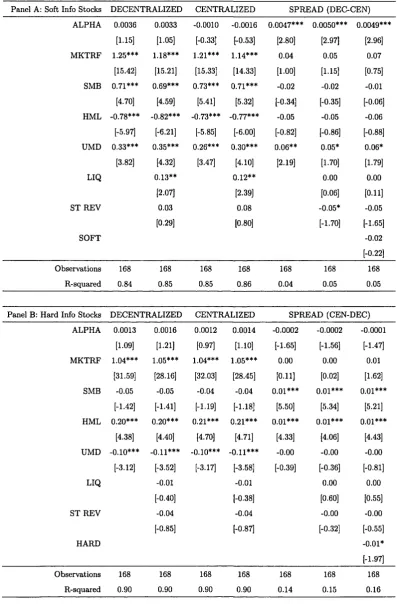
The return of this self-financing trading strategy is measured every month and
rebalanced every quarter. The results are summarized in Table 1.7. Panel A
shows the returns on this trading strategy and on its long and short portfolio
trades. The risk-adjusted excess return for the long side of the trade is positive
and for the short side is negative with low levels of statistical significance. The
return on the strategy is positive and economically significance (49 bps per
nal to passive benchmarks (factors) th a t carry positive premia. I also include
a soft-information factor, which tracks the excess return of a value-weighted
portfolio of the soft information stocks held by m utual funds (SOFT). This
ensures th a t the trading strategy is neutral with respect to the information
score. These results show th a t there is a positive difference in the ability to
collect and use soft information between decentralized and centralized funds.
Similarly, I implement a self-financing trading strategy th a t aims at ex
ploiting the better provision of incentives to collect hard information th at
centralized funds offer. As before, the trading strategy consists of buying a
value-weighted portfolio of hard information stocks held by centralized funds
financed by short-selling a value-weighted portfolio hard information compa
nies held by decentralized funds. I keep track of the m onthly returns of the
self-financing trading strategy, and I rebalance it every quarter. Panel B shows
the results for the second trading strategy. As one can see, the strategy deliv
ers returns th a t are very small and not statistically different from zero. The
failure to find a positive alpha, and hence a positive difference in collecting
and using hard information between these two organizational forms, can be
due to several reasons. Firstly, hard information can be easily purchased. If
outsourcing the production of hard information is cheaper th an collecting it,
then decentralized and centralized funds are likely to purchase the same infor
mation. In this case, there won’t be any difference in the ability to generate
hard information and, hence, a trading strategy as the one proposed above,
would yield zero expected returns. Secondly, since hard information is easy to
transm it, it is also difficult to contain. This feature reduces the likelihood th at
managers earn positive risk-adjusted returns by collecting hard information
since, once a piece of information has been harden, it can be transm itted out
side the fund (i.e. through employee turnover, communication with research
1.4.2.2 Investm ent-intensity trading strategy
The degree by which a fund loads on a holding should indicate the fund’s
managers beliefs about the holding’s future performance. For example, if a
manager strongly believes th a t IBM stock returns will be high, the manager
will overweight this security in its portfolio. Likewise, if a manager is not very
confident about the future performance of a long position, it is likely th a t the
manager will underweight it. Therefore, a more direct test of relative perfor
mance of centralized and decentralized funds is to incorporate this information
in the trading strategy. Consequently, I redefine the portfolio weights of the
trading strategies to reflect the aggregate beliefs of managers in each orga
nizational structure. The new weights are based on the average ’’investment
intensity” th a t each organizational structure assigns to each stock. In the spirit
of Cohen Polk and Silli (2010), I define the ’’investment intensity” of a fund on
a holding, as the ratio between the fund’s portfolio weight of th a t holding and
the fund’s average portfolio weight. A large and positive ratio indicates th at
the fund is very confident about the positive future performance of the hold
ing. In contrast, a small ratio indicates th a t the fund’s management team is
not as bullish on a position. I calculate the aum-weighted average ’’investment
intensity” for all the soft and hard information stocks held by decentralized
and centralized funds respectively. I then normalize the average ’’investment
intensity” of all the holdings in each of the trading strategies’ long and short
portfolios. I used the normalized aum-weighted ’’investment intensity” as the
new portfolio weights. For instance, suppose th a t there are only two decentral
ized funds (A and B) with three and four million dollars of AUM respectively.
Further, assume th a t funds A and B both invest in soft information companies
C and D with investment intensity on C of 2 and 0.5 and investment intensity
on D of 0.2 and 0.4 respectively. Therefore, the long portfolio trade of the soft
information strategy would invest 0.78% and 0.22% of each dollar in stocks C
and D respectively9.
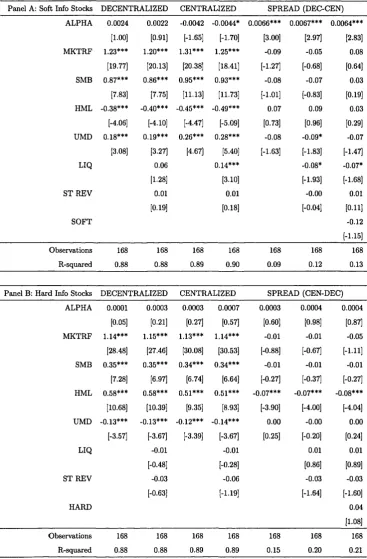
Panel A of Table 1.8 presents the return of the trading strategy based on
soft information stocks and its long and short side. The risk-adjusted excess
return for the long and short side of the trade are positive and negative re
spectively. Compared to the previous table, the statistical and economical
significance of the short side is larger. This shows the inability of centralized
funds to deal with soft information. For the long side of the trade, the alpha is
positive but the statistical significance is not strong. The risk-adjusted return
on the strategy is positive and economically significance (64 bps per m onth or
7.95% per year). This provides further evidence th a t there is a positive dif
ference in the ability to collect and use soft information of two organizational
forms. Panel B, shows the trading strategy based on hard information com
panies. The results are very similar to those of Table 1.7. The risk-adjusted
return of the trading strategy is very close to zero.
1.4.2.3 Investm ent-intensity trading strategy: Overlap holdings only
A better test to check whether there is a difference in the ability of using
and collecting information of different organizational structures is to run the
trading strategy above using holdings th a t overlap in both sides of the strategy.
This will compare how different organizational structures invest in the same
(hard or soft information) companies. If there is a difference as measured by
the risk-adjusted return of the strategy, it will indicate th a t one organization
structure is better th a t the other one in collecting and using a particular kind of
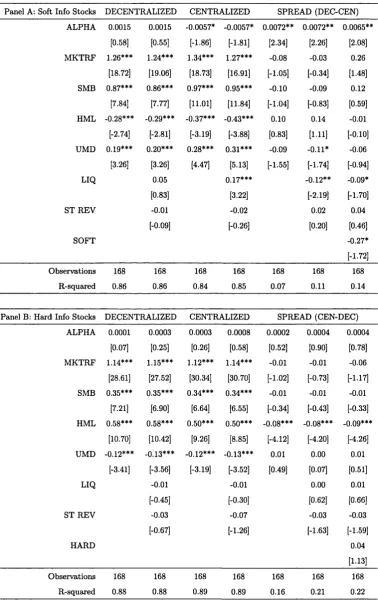
information (hard or soft information). The results are presented in Table 1.9.
Each portfolio trade has the same holdings but their portfolio weights depend
on the average intensity of investment as defined in the previous sub-section.
Panel A presents the results for the strategy th a t employs soft information
companies only. The results are very similar to those from Table 1.8. We
can see th a t the strategy delivers positive risk-adjusted returns of up to 72
bps per m onth (9% per year). We observe th a t the main contributor to this
return is the short side of the trade (portfolio of soft information companies
held by centralised funds), as the risk-adjusted return of this portfolio trade
is -57 bps per m onth (-7 % per year). The strategy does not load significantly in any of the risk factors and has a low R2. Panel B shows the results for the
strategy based on hard information companies. As before, we see a positive
difference between centralized and decentralized funds when investing in hard
information companies, albeit, the difference is very small and not statistically
significant. This test shows th a t the results presented in Table 1.8 are not due
to a few non-overlapping holdings, or the number of holdings in each portfolio
trade.
1.4.2.4 Hard inform ation trading strategies: A b ility to purchase hard inform ation and benchmarking needs
As stated before, if outsourcing the production of hard information is cheaper
than its collection, then decentralized and centralized funds are likely to sub
contract its collection. If this is the case, it is then likely th a t both types of
funds get exposed to the same set of information. Hence, it would be expected
to observe th a t centralized and decentralized funds held a large number of hard
information companies in common. Outsourcing the collection of information
can therefore diminish the competitive advantage th a t hierarchical organiza
tions have in collecting hard information. This would explain why the alpha
in the trading strategy for hard information companies, while positive, is very
close to zero. Another reason may be th a t hard information companies are
held for non-alpha generating reasons. For instance, suppose th a t funds invest
part of their capital to track a benchmark (i.e. S&P 500). If hard information
companies tend to be constituents of a widely held index, then it is natu
ral to expect th a t the trading strategy proposed above for hard information
companies, will measure the ability to collect and use hard information and
benchmark tracking activities of some organizational forms. To address this
two points, I modify the portfolio trades in Table 1.8. In order to see whether
highly researched companies are driving the results in the hard information
culating the median of the residual of number of analysts’ estimates for each
portfolio trade in the hard information strategy of Table 1.8. Next, I eliminate
the holdings th a t are above their respective median from each portfolio trade
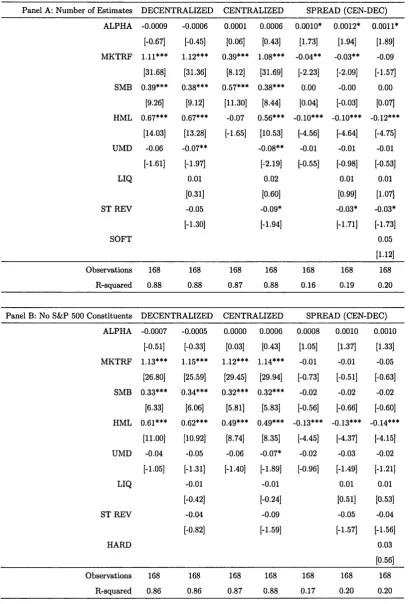
and run the same strategy as in Table 1.8. The results are summarized in
Panel A of Table 1.10. The alpha of the short side of the trade (DECEN
TRALIZED) is negative. This is in contrasts to previous tables, where the
alpha was positive. The alpha of the spread is positive (12 bps per month
or 1.5% annual) and statistically significant. This shows th a t if the strategy
concentrates in hard information companies in the lower range of analyst cov
erage the strategy delivers positive risk-adjusted returns. This supports the
idea th a t the outsourcing of information collection will affect the result of the
strategy for hard information companies because it diminishes the advantage
th a t centralized funds have. The other possible refinement to the strategy is by
eliminating stocks th a t may be bought to track a benchmark such as a widely
held index. I do this by eliminating S&P 500 constituents from each portfolio
trade in the hard information strategy. Panel B of Table 1.10 presents the
results. Similar to Panel A, the short side of the trade presents a negative
risk-adjusted excess return. The spread of the strategy is positive and larger
th a t in previous tables. In general, the results from this table explain why
the hard information strategies from previous tables were not yielding positive
alphas. Once refinements to control for outsourcing of information and bench
marking, the risk-adjusted return of the hard information strategy (SPREAD)
turns positive with im portant levels of statistical significance. The evidence in
this table suggests th a t centralized organizations are better at collecting hard
information th an decentralized funds.
1.4.3 Fund-by-fund trading strategy
One of th e objections to the trading strategies implemented above could be
th a t they do not control for investment style. For instance, if decentralized
funds tend to be growth funds and growth companies tend to be soft infor
th a t growth funds tend to be better at picking growth stocks. To address this
concern, I implement a strategy based on holdings at the fund level. For de
centralized and centralized funds (hierarchy score equal to one and five respec
tively), I re-calculate a fund-specific information score by ranking the stocks
in a funds portfolio by the aggregate information variable calculated in sec
tion 1.3.1.1. I then group these stocks in four groups where the first and
fourth groups have the stocks with the lowest and highest aggregate informa
tion score respectively (I exclude stocks below the 20th NYSE size percentile).
I form a trading strategy for each fund by going long a value-weighted port
folio of companies in the fourth quartile of the fund-specific information score
(’’hard information” stocks) and short-selling a a value-weighted portfolio of
companies in the first quartile of the fund-specific information score (’’soft in
formation” companies). Every month, I aggregate the trading strategies by
averaging the returns for the universe of decentralized and centralized funds
respectively. For every month, I calculate the difference between the average
return of the centralized fund trading strategies and the average return of the
decentralized fund trading strategies. I rebalance the fund-specific strategies
at the end of each quarter. In other to rule out funds th a t only invest in hard
or soft information companies (top and bottom deciles of the cross-sectional
information score), I exclude funds th a t do not hold at least a% of companies th a t are below the median of the cross-sectional information score.
This implementation controls for investment style since the trading strat
egy is based on the holdings of individual funds as opposed to the holdings of
all funds of a particular organizational structure (i.e. goes long growth stocks,
short-sells growth stocks). Since the trading strategy buys portfolios of ’’hard”
information companies and short-sells portfolios of ’’soft” information compa
nies, it is sensible to expect th at the trading strategy for centralized funds
yields positive returns whereas the strategy for decentralized funds delivers
negative returns. Therefore the difference between both strategies (centralized
minus decentralized) should be, on average, positive. To test this conjecture,
factors th a t track the excess returns of all soft information companies (INFOl)
and hard information companies (INFO 10) . This ensures th a t the ALPHA of
the difference is neutral with respect to the information scores. The results in
Table 1.11 confirm my conjecture. Each panel in Table 1.11 presents the re
sults for different levels of alpha. We can see th a t the difference between these
strategies ranges from 0.18 % a month (2.18% year) to 0.37% a month (4.53%
per year). This provides evidence th at, at the fund level, centralized funds do
much better on their ” harder” information positions while decentralized funds
do better on the their ’’softer” information holdings.
1.4.4
C ross-sectional regressions
Hypothesis 3 conjectures th a t decentralized funds are able to forecast future
returns of soft information companies. In other words, since these funds are
able to collect and incorporate soft information in their asset allocation pro
cess, their aggreagte actions should predict the average future returns of soft
information companies. For instance, if the m ajority of decentralized funds
overweights a particular soft information stock, it should be because the man
agers of these funds obtained positive (soft information) signals about the
future performance of the stock. Therefore, I argue th a t the average ’’in
vestment intensity” of decentralized funds should forecast the returns of soft
information companies. In other words, high average intensity of investment
of decentralised funds should forecast high future expected returns for soft
information stocks.
To explore whether ownership of soft and hard information stocks by cen
tralized and decentralized funds predicts the cross-section of stock returns,
Table 1.12 presents a series of pooled regressions of returns of stocks held by
m utual funds (I exclude stocks below the 20th NYSE size percentile). The
sample goes from April 1993 to March 2007. The dependent variable is stock
returns measured from the end of month t to the end of m onth t+ 3 . These
returns are regressed on stock characteristics measured at the end of month
tal individual stock return over the previous 12 months (RET12), the monthly
trading volume scaled by the number of shares outstanding averaged across the
previous three months (TURN), the standard deviation of monthly individual
stock returns over the previous 12 months (VOL). I also include the aum-
weighted intensity of investment for all hierarchy quintiles and dummies for all
information deciles. Because some of the regressors do not have well-behaved
distributions, I use their natural logarithm (INTENSITY, B/M , TURN). To
control for tim e heterogeneity, I add time dummies and cluster standard errors
by time across firms.
In the first column of Table 1.12 (Model 1), future returns are regressed
on four predictors (B/M , RET12, TURN, and VOL). The results show the
predictive power of these regressors and confirm previous findings in the lit
erature. Model 2 adds dummies for all deciles of the information score. The
average returns of stocks increases as their information score increases. For
instance, we see th a t the average quarterly return of soft information compa
nies (bottom decile of the information score distribution) is lower than th a t of
hard information companies (top decile of information score). This is consis
tent with the findings in Table 1.2. Model 3 shows how future average returns
covary with the aum-weighted investment intensity from different quintiles of
the hierarchy score. We observe th at, on average, ownership by centralized
organizations tends to be negatively correlated with future returns. Model 4
shows a very similar picture when both, investment score dummies and aum-
weighted investment intensities are added. Model 5 interacts the dummies
for the lowest (SOFT) and highest (HARD) information score deciles with the
aum-weighted investment intensities of decentralized (INTENSITY1) and cen
tralized (INTENSITY5) funds. The interaction terms indicate the marginal
effect of ownership by decentralized and centralized funds on the future return
of soft and hard information companies. Of the four interaction terms, the only
one th a t is economically and statistically significant is the one th a t measures
the marginal effect of decentralized funds’ ownership on the average future
a one standard deviation shock to INTENSITY!., leads to a marginal effect on
the average future return of soft information stocks of 50 bps per quarter (2%
per year). This provides evidence in favour of Hypothesis 3.
1.5
C onclusion
Loosely relying on Stein (2002), I test the effect of organizational structure on
the collection and usage of information in a sample of actively managed US
equity funds. I also develop scores th a t measure the information ’’softness”
of stocks and the organizational complexity of m utual funds. I find th a t the
level of organizational complexity of a fund