2017 3rd International Conference on Computer Science and Mechanical Automation (CSMA 2017) ISBN: 978-1-60595-506-3
Optimization of Adsorption of Aromatic Amino Acid by
Response Surface Methodology
Na-Xin SUN
1, Chun-Jiang YE
1, Yue-Hui LIU
1and Yuan-Xiu WANG
1*1
School of Biological Science and Technology, University of Jinan, Jinan 250022, China
[email protected]; [email protected]; [email protected]; [email protected]
Keywords: Aromatic amino acid, Adsorption, Corn gluten meal.
Abstract. To produce oligopeptides with high Fisher ratio from the corn gluten meal, the optimal conditions were investigated to absorb aromatic amino acids in the form of free amino acids or peptides in the hydrolysate of corn protein. Response surface methodology was applied to optimize the adsorption conditions, including concentration of NaOH, the concentration of activated carbon and reaction temperature. The highest adsorption rate (50.40%) was obtained at concentration of NaOH at 5.53%, temperature at 24.56°C, concentration of activated carbon at 0.10g/mL, which was in agreement with the predicted value (51.41%) estimated by response surface methodology within a 95% confidence interval. In addition, the final adsorption solution was analyzed by using high performance liquid chromatography to evaluate the kinds and amounts of amino acids in it. The result revealed that Phe was 30.00 mg/100mL, Tyr was 20.98 mg/100mL,and Trp was 4.93 mg/100mL, and the content of aromatic amino acids accounted for 91.82% of the total amino acids. These results support that the aromatic amino acids could be effectively absorbed by the activated carbon under the appropriate conditions, which would contribute to a lot in the process of preparation of high Fischer ratio oligopeptides from corn gluten meal.
Introduction
Corn Gluten Meal (CGM), a by-product of the corn processing industry, may represent a valuable protein source for human nutrition owing to its richness in protein (65% on a dry basis). However, it is usually used as the fodder additive because of its insolubility and undesirable flavor. Therefore, the development of processing techniques to turn this low-value byproduct into a food source or medical diet is of great economical interest. At present, the preparation of oligopeptides or free amino acids through enzymatic hydrolysis is an area of growing interest, and there have been many reports on the various profitable effects of the hydrolysates prepared from GCM(1). In particular, Sami reported that CGM has a relatively higher level of branched-chain amino acids (BCAAs) and a lower level of aromatic amino acids (AAAs) than wheat gluten meal(2), thus the oligopeptides with high Fisher ratio (a molar ratio of BCAA and AAA) might be expected to obtain from the hydrolysates of CGM.
papa in at one-step to produce short peptides as well as release the AAAs (unpublished data). As the AAAs still remained in the form of either peptides or free amino acids, the separation method of AAAs on activated carbon has been investigated in this study. This research was aimed at investigating the optimal adsorption condition of activated carbon for free AAAs evaluated by response surface methodology, and the levels of each AAA in the desorption solution, as well as the recovery for AAAs, was analyzed using high performance liquid chromatography (HPLC).
Materials
CGM was kindly supplied by Luzhou Group of China.Protex6L and papa in were purchased from Genencor Int. The activities of these enzymes were 17748U/mL, 60904U/mL and 75441U/g, respectively. Other chemicals were analytical grade.
The Preparation of high Fischer Value Oligopeptide
All hydrolysis reactions were performed in 100 ml Erlenmeyer flasks, containing 3 g of GCM samples with Glycine- NaOH buffer of 1:2 (W/V). Reactions were carried out in triplicate in a thermostatically controlled water bath, a pH electrode, a mixer shaft for addition of alkali. Enzymes were added and temperature was controlled during hydrolysis reaction and pH was monitored by pH stat method using automatic Mettler DL 25 titration unit(8). Hydrolysis was continued with alkaline protease and papa in for 120 min, after which reaction was stopped by heating up to 90 °C for 5 min. Samples were cooled and then centrifuged at 16000 g for 10 min at 4 °C. The supernatants were collected and used for the further absorption experiments.
The Desorption Using Activated Carbon
Some 60 mesh activated charcoals were added to the hydrolysate at the room temperature for some time under continuous stirring. The desorption rate is defined as the ratio (expressed as %) between the number of protein content desorbed and the total number of protein content absorbed by activated carbon. The protein content was measured by kjeldahl method.
Box-Benhnken Test Design
To optimize adsorption conditions, the adsorption rate was considered as the response variable and three reaction parameters were optimized using response surface methodology (RSM)(9). The one-factor-at-a-time method (OFAT) experiments were conducted first to choose the most critical factors and their reasonable ranges. The range and center point values of three independent variables presented in Table 1. The Concentration of NaOH (A), Temperature (B) and Concentration of activated carbon (g/mL)(C) were chosen for independent variables, and the results of the effect of each variable on the response and model evaluation are presented in Table 2. Experimental runs were randomized to minimize the effects of unexpected variability in the observed responses. The effect of each independent variable was eventually examined on the surface of this response. The model proposed for the response is presented in Equation 1:
i i j i ij i j
i ii i i i i
e
X
X
b
X
b
X
b
b
y
=
+
∑
+
∑
+
∑ ∑
+
= = + = = 2 1 3 1 3 1 2 3 1
0 (1)
Table 1. Factors and levels in the RSM experimental design.
Name Factor Level
-1 0 1
Concentration of NaOH/(%) A 1.00 5.00 9.00 Temperature/(°C) B 20.00 25.00 30.00
Table 2. Experimental design in RSM studies by using three independent variables showing observed adsorption rate.
Run A Factors B C Response/(%)
1 9.00 25 0.05 46.64
2 5.00 30 0.15 55.36
3 9.00 20 0.10 36.1
4 5.00 30 0.05 26.47
5 5.00 25 0.10 31.06
6 5.00 20 0.05 49.11
7 5.00 25 0.10 24.07
8 1.00 25 0.05 32.09
9 1.00 30 0.10 24.07
10 9.00 25 0.15 22.32
11 5.00 25 0.10 27.77
12 9.00 30 0.10 15.16
13 5.00 25 0.10 56.33
14 5.00 20 0.15 24.67
15 1.00 25 0.15 48.14
16 5.00 25 0.10 22.32
17 1.00 20 0.10 26.47
Analysis of the Adsorption Solution
The adsorption solution was analyzed by high performance liquid chromatography, and the concentration of the three kinds of AAAs was evaluated. The samples were diluted in ultrapure water and centrifuged at 12000 rpm for 10 min to retain the supernatant. The HPLC conditions were as described for the HPLC-U 3000 system: column: Zorbax SB-C18 (4.6x250µm); injection volume: 10 µL; equilibration buffer: 5% acetonitrile; elution buffer: 5% acetonitrile containing; flow rate: 0.6 mL/min; detection: 220nm.
Results and Analysis
Box-Benhnken Test Design
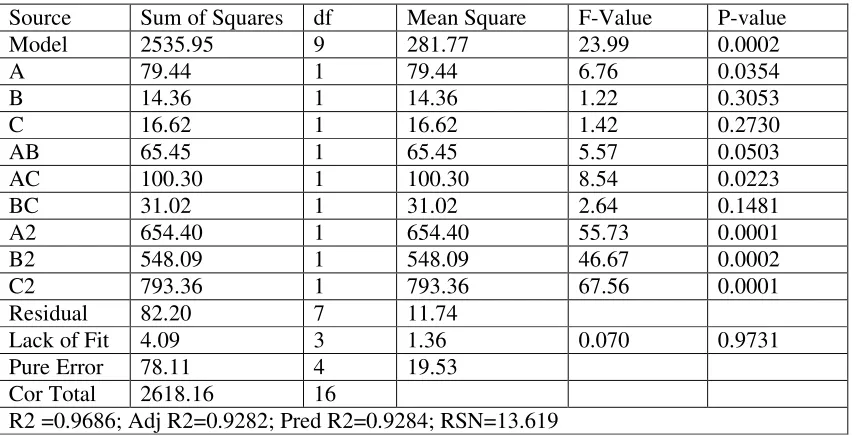
Table 3. Statistic analysis for the response surface quadratic model obtained from RSM design.
Source Sum of Squares df Mean Square F-Value P-value Model 2535.95 9 281.77 23.99 0.0002
A 79.44 1 79.44 6.76 0.0354
B 14.36 1 14.36 1.22 0.3053
C 16.62 1 16.62 1.42 0.2730
AB 65.45 1 65.45 5.57 0.0503
AC 100.30 1 100.30 8.54 0.0223
BC 31.02 1 31.02 2.64 0.1481
A2 654.40 1 654.40 55.73 0.0001
B2 548.09 1 548.09 46.67 0.0002
C2 793.36 1 793.36 67.56 0.0001
Residual 82.20 7 11.74
Lack of Fit 4.09 3 1.36 0.070 0.9731 Pure Error 78.11 4 19.53
Cor Total 2618.16 16
[image:3.612.94.523.507.725.2]RSM was used to optimize the conditions for the adsorption of the AAAs. The influence of the concentration of NaOH, the concentration of activated carbon and temperature on the adsorption rate was shown in Table 2. Analysis of variance (ANOVA) was presented in Table 3. As shown in Table 3, the value of p of the model was less than 0.01, indicating that the model was significantly predictive at the 0.01 significance level. The lack of fit analysis was used to test the fitness of the model. The p-value of the lack of fit was 0.9731, which demonstrated that the lack of fit was not significant as compared to the pure error (p>0.05) which further validates the model. Thus, the model was able to fit the experimental data, and could be used to monitor the optimization. The following empirical regression Eq. (2) represents the adsorption rate (y) on the concentration of NaOH, the concentration of activated carbon and temperature.
The model had an acceptable coefficient of determination (R2=0.9686), which indicated that 97% of the variability in the response on adsorption rate can be explained by the independent parameters. The term “Predicted R-Squared” (R2=0.9282) agreed well with the “Adjusted R-squared” (R2=0.9284). These results indicated that the models were well adapted to the responses.
Quadratic regression equation of three factors was founded through multivariable regression analysis. And the quadratic regression equation as following:
y=-374.2731+16.1395A+24.6758B+1530.6525C-0.2023AB-
25.0375AC-11.1400BC-0.7792A2-0.4564B2-5490.7000C2 (2)
Where y, A, B, C were the adsorption rate, concentration of NaOH, the concentration of activated carbon and temperature, respectively.
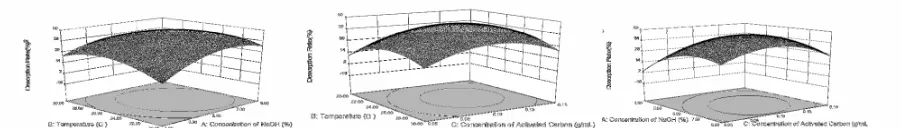
Effects of Parameters
[image:4.612.83.534.638.702.2]In order to determine the optimal levels of each variable for the maximum adsorption rate, 3D response surface plots were constructed by plotting the adsorption rate on the Z-axis against any two independent variables, while maintaining the other variable at its optimal level (Fig. 5a-5c). The adsorption rate increased until concentration of NaOH, the concentration of activated carbon and temperature reached an optimum point and then declined following further increasing of the above variables. This demonstrated that those variables could affect the adsorption capacity, and there should be an optimal value of adsorption rate in the range. In figure 5a, it can be observed that the optimum reaction condition was identified as concentration of 5.5% NaOH and temperature at 24.5°C. Besides, the contour density along the direction of concentration of NaOH was denser than temperature, illustrating that the effect of the concentration of NaOH on desorption rate was greater than that of temperature. In the same way, the optimum reaction condition was identified as concentration of activated carbon 0.1 g/mL, temperature at 24.5°C in Fig. 5b. In addition, the contour was round, which suggested the interaction between concentration of activated carbon and temperature was weak. Factorial effects with values of p less than 0.05 were considered to be significant. It was surprising that only a single factor exerted a significant linear effect of the adsorption rate within a 95% confidence interval, while the quadratic effects of three factors, including the concentration of NaOH(A) (p<0.001), the concentration of activated carbon (B) (p<0.001), and temperature (C) (p<0.001), were significant (Tab. 3). In addition, the interaction effect between the concentration of NaOH and temperature (AC) were significant (p<0.05). Hence, in our study, the three variables exhibited complicated effects on the adsorption rate.
Optimization and Model Validation
The optimal conditions were extracted by Minitab 14 software. The highest the adsorption rate obtained by using the above optimized concentrations of the variations was the concentration of NaOH at 5.53%, concentration of activated carbon at 0.10g/mL and temperature at 24.5°C. On this condition, the predicted the adsorption rate was 51.41%. To confirm the validity of the model, the adsorption of AAAs was performed under the optimal conditions, and the adsorption rate reached 50.40±3.21% (data not shown). The experimental value agreed with value predicted by the model within a 95% confidence interval. This confirmed that the model was powerful and suitable for the estimation of experimental values. Besides, the adsorption rate of AAAs was examined every thirty minutes in three hours (data not shown). The adsorption capacity increased gradually during the first two and half hours, and the adsorption rate reached the maximum of 50% at that time. Therefore, under the optimal conditions, the adsorption of AAAs solution on activated carbon reached equilibrium at 150 min. Zheng also studied the adsorption of the hydrolysate onto activated carbon, only the optimal temperature was the same, but the others were different. This may owe to a different enzymatic hydrolysis system, or the different type of activated carbon(10).
Analysis of Adsorption Solution
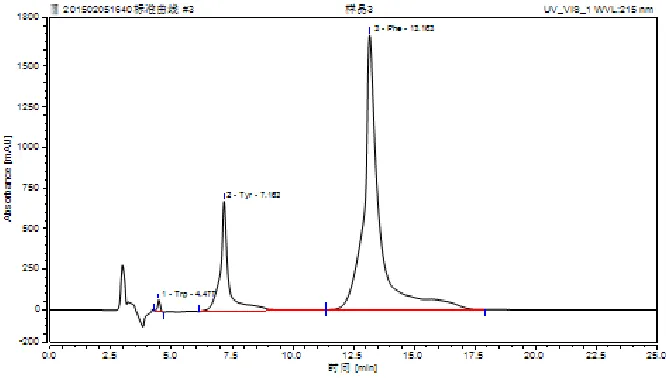
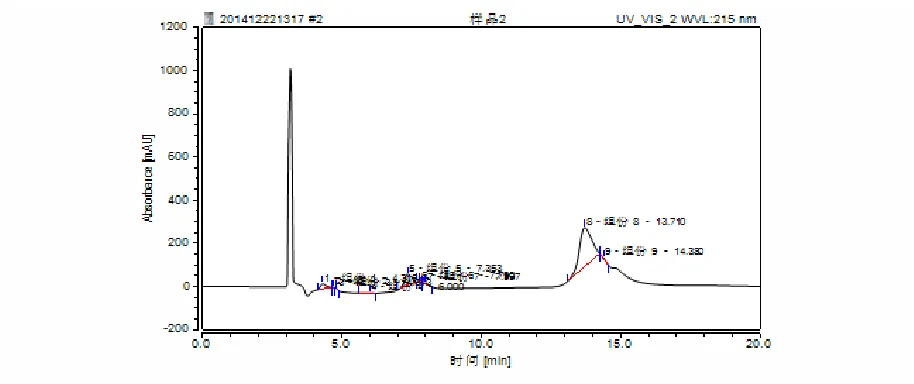
[image:5.612.139.472.476.665.2]The chromatogram of standard sample was shown in Fig. 2, which exhibited the specific retention time of three kinds of AAAs. The hydrolysate was absorbed by the activated carbon under optimal conditions estimated by RSM for 150 min, the adsorption solution was then analyzed by HPLC. The composition of adsorption solution was much complicated (Fig. 3), suggesting there were existed other amino acids in the solution absorbed by the activated carbon, except for Phe, Tyr and Trp. However, the three kinds of AAAs were qualitatively dominant in the adsorption solution. The amount of amino acids and the three AAAs were quantitatively analyzed by HPLC as follows: the content of amino acid was 61.89 mg/100mL, among them Phe was 30.00 mg/100mL,Tyr 20.98 mg/100mL and Trp 4.93 mg/100mL. Therefore, the content of aromatic amino acid accounted for 91.82% of all the amino acids absorbed by the activated carbon. The total amino acid composition of the hydrolysate after the adsorption by activated carbon was further measured and analyzed using an automatic amino acid analyzer, and the Fischer ratio was calculated to be 21.92 (data not unpublished). This demonstrated that the proposed adsorption by the activated carbon was efficient.
Figure 3. The chromatogram of desorption solutions.
Conclusions
In this experiment, response surface methodology based on Box-Benhnken experimental design was employed to optimize conditions for the adsorption of AAAs by activated carbon. The effect of three factors on desorption rate was concentration of NaOH>concentration of activated carbon>temperature. The optimal desorption conditions were found as follows: NaOH concentration 5.53%, temperature 24.56°C, activated carbon concentration 0.10g/mL. Under this condition up to 51.41%desorption rate could be obtained. The adsorption solution was analyzed by HPLC. The result revealed that Phe was 30.00 mg/100mL, Tyr was 20.98 mg/100mL, and Trp was 4.93 mg/100mL, and the content of aromatic amino acids accounted for 91.82% of the total amino acids. These results support that the aromatic amino acids could be effectively absorbed by the activated carbon under the appropriate conditions.
References
1. Guo-Cai, Y. U., Jiang-Tao, L. I., Hui, H. E., Huang, W. H., and Zhang, W. J. Ultrafiltration Preparation of Potent Bioactive Corn Peptide as Alcohol Metabolism Stimulator In Vivo and Study on its Mechanism of Action. Journal of Food Biochemistry, 37, 161–167, 2013.
2. Saadi, S., Saari, N., Anwar, F., Abdul, H. A., and Ghazali, H. M. Recent advances in food biopeptides: Production, biological functionalities and therapeutic applications. Biotechnology Advances33, 80-116, 2014.
3. Du, S., Song, R., and Luo, H. High Fischer Ratio Oligo-peptide from Hydrolysates of Tuna Meat. Journal of Chinese Institute of Food Science & Technology, 23, 214-219, 2014.
4. Gluud, L. L., Dam, G., Borre, M., Les, I., Cordoba, J., Marchesini, G., Aagaard, N. K., Risum, N., and Vilstrup, H. Oral branched-chain amino acids have a beneficial effect on manifestations of hepatic encephalopathy in a systematic review with meta-analyses of randomized controlled trials. The Journal of nutrition, 143, 1263, 2013.
5. Fischer, J. E., and Baldessarini, R. J. False neurotransmitters and hepatic failure.Lancet 2, 75-80, 1971.
7. Tanabe, S., Tanimoto, S., Watanabe, M., and Arai, S. Nutritional Effects of an Oligopeptide Mixture with a Very High Fischer Ratio on the Amino Acid Absorption and Cerebral Amine Metabolism in Rats Suffering from Galactosamine-induced Liver Injurry. Agricultural & Biological Chemistry, 55, 2585-2590, 2014.
8. Ma, Z. L., Zhang, W. J., Yu, G. C., He, H., and Zhang, Y. The primary structure identification of a corn peptide facilitating alcohol metabolism by HPLC–MS/MS. Peptides37, 138-143, 2012.
9. Roslan, J., Kamal, S. M. M., Yunos, K. F. M., and Abdullah, N. Optimization of Enzymatic Hydrolysis of Tilapia Muscle (Oreochromis niloticus) using Response Surface Methodology (RSM). Sains Malaysiana 43, 1715–1723, 2014.