Accepted Manuscript
Title: Population balance modelling for a flow induced phase inversion based granulation in a two dimensional rotating agglomerator
Authors: L. Liu, G. Akay, L. Tong
PII: S0263-8762(10)00134-6
DOI: doi:10.1016/j.cherd.2010.04.018
Reference: CHERD 522
To appear in:
Received date: 16-5-2009 Revised date: 23-3-2010 Accepted date: 15-4-2010
Please cite this article as: Liu, L., Akay, G., Tong, L., Population balance modelling for a flow induced phase inversion based granulation in a two dimensional rotating agglomerator,Chemical Engineering Research and Design(2008), doi:10.1016/j.cherd.2010.04.018
Accepted Manuscript
Population balance modelling for a flow induced phase inversion based granulation in a two
dimensional rotating agglomerator
L. Liu†, G. Akay‡ and L. Tong‡
†Department of Chemical and Process Engineering, University of Sheffield, Mappin Street,
Sheffield S1 3JD, UK
‡School of Chemical Engineering and Advanced Materials, University of Newcastle, Newcastle
Upon Tyne, NE1 7RU, UK
Abstract
A novel two dimensional rotating agglomerator was developed to carry out the flow induced
phase inversion (FIPI) based granulation. The process in this agglomerator shows that a continuous
paste flow (mixed with liquid binder and primary particles) is extruded into the interstice of two
relatively rotating disks, as the paste becomes solidified due to the loss of heat to the disks, it is then
broken into granules by the shearing force imposed by the rotating disk. Experimental
measurements have shown that the size of these granules is enlarged along the positive radial
direction of the disks. It is also found that these granules contain approximately the same quantity
of binder in terms of its volume fraction. The paper thus proposes a population balance (PB) model
to describe the growth of the granules by considering a size independent agglomeration kernel. The
PB simulated results are found to be well capable of describing the change of the particle size
distribution (PSD) of the granules in the radial direction. This study also proposes a velocity profile
for the paste flow and attempts to establish a quantitative relationship between the granulation rate
and the deformation rate as this would help us understand the mechanism of the agglomeration. It
is hoped that this study would be used to improve the design of the agglomerator and to assure the
control of the process and the granular product quality.
Accepted Manuscript
1. Introduction
1.1. FIPI
FIPI is a flow phenomenon in which a continuous phase turns into a dispersed phase, and
correspondingly a dispersed phase turns into a continuous phase when the volume ratio of the
continuous phase to the dispersed phase is varied from time to time during flow. In the applications
of this mechanism (Akay et al., 1994; Akay et al., 1994), generic processes of the agglomeration of
solids and liquids and the emulsification of highly viscous resins were developed. The approach
adopted in these FIPI processes represents a fundamental shift from agglomeration and
emulsification techniques; i.e., the composition and concentration of the process streams are chosen
in such a way that the processing is carried out in a highly viscous state, thus requiring the use of
high torque mixing-processing equipment such as extruders and compounders; and the final
products were obtained when FIPI occurs.
In order to achieve phase inversion during flow, high deformation rates and stresses should be
present, which are obtained in continuous processes and in highly viscous materials. Therefore,
these FIPI based techniques can be regarded as process intensifications in structured materials in
which the restrictions on the thermodynamic state variables (temperature, composition and
concentration) are relaxed by imposing a selective mechanical energy field (deformation state
variable) during processing (Akay, 1995).
Previous research (Paul, 1979; Gaylord, 1989) regarding phase inversion was mostly concerned
with emulsions of two immiscible liquid phases. Because such systems are thermodynamically
unstable, mechanical mixing is mostly required. It was also shown (Lissant, 1974) that the
maximum volume fraction of the dispersed phase in an emulsion system could reach 74% before
the dispersed phase turned into the continuous phase. However, for a FIPI process that particles are
involved, the maximum random packing of rigid, monosize spheres is reduced to 63% (Milewski,
1987; German, 1989). It was also claimed (Wildemuth and Williams, 1984) that dispersions
Accepted Manuscript
particle packing thus increasing the value of the maximum volumetric packing fraction to above
63%.
The influence of flow on phase inversion in emulsions was investigated (Akay et al., 1995),
which showed in an unambiguous manner that both the type (i.e. simple shear or extensional shear)
and deformation rate as well as fluid microstructure are important. However, phase inversion in
multiple polymer systems is not as well understood as it is in emulsions. The tendency for the high
viscosity phase to become the continuous phase has been studied (Nielsen, 1974) in the preparation
of inverted composites. It was also suggested (Ghijsels and Raadsen, 1980; Van de Vegt and
Elmendorp, 1986) that fluids with finite yield stress, i.e. extremely large viscosity at very low shear
rates, tend to form the continuous phase at small concentrations. These studies have shown that for
a FIPI process especially with high viscosity, mixing conditions and energy dissipation determine
when the phase inversion takes place, which is critical to obtain the desired products.
1.2. FIPI based agglomerations
The application of FIPI to the agglomeration of powders was studied (Akay et al., 1998) with
aluminium oxide as the primary particles and polyethylene glycol (PEG) and citric acid acting as
the coating materials. It was suggested that the phase volume of powders at phase inversion is
related to the binder molecular weight as well as the processing conditions.
Based on the understanding of FIPI, a two dimensional rotating agglomerator was developed
(Akay, 2000; Akay et al., 2002). This technique is operated under nonisothermal conditions, in
which the granules are obtained from a melt fill binder well mixed with primary particles. When the
melt fill is going through the equipment with nonisothermal control, the granules at the nuclei stage
are formed from the solidification of the melt fill under deformation. Then these nucleated granules
start growing with the flow produced by the centrifugal pressure and the pumping from an extruder.
The phase inversion occurs from a binder continuous state to a granule continuous state.
The work presented in this paper is concerned with the growth of the granules in such a
Accepted Manuscript
velocity profile of the paste and particle flow is thus proposed to establish the PB equation and to
introduce a stress induced mechanical deformation rate into the granulation rate for the
interpretation of the stress energy dependence of the agglomeration process.
1.3. PB modelling
PB modelling has been widely used in describing the change of PSD in particulate processes.
The PB equation was originated from the work of von Smoluchowski (1917) and then properly
derived and analysed by Hulbert and Katz (1964). PB modelling has been applied to describing
many aspects of crystallisation (Randolph and Larson, 1988), granulation and other particulate
processes (Hounslow, 1998; Ramkrishna, 2000).
The PB equation is a continuity equation allowing a statistical description of particle processes
in which the properties of a group of particles change with time and positions. These properties are
frequently some measure of particle size and number of particles. In most of cases, there is no
analytical solution to the equation; therefore, numerical methods are required (Ramkrishna, 2000).
A discretisation technique was developed using the finite difference method (Hounslow et al., 1988;
Hill and Ng, 1995) and is the technique used in this paper to produce the PB simulated PSDs in a
Mathematica package (DPB, Hounslow, University of Sheffield).
2. Experimental
2.1. Model of the processing unit
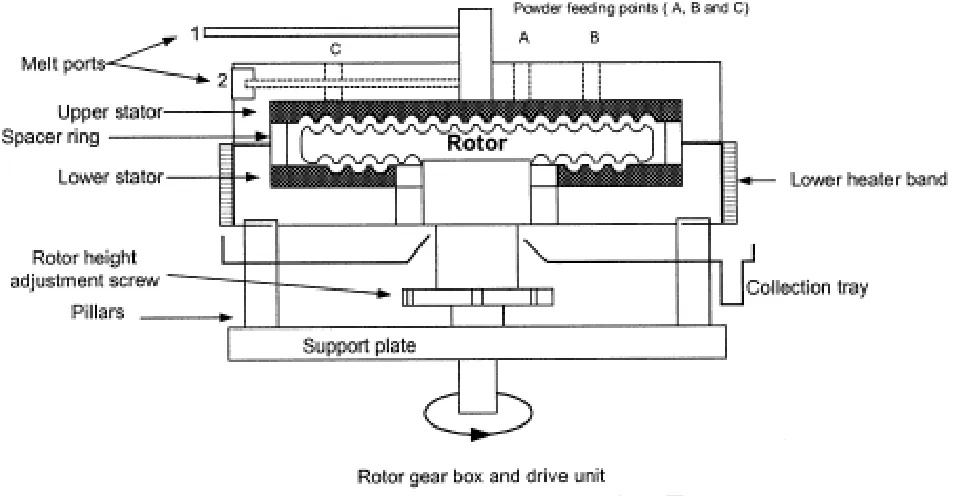
The processing unit is shown in Fig. A of the appendix and can also be found in the publication
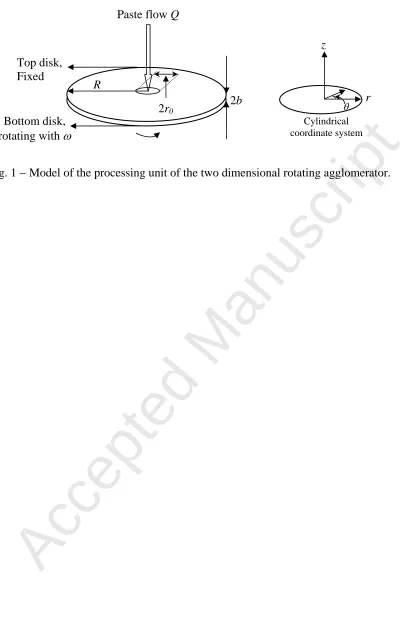
of Akay et al. (2002). Fig. 1 shows a model of the main processing unit of the equipment based on
which the velocity profile and PB modelling can then be established.
(Fig. 1)
In Fig. 1, R (=15cm) is the radius of the two disks. The top disk is fixed and the bottom disk is
rotating with an angular velocity . The gap between the two disks is 2b (b=3.75mm). In the centre
of the top disk, there is a cylindrical entry with radius r0 (=7mm) for the paste to be extruded and to
Accepted Manuscript
2.2. Materials and experimental setup
a. The mass mean size of the primary particles (Durcal, component: CaCO3) in diameter is 2.7m
with density 2700 kg m-3.
b. PEG with molecular weight 10000 Da and density 1100 kg m-3 as the binder. c. The mass ratio of the primary particles to the binder is 3:1 (55:45 in volume ratio).
d. The speed of the rotating bottom disk was = rad s-1.
e. The volumetric flow rate of the paste was set to be Q1 = 4.810-7 m3 s-1 and Q2 = 7.210-7 m3s-1.
2.3. Production of granules
A well-mixed and steadily extruded paste flow passes through the entry cylinder of the top disk
and reaches the bottom disk. With the shearing force imposed by the rotation of the bottom disk, the
paste flows radially and tangentially in the space between the two disks. Due to the difference of the
temperature between the paste and the disks, the convective heat transfer takes place from the paste
to the disks while the paste is flowing radially from the middle to the edge of the disks. When the
temperature of the paste drops to the solidification point, the paste starts to break up into the
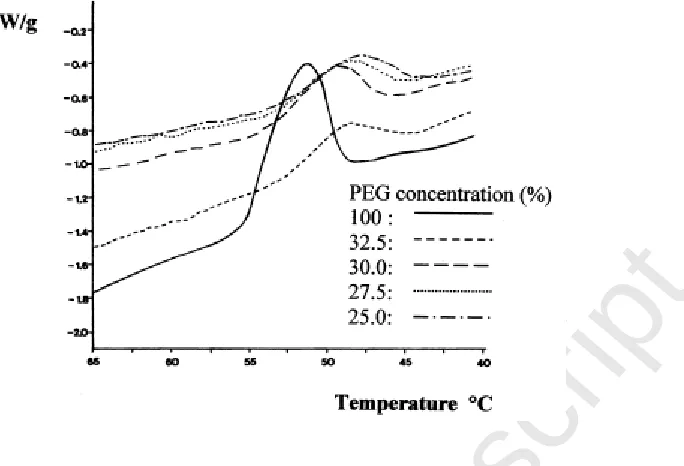
nucleus granules. Fig. 2 shows the temperature region where the pastes become solidified for
different mass contents of PEG10000 (Akay et al., 2002).
(Fig. 2)
As can be seen from Fig. 2, for the paste with 25% mass content of PEG10000, the temperature
span of the solidification from start (10 wt% of paste solidified) to completion of (95 wt% of paste
solidified) is about 5C from 48C to 43C. This temperature range allows the paste to solidify
(before phase inversion) in a transition state (being solidified but not completely solidified) so that
when the granular nuclei are produced (after the phase inversion) these nuclei can still agglomerate.
Thus, the temperature of the paste when it is flowing into the central entry of the top disk is set to
be 70C. The temperatures for the top and bottom disks are set to be 52C and 45C, respectively.
As the temperature of the paste is controlled by the two disks after it entered into the interstice
Accepted Manuscript
of the binder in the temperature range controlled by the disks does not change significantly
therefore does not have large impact on changing the agglomeration rate of the granules. It was
found that there was a paste area around the centre of the bottom disk after phase inversion occurred
and granular nuclei are produced. The radius of the paste area is measured and found to be 9cm for
Q1 but 10.4cm for Q2. The granules for Q1 were collected and sampled at r = 9.0cm, 10.4cm,
11.5cm, 12.5cm and 14.0cm, respectively; nevertheless, for Q2 they were collected at r = 10.4cm,
11.5cm, 12.5cm and 14.0cm, respectively. The size distributions of these samples were then
measured using Camsizer (Retsch Technology, 2000).
2.4. Measurements and results
2.4.1. Total number and mass mean size of granules
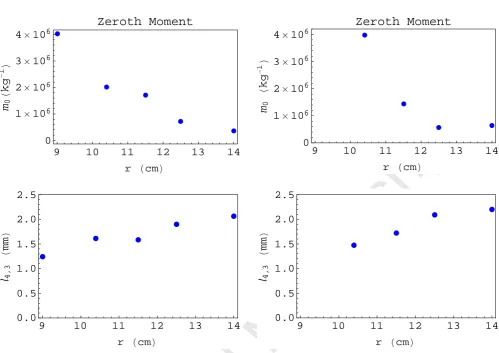
Two sets of results as shown in Fig. 3 were obtained after the Camsizer measurement for Q1
and Q2, respectively.
(Fig. 3)
In Fig. 3, the Zeroth Moment, m0with unit kg-1, means the total number of granules per unit
mass. The Moment is defined as:
0 ( , )
)
(r l n r l dl
m j
j (1)
where n(r, l) is the number density of granules with size l in diameter at the position r. So, m0 is
corresponding to the Zeroth Moment. The mean size is defined as:
j i
j i j
i m r
r m r
l
1
, ( )
) ( )
( (2)
The mass mean is l4,3. The Moments and the mean sizes were only the functions of radius because
of the steady state process.
As can been seen from Fig. 3, the decrease of the total number and the growth of the mean size
of granules with radius indicates a process of agglomeration.
Accepted Manuscript
The binder volume fraction was also calculated according to:
) ( ) (
) ( )
(
l V l V
l V l
s b
b
(3)
where Vb(l) and Vs(l) are the volumes of the binder and the solid in the granules with size l
sampled at position r, respectively.
To measure the volume content of binder for the granules in different sizes, the collected
samples at each position r after size distribution measurement with Camsizer were then sieved into
18 size classes from 0.1 to 3.0mm. For these granules in each size class, after their total mass has
been measured, they were then taken into a furnace for binder elimination. It was normally a 7-8
hour process for the binder to be burnt out of the granules in the temperature around 450 C inside
the furnace while the primary particles (CaCO3) are not affected. The mass of the granules inside
the furnace was monitored, when it remains not changing for several hours, after the furnace cooled
down, the granules were then taken out the furnace and their mass was again measured. The
difference between the masses before and after the furnace was regarded as the mass of the binder
contained in those granules. The volume of the binder can thus be calculated according to its
density.
Fig. 4 shows the binder volume fraction contained in granules with size l at different position r.
(Fig. 4)
As can be seen from Fig. 4, the volume content of the binder in different sizes of granules
remains almost the same so does to the granules in different positions r. It suggests that the binder
was uniformed distributed into the granules during the agglomeration. This is due to the fact that the
initial granular nuclei are produced from the breakage of the paste in which the primary particles
and the binder are well-mixed before the granular phase is produced.
The slightly higher volume fraction of binder shown in this graph contained in small and large
granules was due to the experimental errors. This is because the granules at each position r after
Accepted Manuscript
size distribution plots as shown in Fig. 7 of Section 4.1. These few grams of granules caused the
errors in measurement after the binder eliminated from the granules in the trend seemingly they
have lost more masses than other sizes of granules in the furnace. That is the reason why they
looked having slightly higher binder content than others. However, this error should be neglected
and the granules should be regarded to contain approximately the same content of binder as they all
come from a particle and binder well mixed paste.
3. Theoretical analysis
3.1. The velocity profile
A velocity profile is proposed for the paste and the granular flow induced by the centrifugal
pressure and the extrusion as illustrated in Fig. 1. With the cylindrical coordinates as also shown in
Fig. 1, the velocities are:
1 22
8 3 b z br Q u (4a) b z r v 1 2 (4b) 0 w (4c)
where is the angular velocity of the bottom disk, and u, v, w are the velocity components in r,
and z directions. It is worth pointing out that ucan not be applied to the situation where r < r0
particularly to r 0 as the flow at r < r0 is discontinuous. Let U be the velocity vector and
} , , { } , ,
{u v w Ur U Uz , it can thus be proven that:
0
U (5)
and Q dz b z b Q rudz b b b
b
22
1 4 3
2 (6)
Eq.s (5) and (6) confirm that the velocity profile satisfies the mass balance.
Accepted Manuscript
2 2 2 2 1 2 1 1 2 v r r v r u r z w r u v r r u 2 2 2 1 1 2 1 r v z u z v vr (7)
Substituting (4a-c) into Eq. (7) yields:
2 2 2 4 2 2 2 2 2 2 2 6 2 2 2 4 16 1 9 16 9 b r r b b z Q r b z Q (8)
For this two-dimensional flow (b<<R), the in situ z-averaged deformation rate is:
2 2 2 4 4 2 2 2 2 4 80 ) 5 8 ( 3 2 2 b r r b r b Q rdz dz r b b b b
(9)The plots of against r for Q1 and Q2 and the plot of 2r2/4b2 versus r are shown in Fig. 5.
(Fig. 5)
As can be seen from Fig. 5, the three curves are overlapped. This implies that the deformation
rate largely depends on the shearing force which was represented by the second term of the right
hand side of Eq. (9). Thus, (9) can be approximately written as:
2 2 2 4b r
(10)
3.2. PB modelling
The PB equation in agglomeration form is:
0 ,0 , ( ) ( ) ( ) ( )
2 1 )) ( ( ) ( ds s n V n ds s n s V n V n t V n s V v s s V U (11)
where n (kg-1 m-3) is the number density of granules, V and s are the volume sizes of granules. From left to right, the first term of (11) describes the change of the number density of particles
V in time and the second term tells the migration rate of particles V in spatial coordinates; the third
Accepted Manuscript
fourth term describes the death rate of particles V owing to the aggregation between particles V and
any sizes of particles.
Note, n in Eq. (11) takes the volume size as a variable. This makes the expression of this
equation simpler than that of n taking length size in diameter as a variable such as that in Eq. (1),
nevertheless, n(V)dV n(l)dl. It should be noted that n is denoted by its size characteristic only,
though it is also the function of time and spatial coordinates. (kg s-1) is the agglomeration kernel
also the function of particle size, time and spatial coordinates.
In this study, because of the steady state process and the two-dimensional model, Eq. (11) can
be changed to:
0 ,0 , ( ) ( ) ( ) ( )
2 1 ) ( ds s n V n ds s n s V n r V n
u Vs
v s s
V
(12)
where n and are now only the function of particle size and r. u is the in situ z-averaged velocity
of u:
br Q rdz rudz u b b b b 4 2 2
(13)3.3. The agglomeration kernel
The agglomeration kernel must be determined before Eq. (12) can be solved to provide the
numerical solution for n. In general, agglomeration kernels are the geometric characteristic of
particle collisions and used to calculate the collision rate. The use of the kernels, for instance the
application of coalescence kernels for wet granulation PB modelling (Ennis and Litster, 1997; Liu
and Litster, 2002), is mostly empirical and depends on the understanding of the practical process
and the modeller’s experience with PB simulation. As suggested (Sastry, 1975) and now it is widely
accepted that can be split into an inherent agglomeration rate 0 and a size dependence f; thus for
this steady state process, we have:
) , ( ) ( ) , ,
(r V s 0 r f V s
Accepted Manuscript
As can be seen from Fig. 4, the binder can be regarded as uniformly distributed into the
granules of different sizes at different positions. This indicates that every individual granule has the
same chance to agglomerate with other granules, which means that any size of individual granules
have no preference in agglomerating with any other sizes of granules and the same to themselves.
This suggests that the agglomeration of the granules in this study may be considered to be size
independent. Therefore, we have (12) changed to:
0 0 00 ( ) ( ) ( ) ( )
2 ) ( ds s n V n ds s n s V n r V n
u v (15)
Integrating this equation on both sides over the domain of variable V from 0 to yields:
2 0 0
0 ( )
2 ) ( r m dr r dm
u (16)
Thus: u dr r m d 2 ) ( 1 0 0
(17)
Taking 0 as a constant, we have:
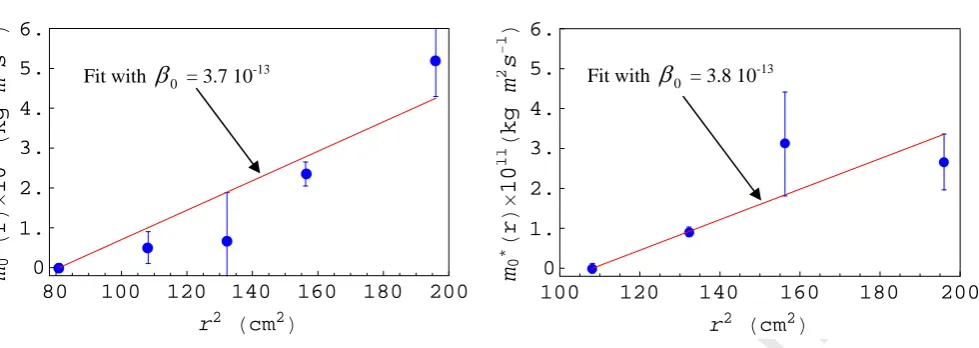
) ( ) ( 1 ) ( 1 2 2 0 2 0 0 0 0 r r r m r m b
Q
(18)
Let
) ( 1 ) ( 1 2 ) ( 0 0 0 *
0 b m r m r
Q r m
, the plots of data ( ( )
*
0 r
m , r) and the fits to the data are shown
in Fig. 6.
(Fig. 6)
As can be seen from Fig. 6, the 0 values for Q1 and Q2 are almost the same, thus 0 can be
regarded as a constant in this study.
4. Results and discussion
Results presented in this section are mainly concerned with the PB modelling prediction in PSD
Accepted Manuscript
experimental measurements in order to justify the model. The granulation rate is analysed to
provide suggestions for controlling the growth rate of granule size through controlling process
variables and experimental parameters.
4.1. PB simulation
Taking the determined 0 values into Eq. (15), the simulation is carried out with an initial PSD
to predict the PSDs at other radial positions. The initial PSD is set to be the PSD measured at the
outside edge of the paste area, i.e., the PSDs at r = 9.0cm and 10.4cm for Q1 and Q2, respectively.
Fig. 7 shows the comparison between the simulated and experimental PSDs at different radial
positions in the form of mass fraction lw(l) (-) (l is the particle size in diameter and w(l) (m-1) is the
mass density of the particles with size l). Also in this figure, the Zeroth Moment and l4,3 mean size
are compared.
(Fig. 7)
As can be seen from Fig. 7, despite some slight under-predictions in the PSD representation of
the experimental data, it is still true to say that the PB simulation can largely predict the change of
PSD in r especially from the agreement between the modelling and experimental results for the total
number and the mean sizes of granules as shown in the corresponding graphs of this figure.
The under-prediction is due to the peak broadening of the PB modelled PSD. This is because
the agglomeration rate is determined by Eq. (18), which is associated with the total number of
particles at each position r but not necessarily reflecting the shape of each size distribution; so is the
fitted rate value 0 that does not necessarily contain the information of the PSDs either. However,
this is the only method that is practically available to determine the agglomeration rate from
experiments. Therefore, the correctness of the PB simulation relies on entirely the PB method itself
whether it truly reflects the mechanism of the process.
In addition, the PB simulation started from the initial PSDs which are quite wide distributed in
Accepted Manuscript
quite dramatic narrowing in terms of the size span, which has resulted in a large increase of the
peak value at the modal size. However, the PB simulation using the agglomeration rate determined
by Eq. (18) can only compute the PSDs from the initial ones in a more gradually progressive way,
as mentioned above the fitted value 0 does not contain the shape information of the size
distributions. Therefore, compared to that of the experiments, the PB modelled PSDs have slightly
wider peak values. However, except for this slightly peak broadening, the PB modelled PSDs have
rightly followed the shape development of the experimental PSDs and correctly predicted the
change of the mean size and total number of granules at each position r.
4.2. The granulation rate and the deformation rate
According to Eq. (17), let:
* 0 0
2
u (19)
Since 0 is the inherent agglomeration rate, * 0
(kg m-1) can be regarded as the granulation rate as
its unit indicates that this is the rate related to the radial position of the granules. 0* means the
successful collision efficiency that leads to granulation in mass scaled by the unit length of the
radius.
Substituting u in Eq. (19) by expression (13) and taking (10) into account to eliminate the
variable r, we have:
Q
b 0
2 *
0
4
(20)
As 0 can be regarded as a constant, expression (20) thus establishes a relationship between the
granulation rate and the deformation rate. It suggests how quick the granules will grow in r depends
on the deformation rate applied to the granules. Fig. 8 shows the effect of the flow rate on * 0
by
plotting it vs .
Accepted Manuscript
It is shown in Fig. 8 that higher flow rates result in lower granulation rates while increasing the
mechanical dissipation (characterised by ) will always enhance the granulation rate.
In fact, * 0
in Eq. (15) is the effective agglomeration rate that provides a quantitative
expression for the agglomeration kernel. It is * 0
that determines how quick the granules will
agglomerate thus to grow in size. Any increase in the value of * 0
will increase the rate of the
granule growth, Eq. (20) suggests that to obtain large granules in a short distance along the radial
direction of the disks, a low flow rate may be required and a high angular velocity will also be
useful as the increase of increases along with r.
Once all the parameters and variables that make up the * 0
are fixed, the PSD at any r is
entirely predictable thus becomes deterministic. Optimising the design of the agglomerator and the
process of the granulation will only require 0* to be the basis on how to achieve its maximum
value in a practical way. For instance, if the diameter 2R of the disks and the rotation speed of the
bottom disk are fixed, increasing the gab 2b between the two disks and reducing the flow rate Q of
the paste become the only ways to maximise 0* thus to maximise the rate of the granules’ growth.
However, on one hand, reducing flow rate will increase the processing time thus may not be
practically applicable. On the other hand, increasing the gap between the two disks will require
larger driving power from the extruder to drive the paste and granules to flow thus results in more
energy consumption.
Another example is, if the flow rate Q and the rotation speed of the bottom disk are
determined, the ways to increase the granule size in the granulation are to increase the gap 2b
between the two disks and increase the diameter 2R of the disks so that the granules have a longer
distance to travel in order to grow larger as shown in the predicted mean size graphs (lines) in Fig. 7.
Such information is useful in not only designing the size of the equipment but also in
Accepted Manuscript
processing variables such as Q and are determined, the PSD at any r is determined and can be
calculated by the PB simulation.
Therefore, to optimise the design of the agglomerator and the agglomeration process will
depend on the specific cases and circumstances. Nevertheless, the parameters and variables that
make up the granulation rate 0* remain in the centre of the discussion.
5. Conclusions
The PB modelling for a FIPI based novel agglomeration process is presented in this paper with
a velocity profile that is proposed to describe the flow of the paste and the granules. It is found that
using a steady state agglomeration PB model, the PSDs of the granules at different positions along
the radial direction can be well represented. It is also found that the inherent agglomeration rate can
be regarded as a constant that results in the granulation rate being linearly related to the radial
position of the granules. This makes possible establish a relationship between the granulation rate
and the deformation rate, which can then be used to interpret such an agglomeration process in a
fundamental aspect that the mechanical dissipation provides the energy for the granules to
agglomerate. However, the effective way to change the granulation rate is to change the flow rate as
the granulation rate is directly related to the radial velocity of the granules which is provided by the
radial flow of the granules. It is hoped that these results can be used to improve the design of the
processing unit in its size and to optimise the processing variables such as the angular velocity and
the flow rate in order to control the final PSD of the granular products at any particular radial
positions.
It should be mentioned, although the velocity profile satisfies the mass continuity theoretically,
its validity still remains to be examined experimentally. This is an ongoing research being carried
out together with the analysis of the heat transfer for the process of paste flow and solidification
Accepted Manuscript
Acknowledgements
This research was supported by the Engineering and Physical Sciences Research Council
(EPSRC) of the U.K. (GR/M58276), AstraZeneca, Carl Stewart Ltd., Syngenta Thermo Haake, and
Rosand Precision Ltd. Their support is gratefully acknowledged. The authors would also like to
thank Prof. M. J. Hounslow for his valuable suggestions.
Nomenclature
Roman symbols
b half of the gap between two disks m
f size dependence of agglomeration kernel
-l particle size in diameter m
l4,3 mass mean size of particles in diameter m
0
m the Zeroth Moment kg-1
* 0
m Q[1/m0(r)1/m0(r0)]/2b kg m
2 s-1
n number density of particles m-3 kg-1
Q volumetric flow rate m3 s-1
r cylindrical coordinate in radial direction m
r0 radius of cylindrical entry in the top disk cm
R radius of the disks cm
s particle size in volume m3
V particle size in volume m3
w mass density of particles m-1
z cylindrical coordinate in vertical direction m
Vectors
U velocity vector of paste m s-1
u velocity component in r direction m s-1
Accepted Manuscript
v velocity component in direction m s-1
w velocity component in z direction m-1
Greek symbols
agglomeration kernel kg s-1
0
agglomeration rate kg s-1
* 0
granulation rate kg m-1
angular velocity rad s-1
deformation rate s-2
z-averaged deformation rate s-2
cylindrical coordinate in angular direction m
viscosity of the paste Pa s
References
Akay, G., 1995, Flow Induced Phase Inversion in Powder Structuring by Polymers. In Polymer
Powder Technology, Rosenzweig, N. and Narkis, M. (eds), pp. 542-587. (Wiley, New York)
Akay, G., 2000, Intensive Agglomeration and Microencapsulation of Powders. Internal report,
University of Newcastle, Newcastle.
Akay, G., Bhumgara, Z. and Wakeman, R.J., 1995, Self-support Porous Channel Filtration Modules:
Preparations and Performance. Chem Eng Res Des, 73: 782-797.
Akay, G., Chapple, A., Garrett, P.R., Knight, P.C. and Yorke, J.W.H., 1994, Detergent powder and
process for preparing them. Australian Patent, 651,732.
Akay, G., Garrett, P.R. and Yorke, J.W.H., 1994, Antifoam ingredient. European Patent, 593,441.
Akay, G., Price, V.J. and Chan, S.Y., 1998, Flow Induced Phase Inversion in the intensive
agglomeration/ micro-encapsulation of Powders. World Congress on Particle Technology III,
Accepted Manuscript
Akay, G., Tong, L. and Addleman, R., 2002, Process intensification in particle technology:
Intensive granulation of powders by thermomechanically induced melt fracture. Ind Eng Chem
Res, 41: 5436-5446.
Bird, R.B., Stewart, W.E. and Lightfoot, E.N., 1960, Transport phenomena. (Wiley and Sons, Inc.,
New York and London)
Ennis, B.J. and Litster, J.D., 1997, Size enlargement. In Perry's chemical engineering handbook (7th
ed), Section 8. (McGraw-Hill, New York)
Gaylord, N.G., 1989, Compatibilizing Agents: Structure and Function in Polyblends. J Macromol
Sci, Part A: Pure and Applied Chemistry, A26: 1211-1229.
German, R.M., 1989, Particle Packing Characteristics. (Metal Powder Industries Federation,
Princeton, N. J.)
Ghijsels, A. and Raadsen, J., 1980, A collaborative study on the melt rheology of a
styrene-butadiene-styrene block copolymer. Pure & Appl Chem, 52: 1359-1386.
Hill, P.J. and Ng, K.M., 1995, New discretization procedure for the breakage equation. AIChE J, 41:
1204-1216.
Hounslow, M.J., 1998, The population balance as a tool for understanding particle rate processes.
Kona Powder and Particles, 16: 179-193.
Hounslow, M.J., Ryall, R.L. and Marshall, V.R., 1988, A discrete population balance model for
nucleation, growth and aggregation. AIChE J, 34: 1821-1832.
Hulbert, H.M. and Katz, S., 1964, Some problems in particle technology: A statistical formulation.
Chem Eng Sci, 19: 555-574.
Lissant, K.J., 1974, Emulsions and Emulsion Technology. (Marcel Dekker, New York)
Liu, L.X. and Litster, J.D., 2002, Population balance modelling of granulation with a physically
based coalescence kernel. Chem Eng Sci, 57: 2183-2191.
Milewski, J.W., 1987, Handbook of Reinforcements for Plastics. Milewski, J.V. and Katz, H.S.
Accepted Manuscript
Nielsen, L.E., 1974, Mechanical Properties of Polymers and Composites. (Marcel Dekker, New
York)
Paul, D.R., 1979. In Polymer Blends, Paul, D.R. and Newman, S. (eds). vol. 2. (Academic Press,
New York)
Ramkrishna, D., 2000, Population balances: Theory and applications to particulate systems in
Engineering. (Academic Press, San Diego, California)
Randolph, A.D. and Larson, M.A., 1988, Theory of particulate Processes. (2nd ed). (Academic
Press, New York)
Sastry, K.V.S., 1975, Similarity size distribution of agglomerates during their growth by
coalescence in granulation or green pelletization. International Journal of Mineral Processing, 2:
187-203.
Van de Vegt, A.K. and Elmendorp, J.J., 1986, In Integration of Fundamental Polymer Science and
Technology, Kleintjens, L. A. and Lemstra, P. J. (eds). (Elsevier Appl Sci Publisher, London)
von Smoluchowski, M.V., 1917, Mathematical theory of the kinetics of the coagulation of colloidal
solutions. Zeitschrift fuer Physikalische Chemie, 92: 129-168.
Wildemuth, C.R. and Williams, M.C., 1984, Viscosity of suspensions modeled with a
Accepted Manuscript
Appendix
Accepted Manuscript
Figure captions
Fig. 1 Model of the processing unit of the two dimensional rotating agglomerator.
Fig. 2 The temperature profiles of the solidification of the pastes with different mass contents of PEG10000.
Fig. 3 The total number and mass mean sizes of the granular samples for Q1 and Q2 referring to
the flow rates 4.810-7 m3 s-1 and 7.210-7 m3 s-1, respectively. Note, Zeroth Moment (m0) means the total number of granules in a unit mass and l4,3 means the mass mean size of the granules.
Fig. 4 The volume fraction of binder in granular samples for Q1 and Q2 that are corresponding to
the flow rates 4.810-7 m3 s-1and 7.210-7 m3 s-1, respectively. Note, the dots with different shapes are overlapping.
Fig. 5 Deformation rate versus radius. Note, denotes the shearing contribution represented by the second term of the right hand side of Eq. (9). Q1 and Q2 are corresponding to the flow rates
4.810-7 m3 s-1and 7.210-7 m3 s-1, respectively.
Fig. 6 The plots of and the fits to m0*(r) versus r2 for Q1 and Q2 that are corresponding to the
flow rates 4.810-7 m3 s-1and 7.210-7 m3 s-1, respectively.
Fig. 7 The comparison between the PB simulated and the measured PSDs at different radial positions. The Zeroth Moment and the l4,3 mean size are also compared. Note, the curves are the
simulation results and the dots represent the experimental measurements. Q1 and Q2 are
corresponding to the flow rates 4.810-7 m3 s-1and 7.210-7 m3 s-1, respectively.
Fig. 8 Effect of the flow rate Q on the granulation rate * 0
in terms of the deformation rate .
Note, the coordinate values on the vertical axis are * 0
multiplied by 109. Q1 and Q2 are
corresponding to the flow rates 4.810-7 m3 s-1and 7.210-7 m3 s-1, respectively.
Accepted Manuscript
Paste flow
Q
Fig. 1 − Model of the processing unit of the two dimensional rotating agglomerator.
z
Top disk,
Fixed
2
r0
2
b
Bottom disk,
rotating with ω
R
r
θ [image:23.595.108.511.59.685.2]Accepted Manuscript
Fig. 2
−
The temperature profiles of the solidification of the pastes with different mass contents of
Accepted Manuscript
Q
1Q
29 10 11 12 13 14
0 1×10⁶ 2×10⁶ 3×10⁶ 4×10⁶
r H Lcm
m0
H
kg
−
1 L
Zeroth Moment
9 10 11 12 13 14
0 1×10⁶ 2×10⁶ 3×10⁶ 4×10⁶
r H Lcm
m0
H
kg
−
1 L
Zeroth Moment
9 10 11 12 13 14
0.0 0.5 1.0 1.5 2.0 2.5
r cm
l4,
3
H
mm
L
H L
9 10 11 12 13 14
0.0 0.5 1.0 1.5 2.0 2.5
r cm
l4,
3
H
mm
L
H L
Fig. 3
−
The total number and mass mean sizes of the granular samples for
and
referring to
the flow rates 4.8
×
10
-7m
3s
-1and 7.2
×
10
-7m
3s
-1, respectively. Note, Zeroth Moment (
) means
the total number of granules in a unit mass and
l
4,3 means the mass mean size of the granules.1
Q Q2
0
[image:25.595.49.549.70.423.2]m
Accepted Manuscript
Q
1Q
280 100 120 140 160 180 200
0 1. 2. 3. 4. 5. 6.
r2 cm2
m0
∗ H
r
L
×
10
H L
11
H
kg
m
2 s
−
1 L
100 120 140 160 180 200
0 1. 2. 3. 4. 5. 6.
r2 Hcm2L
m0
∗ H
r
L
×
10
11
H
kg
m
2 s
−
1 L
Fit with
β
0 = 3.8 10-13 Fit withβ
0 = 3.7 10-13
Fig. 6
−
The plots of and the fits to
m0*(r)versus
2
r
for
Qand
Qthat are corresponding to the
flow rates 4.8
×
10
-7m
3s
-1and 7.2
×
10
-7m
3s
-1, respectively.
[image:26.595.58.548.76.250.2]1 2
Accepted Manuscript
0
1000
2000
3000
4000
0.0
0.5
1.0
1.5
2.0
2.5
3.0
ε
¯
L
−
1
Q
1m
H
kg
H
s
−2L
β
0∗
×
10
9
Q
2Fig. 8
−
Effect of the flow rate
Q
on the granulation rate
β
0*in terms of the deformation rate
ε
.
Note, the coordinate values on the vertical axis are
multiplied by 10
9.
and
are
corresponding to the flow rates 4.8
×
10
-7m
3s
-1and 7.2
×
10
-7m
3s
-1, respectively.
* 0
[image:27.595.144.512.61.269.2]β
Q1 Q2Accepted Manuscript
Q
1Q
2Ê
ÊÊÊÊÊÊ Ê Ê Ê Ê Ê Ê Ê Ê Ê Ê Ê
‡
‡‡‡‡‡‡ ‡ ‡ ‡ ‡ ‡ ‡ ‡ ‡ ‡ ‡ ‡
ÏÏÏÏÏÏÏÏ Ï ÏÚÚÚÚÚÚ Ú ÚÚ Ú Ú Ú ÚÏ Ï Ï ÏÚ ÏÚ ÏÚ ÏÚ ÏÚ
ÙÙÙ Ù
Ù
Ù Ù Ù Ù Ù Ù Ù Ù Ù Ù Ù Ù Ù
0.0 0.5 1.0 1.5 2.0 2.5 3.0
0.0 0.2 0.4 0.6 0.8 1.0
lHmmL
Φ
H
l
LH
−
L
ôr=14.0 cm
òr=12.5 cm
ìr=11.5 cm àr=10.4 cm
ær=9.0 cm
ÊÊÊÊÊÊÊ Ê Ê Ê Ê Ê Ê Ê Ê Ê Ê Ê
‡‡‡‡‡‡‡ ‡ ‡ ‡ ‡ ‡ ‡ ‡ ‡ ‡ ‡
‡
ÏÏÏÏÏ
ÏÏ Ï ÏÏ Ï Ï Ï Ï Ï Ï Ï
Ï
ÚÚÚÚÚÚÚÚ Ú Ú Ú Ú Ú
Ú Ú Ú Ú Ú
0.0 0.5 1.0 1.5 2.0 2.5 3.0
0.0 0.2 0.4 0.6 0.8 1.0
lHmmL
Φ
H
l
LH
−
L
ò r=14.0cm
ìr=12.5cm
à r=11.5cm
æ r=10.4cm
Fig. 4
−
The volume fraction of binder in granular samples for
Q
1 andQ
2 that are corresponding tothe flow rates 4.8
×
10
-7m
3s
-1and 7.2
×
10
-7m
3s
-1, respectively. Note, the dots with different shapes
Accepted Manuscript
0
2
4
6
8
10
12
14
0
500
1000
1500
2000
2500
3000
3500
r
H
cm
L
ε
−
H
s
−
2
L
w
Q2 Q1
Fig. 5
−
Deformation rate versus radius. Note,
ω
denotes the shearing contribution represented by
the second term of the right hand side of Eqn. (9).
Q
1 andQ
2 are corresponding to the flow ratesAccepted Manuscript
Q
10.1 0.2 0.5 1 2 3 5 0.0
0.1 0.2 0.3 0.4
lHmmL
lw H l LH − L
r=9.cm
0.1 0.2 0.5 1 2 3 5 0.0
0.1 0.2 0.3 0.4
lHmmL
lw H l LH − L
r=10.4cm
0.1 0.2 0.5 1 2 3 5 0.0
0.1 0.2 0.3 0.4
lHmmL
lw H l LH − L
r=11.5cm
0.1 0.2 0.5 1 2 3 5 0.0
0.1 0.2 0.3 0.4
lHmmL
lw H l LH − L
r=12.5cm
0.1 0.2 0.5 1 2 3 5 0.0
0.1 0.2 0.3 0.4
lHmmL
lw H l LH − L
r=14.cm
9 10 11 12 13 14 0
1×10⁶
2×10⁶ 3×10⁶ 4×10⁶
r HcmL m0 H kg − 1L Zeroth Moment
9 10 11 12 13 14
0.0 0.5 1.0 1.5 2.0 2.5
r HcmL
l4, 3 H mm L
Q
20.1 0.2 0.5 1 2 3 5 0.0
0.1 0.2 0.3 0.4
lH Lmm
lw H l LH − L
r=10.4cm
0.1 0.2 0.5 1 2 3 5 0.0
0.1 0.2 0.3 0.4
lH Lmm
lw H l LH − L
r=11.5cm
0.1 0.2 0.5 1 2 3 5 0.0
0.1 0.2 0.3 0.4
lH Lmm
lw H l LH − L
r=12.5cm
0.1 0.2 0.5 1 2 3 5 0.0 0.1 0.2 0.3 0.4 l mm lw H H L l LH − L
r=14.cm
10 11 12 13 14
0 1×10⁶
2×10⁶
3×10⁶
4×10⁶
r cm m0 H kg − H L 1L Zeroth Moment
10 11 12 13 14
0.0 0.5 1.0 1.5 2.0 2.5 r cm l4, 3 H mm L H L
Fig. 7
−
The comparison between the PB simulated and the measured PSDs at different radial
positions. The Zeroth Moment and the
l
4,3 mean size are also compared. Note, the curves are thesimulation results and the dots represent the experimental measurements.
Q
1 andQ
2 areAccepted Manuscript
Fig. A
−
Diagrammatic illustration of the processing unit of the two dimensional rotating
[image:31.595.67.544.63.311.2]