Munich Personal RePEc Archive
Estimates of Trade-Related Adjustment
Costs in Syria
Lim, Jamus Jerome and Saborowski, Christian
1 October 2009
Online at
https://mpra.ub.uni-muenchen.de/17613/
Estimates of Trade-Related
Adjustment Costs in Syria
Jamus Jerome Lim and Christian Saborowski
∗October 1, 2009
Abstract
The scope and complexity of international trading arrangements in the Middle East, as well as their spotty historical record of success, under-scores the urgent need for an adequate understanding of the relative costs and benefits of participation in preferential trading arrangements and, more generally, of changes in the domestic import regimes. This paper seeks to address this problem by providing estimates of the adjustment costs associated with two broad classes of hypothetical trade policy scenar-ios scenarscenar-ios for Syria: Participation in preferential trading arrangements, and changes in the domestic import regime.
Keywords: Trade policy, tariff reform, Syria JEL Classification: F14, O24, P33
FOR EACH ITEM DO
If ( ( TypProc = "4" ) or ( TypProc = "1" ) ) Then Num04 IS 0 ;
If ( TaxAmount ( "002" ) GT 0 ) Then If ( InListTar ( "TVA" ) = 0 ) Then
Num02 IS 5 ; Else
Num02 IS 1 ; Endif ;
Num03 IS TaxAmount ( "002" ) ;
Num04 IS RoundSup ( ( Num03 * Num02 ) Div 100 ) ; Endif ;
First 12 of 139 lines of code required to calculate the city local tax applied by Syrian customs at the border
1
Introduction
The history of regional and international integration in the Arab world is re-plete with examples of unrealized aspirations toward greater trading flows. Be-ginning with early intra-regional attempts at organizing transit trade in 1953, to the Agreement on the Arab Common Market in 1964, to the Agreement on the facilitation and promotion of intra-Arab trade in 1981, tangible results from these agreements have remained somewhat elusive (Romagnoli & Mengoni 2009). The Greater Arab Free Trade Area (GAFTA), which came into full force in January 2005, appears to demonstrate some initial promise in boosting trade flows (Abedini & P´eridy 2008), but a full accounting of its true impact remains to be done.
These attempts at trade promotion have also been accompanied by an ever-increasing proliferation of regional economic blocs, such as the Arab Maghreb Union, the Gulf Cooperation Council, the Council of Arab Economic Unity, and the Arab League,1 not to mention inter-regional bodies such as the Euro-Mediterranean Partnership and the Organisation of The Islamic Conference. These arrangements generally declare,inter alia, trade enhancement as an ob-jective in their texts and charters. The success of these blocs in meeting this particular objective, however, remains unclear.
The scope and complexity of these international trading arrangements— coupled with their spotty historical record of success—underscores the urgent
1
The first comprising the North African states of Algeria, Libya, Mauritania, Morocco, and Tunisia; the second link the oil-producing states of Bahrain, Kuwait, Oman, Qatar, Saudi Arabia, and United Arab Emirates; the third is composed of the Gulf and Maghreb Union countries (except Mauritania) plus Egypt, Sudan, Yemen, and the Mashreq countries (Lebanon, Jordan, Syria, and the West Bank); and the last group adds Comoros, Djibouti, Mauritania, Somalia, and Sudan.
need for an adequate understanding of the relative costs and benefits of par-ticipation in preferential trading arrangements and, more generally, of changes in the domestic import regime. Such an understanding can be important in tempering any ambivalence due to uncertainty about trade outcomes arising from reform, and can be useful in helping design mitigation mechanisms and adaptation strategies.
This paper provides estimates of the adjustment costs associated with sev-eral hypothesized changes in trade policy for Syria. In particular, it employs a partial equilibrium model of domestic demand for imports to generate esti-mates of the trade flow and fiscal revenue implications for two broad classes of hypothetical scenarios: (a) Participation in preferential trading arrangements (PTAs), in particular the to-be-implemented Association Agreement between the European Union and Syria (EUSAA); (b) Changes in the domestic import regime, including the introduction of a value added tax (VAT, currently be-ing considered by the Ministry of Finance), a reduction in the number of 11 non-zero tariff bands and the elimination of the convoluted system of municipal border taxes. Finally, we suggest a comprehensive reform that targets all of these challenges jointly.
We find that the revenue consequences of the first scenario may be substan-tial, and that an informed choice of an exclusion list for the agreement may not only significantly affect its revenue consequences, but may also markedly influence the relative vulnerability of different sectors. We show that a proper sequencing of the reform requires close attention to the fact that the Syrian im-port regime levies “nuisance” tariffs on more than 60% of tariff lines. Naturally, the final liberalization step will have a revenue impact that is perhaps larger than expected.
Our analysis of the second scenario suggests that the number of tariff bands can be reduced to a lower number, while ensuring revenue neutrality. The driving factor behind the impact of such a reform is once again the decision how to deal with the high number of nuisance rates. Both an elimination of all these inefficient tariffs and an increase of all rates to 5% will trigger a revenue impact of a large magnitude. We further show that the elimination of additional import taxes is a realistic option. More specifically, revenue neutrality can be attained by implementing a VAT of sufficient but reasonable size.
Our policy simulations are implemented using the Tariff Reform Impact Sim-ulation Tool (trist), developed at the World Bank. The model is based on a representative consumer with Armington (1969)-style preferences, who makes choices over traded goods in three consecutive steps: First, by substituting between different exporters following relative price changes between their re-spective products; second, by substituting between imports and domestically-produced goods following relative price changes between them; and third, by changing their demand for the good in question as a result of the change in the overall price of the product (Brenton, Saborowski, Staritz & von Uexkull 2009).2 A similar setup has been widely adopted in applied trade models, such
2
as single- or multi-country computable general equilibrium (CGE) models. Although the analysis that we perform in this paper is partial equilibrium in nature, there are several reasons why this is reasonably warranted in the Syrian context. First, little is known about the production structure of the Syrian economy. Up till the 1990s, Syrian output was dominated by state-owned enterprises operating under a highly centralized structure. Since then, Syrian output has experienced a rising share of the private sector, mainly in the form of small and medium enterprises (SMEs). As a consequence, data for the production side of the economy remain scarce,3 and are potentially unreliable.
Second, while Syrian exports have demonstrated a steady decrease in concen-tration over the past decade, imports have remained largely diversified. Herfind-ahl indices for exports fell from 0.62 in 2001 to 0.14 in 2007,4while Herfindahls for imports averaged 0.03 (with standard deviation of 0.04) over the same pe-riod. This suggests that the production structure of the economy is in a state of flux, and hence for the purposes of analysis it is more helpful to concentrate on the action on the demand side. Moreover, given the medium to long-run nature of general equilibrium analysis, the immediate impact of short-run changes— which are mainly concentrated on the demand side—is more important for the purposes of understanding direct adjustment costs and designing appropriate mitigation mechanisms.
Third, the partial equilibrium model used is sufficiently simple and straight-forward that any assumptions made, especially with regard to underlying pa-rameters, remain transparent and replicable. Importantly, this implies that government officials can adapt the model to their own prior assumptions and scenarios, and run policy-relevant simulations of their own, in lieu of direct tech-nical assistance from external experts. This increases government participation from the client country, as well as ownership of any results that we report.
The trade policy literature identifies three main barriers to tariff reform. First, there may be concern about the fiscal implications of reform, especially with regard to lost revenue (Mitra 1992). This is often more acute in developing economies, where capacity constraints related to the collection technology are usually more binding; tariffs and trade taxes are often preferred due to the relative simplicity of their administration and enforcement. Moreover, intra-government conflict over which body would bear the burden of tariff removal may further delay socially-beneficial reform Alesina & Drazen (1991). Second, there may be uncertainty over the beneficiaries of tariff reform. This point was first made in the context of trade policy reform by Fern´andez & Rodrik (1991), who argue that this uncertainty leads to an impasse among involved agents and a bias toward the status quo. Third, there are political economy
produced goods as perfectly inelastic.
3
The World Bank, as part of its technical assistance on human development, is currently in the process of compiling an updated social accounting matrix for Syria. However, this program is in its preliminary stages and data are currently unavailable as inputs for analytical purposes.
4
2007 is the latest year for which data are available. Herfindahls are calculated from 4-digit HS lines and normalized assuming the full quorum of 1,213 lines is met, such that the support for these values are given by [0,1].
factors that may lead to resistance against tariff reform. Lobbying activity by special interest groups can lead to a situation where protection is observed in (political) equilibrium (Grossman & Helpman 1994). Even in the absence of such special interest pressures, the response to general-interest voting behavior—in particular the tariff preferences of the median voter—may induce tariff barriers in specific sectors (Mayer 1984).
By quantifying the fiscal impact of trade adjustment, this paper aims to directly address the first and second channels by which trade reform may be delayed. To tackle the first issue, we consider scenarios where we explicitly target inefficiencies in the system and seek to uncover driving factors in ensuring that the respective reforms remain largely revenue-neutral. In addition, since the model we use makes any expected losses transparent, the burden of reform— as well as the likely bearers of this burden—would be precisely articulated. This transparency is also key to ensuring that uncertainty over the possible benefits of trade reform do not paralyze the relevant policymakers. Finally, we are of the view that a clear accounting of the adjustment costs associated with tariff reform can also inform key stakeholders and improve the outcomes that result from political-economic activity. For example, if notions of fairness play a nontrivial role in influencing the perceptions of voters (Davidson, Matusz & Nelson 2006), then making clear the relative costs of trade adjustment can facilitate the process of trade liberalization.
The literature on trade reform in Syria is relatively thin. Chemingui & Dessus (2008) utilize a computable general equilibrium (CGE) model to assess the costs of nontariff barriers in Syria, and estimate that the effective protection afforded by such technical barriers to trade amount to more than twice that of tariffs. However, while their model considers important policy exercises—such as the full dismantling of tariffs and quantitative restrictions, and a removal of foreign exchange restrictions—some of these policy proposals have already come to pass (notably the unification of the parallel exchange rate regime), and their study is focused on the costs of nontariff, rather than explicit tariff, barriers. Gait´an & Lucke (2007) conduct policy experiments along similar lines using a dynamic CGE model, with a stronger focus on PTAs. Unlike this paper, their analysis is focused on examining changes in macroeconomic aggregates as well as output at the sectoral level, rather than fiscal considerations.5 Finally, Abedini & P´eridy (2008) econometrically estimate the trade effects due to GAFTA, using a modified gravity model. While their work, like ours, works with commodity-level data, the paper concerns itself mainly with the effect of GAFTA on realized trade flows, not adjustment costs.
The paper is organized as follows. Following this introduction, we sketch the model (Section 2) that underlies our the simulation results (Section 3), which include the broad scenarios outlined above. We conclude with reflections on the way forward for further consolidating import liberalization in Syria.
5
2
A Simple Model of Tradable Goods Demand
Consider an economic environment comprised of goods indexed byi= 1, . . . , n
goods originating from countries indexed byj = 1, . . . , m. Let a small, open economy be comprised of a single representative consumer possessing standard Armington (1969)-type preferences given by6
U(x,x∗) =U(x1, . . . ,xn,x∗1, . . . ,x∗n), (1)
where x∗i = [x∗i1· · ·x∗im] is the vector of imports of a given good i from each
of the m countries, and xi = [xi1· · ·xim] is the vector of analogous goods
produced at home. For simplicity, we follow the literature and assume that (1) is homogeneously separable in thengoods, so that we can rewrite this as
U(x) =V (v1(x1,x∗1), . . . , vn(xn,x∗n)),
where vi(xi,x∗i) are indexes of consumption of each type of good (both home
and foreign, respectively). These indexes further nest sub-indexes of goods among competing producers; which are weakly separable between home and foreign goods:
vi(xi,x∗i) =W(wi(xi), wi(x∗i)),
as well as (weakly separable) sub-indexes of goods between competing national exporters:
wi(x∗i)≡w(x∗i1, . . . , x∗im).
We make the further assumption that both the top-level utility functionV(·)
and the second-level sub-utility functions vi(·) and wi(·) possess a constant
elasticity of substitution (CES) form, so we can write a given (representative) sub-utility function as
wi(x∗i) =w
h
βi1(x∗i1)
−ρ
+. . .+βim(x∗im)
−ρi−1ρ
,
whereP
mβi = 1 andρ >−1. The consumer faces a vector of corresponding
prices p = [p11· · ·p1m· · ·pn1· · ·pnm], and will maximize (1) subject to the
budget constraint px′ = y, where y is national income. (Armington 1969)
shows that this leads to standard CES-style product demand functions
xij=βσ ES ij xi
pij
pi −σES
,
6
The limitations of imposing Armington-type preferences on consumers are well docu-mented (Lloyd & Zhang 2006). For our purposes of analyzing scenarios associated with trade policy changes, however, two concerns are relevant: First, that the monopoly power associ-ated with each exporting country overstates the terms of trade effects of tariff elimination, and second, that the absence of product variety changes understates welfare gains. We address the first concern directly, by providing sensitivity analyses for the preference parameters that we assume. We address the second issue somewhat indirectly, by focusing on the trade flow and trade revenue effects, rather than welfare effects, of the different scenarios.
wherexi andpi are indexes of goods and prices, respectively, andσES ≡ 1+1ρ
is the elasticity of substitution between different exporters of a given product. The formulation of this demand function shows how the substitution of prod-ucts in consumer demand works in this class of models: the Armington model treats substitution between products as imperfect (and as dependent on the substitution elasticity). Analogous demand functions can be derived for the total demand for goodi,XT D
i , as a function of the relative price of goodiand
the price elasticity of demand,σP, and for the demand for imports relative to
domestic production.
Taking the model discussed above as its theoretical foundation, the empirical model that we take to the data makes some further assumptions: it normalizes the world market price of each product to unity and models its market separately from all other products.7 A product’s price is thus equal to one plus any tariff and import charges levied on it at the border. We further assume that any changes in tariffs and charges are perfectly passed through to the final consumer. On the basis of this Armington (1969)-style model, price changes impact demand for a product from a given supplier through two channels: through an exporter substitution effect, which is the consumption response to relative price changes between different national suppliers; and through a demand—or income—effect, as consumption of a product changes in response to a change in its overall price. The strength of the two effects is determined by the vec-tor
σPσES
of elasticity parameters. The precise calculation steps have been documented in Brentonet al. (2009) and are, for completeness, reproduced in the technical appendix. Due to data limitations on the domestic production side, however, an additional domestic substitution channel—the consumption response to the relative price change of the imported product relative to its domestically produced equivalent—cannot be taken into account.
Implicit in our empirical model is at least one additional assumption: since demand responses are based on elasticities, there will never be market entry by new exporters as a result of price changes (zero trade flows will always remain unchanged at zero).
This paper extends the standard trist model described in Brenton et al.
(2009) in two ways. First, we advance the static simulations associated with a single year to include dynamic simulations that take into account multi-year tariff liberalization scenarios. Second, we include scenarios that allow for vari-ations in other categories of border-related charges, such as the spending tax and the revenue tax, as well as the implementation of a VAT.
7
3
Analysis of Trade-Related Adjustment Costs
3.1
Description of data
We use proprietary data provided by Syrian Customs, collected via the newly-implemented Automated System for Customs Data (asycuda) system, for Syr-ian customs posts employing the system over the period between January and end-July 2009. The dataset comprises information on all import transactions, including information on trading partners, c.i.f. import values, collected tariff revenue and tariff exemptions, as well as all additional charges applied at the border. The data also include information on customs procedure codes (CPC), which allow us to exclude imports from the data set that do not enter the Syrian market for the sole purpose of private domestic consumption.8
asycuda has, to date, only been partially implemented. According to the Customs directorate, the system covered 75% of all Syrian imports in January 2009. This share has been steadily increasing since, reaching 85% in June 2009, and is expected to attain almost full coverage (98%) by the end of 2009. For the purpose of this study, this data limitation is not unproblematic. However, the Syrian customs authorities have verified that the data present a fairly rep-resentative sample of imports across products and trading partners.9
The dataset comprises Syrian imports on a total of 3,183 tariff lines and 126 trading partners. The total value of imports amounts to SYP 607.3 billion. On these imports, SYP 39.3 billion worth of tariff revenue and SYP 66.8 bil-lion worth of overall trade tax revenue (including tariff revenue) were collected. Collected tariff revenue thus makes up 58.9% of overall trade tax revenue. The statutory tariff rate across all tariff lines, calculated as a simple average, is 11.1% (the import-weighted average is 7.0%). The equivalent numbers for the collected tariff rate are 10.7% and 6.5%, respectively. These figures suggest that tariff ex-emptions granted at the Syrian border are substantial but not excessively large compared with other middle income economies. A simple simulation using the model described in Section 2 shows that a trade reform that eliminates all tariff exemptions would increase Syrian tariff revenue by about SYP 2.6 billion, which is equivalent to 6.5% of the current total.
Table 1 illustrates how tariffs are distributed across tariff bands for trad-ing partners with whom Syria is currently not involved in a preferential trade agreement.10 The table differentiates 11 non-zero tariff bands that correspond to the 11 actual bands in the Syrian tariff schedule (1, 3, 5, 7, 10, 15, 20, 30, 40, 50, and 60%). As can be seen, the distribution of statutory tariffs is highly
8
These include, for example, goods in transit, government imports, and goods destined for warehousing.
9
It is possible to make simple extrapolations, based on our knowledge of the extent of coverage across time, in order to recover reasonable numbers that are applicable at the national level for the full calendar year. More specifically, given the preceding discussion, we suggest a multiplication factor close to two for all numbers not expressed in percentage terms.
10
Notice that this implies that the total of 2,895 tariff lines is lower in this table than the total across all countries (3,183 tariff lines) including those in preferential trade agreements with Syria.
skewed. More than 60% of tariff lines are subject to so-called nuisance tariffs (tariffs below 5%). The remaining tariff lines are relatively evenly distributed across the rest of the tariff bands.
Table 1: Distribution of tariff lines by bands, Syria, 2009†
Statutory tariff Collected tariff
Bands Lines Share of Share of Lines Share of Share of
total (%) imports (%) total (%) imports (%)
0–0.5 2 0.1 0.0 39 1.3 3.7
0.5–2 1,087 37.5 44.9 1,080 37.3 42.1
2–5 547 18.9 20.5 329 11.4 18.2
5–8 170 5.9 6.8 382 13.2 9.0
8.5–12.5 252 8.7 4.1 252 8.7 4.1
12.5–17.5 147 5.1 3.6 146 5.0 3.6
17.5–25 138 4.8 1.9 136 4.7 1.9
25–35 149 5.1 1.4 142 4.9 1.3
35–45 73 2.5 7.0 72 2.5 6.4
45–55 327 11.3 2.2 314 10.8 2.0
55–60 3 0.1 1.7 3 0.1 1.7
†
Intervals chosen to be broadly reflective of 10 actual Syrian tariff bands, and ranges are given with upper (but not lower) bound inclusive. Statutory and collected rates can differ from actual bands defined by Syrian customs authorities because averages are computed across all trading partner groups, which may include countries exempt from a given tariff.
Collected tariff rates are even more skewed towards lower rates. The data reveal that, taking into account tariff exemptions, 3.7% of tariff lines are subject to tariffs close to zero whereas only two tariff lines are subject to statutory tariffs of 0.5% or below. This finding emphasizes the importance of taking into account tariff exemptions and highlights that, for any effective reform of the Syrian trade regime, it will be crucial to pay close attention to products on which nuisance tariffs are levied, as this is where a large share of the burden of tariff collection ultimately falls.
As a check for the consistency of the dataset with other published trade data, we compare the 10 most important import partners and products (by 3-digit isic code) for 2007 and 2009 (Table 2), using UN comtrade data for 2007 and Customs’ asycuda data for 2009. The data exhibit a significant degree of overlap. 7 of the top 10 partners (8 if we allow the fact that EU imports are mainly from Italy) are common across the two years, as are 7 of the top 10 products. The China, the EU, Turkey, and Arab countries such as Egypt and Saudi Arabia are, unsurprisingly, among Syria’s most important trading partners.
Table 2: Comparison of top 10 trading partners and import products, Syria, 2007 and 2009†
Partners Products
2009 2007 2009 2007
Country Share Country Share ISIC Product Share ISIC Product Share
(%) (%) (%) (%)
China 9.6 Russia 9.8 11 Crops 18.1 232 Refined petroleum 31.7
Egypt 8.4 China 8.0 241 Chemicals 13.9 271 Iron and steel 10.7
South Korea 8.1 Italy 6.9 341 Motor vehicles 10.2 241 Chemicals 8.0
Saudi Arabia 6.4 Ukraine 5.8 271 Iron and steel 6.1 341 Motor vehicles 6.5
Turkey 6.3 Saudi Arabia 5.7 242 Other chemicals 5.6 11 Crops 4.7 EU 6.2 Malta 5.5 292 Special machinery 4.7 154 Other food 3.2 bf Ukraine 6.1 South Korea 5.0 151 Processed food 4.0 291 General machinery 3.1
Russia 3.3 Egypt 4.6 153 Grain mill products 3.1 272 Metals 3.0 Germany 3.1 Turkey 4.4 269 Non-metallic minerals 3.0 242 Other chemicals 3.0 Jordan 2.5 India 3.9 291 General machinery 2.9 292 Special machinery 2.2
†2007 data are from the UNcomtradedatabase, while 2009 data are from Syrian Customs’asycudadatabase. Countries or products in bold
are common across both years. Shares are calculated as shares of total imports.
excess of a hundred other possible additional charges, some of which are levied on the import declaration rather than by imported item.11 In the simulations that follow, we focus on the three major revenue-generating sources—tariffs, the spending tax, and the revenue tax—and aggregate all other charges into an additional category in order to maintain transparency.12 We also aggregate import values and trade tax revenues across four trading partner groups, consis-tent with their importance within the Syrian import regime. These are Turkey, GAFTA, the EU, and the Rest of the World (ROW).13
3.2
Trade policy scenarios
We apply the model described in Section 2 to two broad classes of policy sce-narios: (a) Participation in PTAs; and (b) Changes in the domestic import regime. We illustrate the first scenario by considering both the static as well as dynamic effects of the forthcoming EUSAA. We conceive of the second as a rationalization of border charges that simplifies the number of tariff bands, and the concurrent introduction of a VAT coupled with the elimination of other trade taxes. We then analyze a comprehensive reform scenario that targets all these challenges simultaneously.14
In all our baseline scenarios, the simulation assumes model elasticity param-eters that equal toσP = 1.5 andσES = 0.5 (default elasticities). These
elastici-ties are fairly standard in the literature, although we recognize that country- and time-specific idiosyncrasies may call for variations to this default. Accordingly, in our robustness subsection, we allow for these parameters to systematically vary, and consider the sensitivity of our findings to variations in these parame-ters.
The two PTAs that are currently of greatest relevance to Syria are the Syria-Turkey bilateral and GAFTA. Syria has also (re)initialed the EUSAA in Decem-ber 2008, and the agreement is currently awaiting ratification in the European Parliament. Given the importance of the European Union as a trading partner for the Syrian economy, the trade and revenue consequences of the agreement are of major concern to Syrian policymakers.
11
Given that the latter charges are of a small magnitude, we simplify by distributing them evenly across items in a given declaration.
12
In the Syrian customs regime, tariff revenue is calculated as a percentage of the c.i.f. import value, and both the spending and the revenue tax are calculated as a percentage of the tariff inclusive import value. Some of the other taxes and charges are weighted averages of various different tax bases. In order to remain transparent, we have chosen to deal with the aggregative “all other charges” category by defining it as a percentage of the c.i.f. import value only.
13
The results presented in the subsequent section are, however, not sensitive to a change in the number of country groupings used.
14
The EUSAA is to operate following a schedule that sequences in the re-forms over a period of 12 years. As a benchmark, however, we first consider a single-phased agreement (Table 3), with three alternative degrees of residual protection, as represented by the coverage of the exclusion list: (a) no exclusion list (column 1); (b) 10 percent coverage (column 2); and (c) 20 percent coverage (column 3), with the specific items on the exclusion list chosen to minimize the revenue impact of the agreement.15 It is important to emphasize that this is not to advocate the Syrian government to choose an actual exclusion list along these lines, i.e. to minimize the revenue impact of the reform. This would run counter to the purpose of the agreement. Given that Syrian policymakers may, on various grounds, decide to exclude certain products from liberalization as part of the agreement, the objective of this exercise is to offer a range rather than a point estimate of the likely magnitude of the reform impact and to il-lustrate that the choice of the exclusion list is an important determinant of the relative vulnerability of different sectors of the Syrian economy.
The first three rows of Table 3 report the impact of the reform scenario on imports, while the next three illustrate the impact on tariff revenue. The final two blocks report ancillary information, in particular the impact on total revenues received from taxation of imports, and the corresponding applied rates on collected tariffs.
The impact of the EUSAA, as measured by changes in protection and result-ing prices, is highly asymmetric. Table 4 lists the 20 (ISIC) sub-sectors that will experience the largest negative product price changes as a result of the EUSAA, and also aggregates this information for each ISIC 1-digit sector. The calcula-tions for this exercise are performed for the “no exclusion list” (upper panel) and “20 percent exclusion list” (lower panel) scenarios. The results indicate that the extent to which sub-sectors are impacted by the agreement in terms of changes in protection and import prices is extremely heterogeneous across sub sectors. Whereas sub-sector 742 (architectural, engineering and other technical activities) experiences a reduction in protection from 30% to zero and an av-erage import price change of 34.6% when no exclusion list is used, most other sub-sectors are affected only marginally.
The tables also show that a given choice of exclusion list can greatly impact the relative vulnerability of different sub-sectors. In particular, sub-sector 742 is not even among the 20 most affected sectors when the 20% exclusion list is used. Similarly, whereas sector D (manufacturing) experiences the largest import price change in the scenario without an exclusion list, it is much better shielded from the impact of reform when the 20% exclusion list is used. Consequently, sector C (Mining and quarrying) becomes the sector experiencing the largest reduction
15
According to WTO rules, preferential trade agreements must be characterized by a re-ciprocal rather than a unilateral reduction in tariffs. Article 24 of the General Agreement on Tariffs and Trade (GATT), however, emphasizes that certain sectors can be excluded from liberalization by calling for a liberalization of “substantially all trade” only. This clause is commonly interpreted as demanding a liberalization of at least 80% of all trade between the parties to the agreement. In principle, the countries involved are free to choose the 20% of trade for which tariffs are to be left unchanged.
Table 3: Static trade impact of a single-phased Association Agreement with the EU†
No exclusion list 10% exclusion list 20% exclusion list
Impact on imports
Imports pre 607,312,981,450 607,312,981,450 607,312,981,450 Imports post 611,093,944,743 608,965,331,505 608,370,484,069
Change (%) 0.6 0.3 0.2
Impact on revenue
Tariff revenue pre 39,348,020,532 39,348,020,532 39,348,020,532 Tariff revenue post 29,768,695,215 35,976,638,484 37,246,276,758
Change (%) -24.3 -8.6 -5.3
Total import tax revenue
Total revenue pre 66,777,996,534 66,777,996,534 66,777,996,534 Total revenue post 56,994,102,839 63,342,130,268 64,635,837,148
Change (%) -14.7 -5.1 -3.2
Collected tariff rates
Tariff rate pre 6.5 6.5 6.5
Tariff rate post 4.9 5.9 6.1
Change (%) -24.8 -8.8 -5.5
†
Scenarios simulated assuming elasticity parameters ofσP = 0.5 andσES = 1.5. Exclusion lists were selected to minimize revenue impact. All tariffs on EU imports not on the EU exclusion list are set to zero.
in import prices.
We now consider the more realistic scenario of a sequential phased-in agree-ment (Table 5). We allow sequencing to occur over the 12-year period over 4 three-year liberalization steps. In the first step, tariffs on EU products are capped at 20%. The cap is reduced to 10% in the second step, 5% in the third, and in the final step, tariffs are eliminated completely.16 We also assume the absence of an exclusion list at this point; the numbers shown should therefore be interpreted as an estimated upper bound on the projected impact of the agreement.
The aggregate impact of the sequential implementation of the EUSAA on tariff revenue and overall trade tax revenue is very similar to the impact of the static scenario discussed previously. Of relevance in policy terms is the finding that the last liberalization step generates by far the largest losses in revenue. It reduced tariff revenue by 11.6% and overall trade tax revenue by 6.5%, with the average collected tariff rate falling from 5.5% to 4.9%. This is unsurprising, given the large number of nuisance tariffs in the Syrian import
16
Table 4: Largest changes in protection and prices due to the EUSAA, by sector and subsector†
ISIC Sector Protection Price
change (%) change (%) Without exclusion list
A Agriculture -8.9 -0.3
B Fishing 0.0 0.0
C Mining and quarrying -44.1 -0.6
D Manufacturing -27.4 -1.5
E Utilities 0.0 0.0
F–Q Services -6.0 -0.1
742 Architectural -100.0 -34.6
181 Apparel -38.6 -11.9
342 Motor vehicle bodies -73.3 -11.8 314 Accumulators and cells -48.6 -10.4
192 Footwear -26.1 -7.7
322 Tele/radio transmitters -88.2 -6.9 343 Motor vehicle parts -50.1 -6.4 12 Animal farming -97.1 -5.8 341 Motor vehicles -24.4 -5.1 332 Optical instruments -45.2 -3.8
191 Leather -17.7 -3.8
293 Domestic appliances -18.0 -3.1 331 Medical appliances -55.0 -2.7
221 Publishing -86.3 -2.6
313 Wire and cable -69.0 -2.5 242 Other chemicals -70.5 -2.3 173 Knitted fabrics -15.1 -1.8 289 Other fabricated metal -33.3 -1.7 323 Tele/radio receivers -10.2 -1.7
361 Furniture -11.7 -1.7
With 20% exclusion list
A Agriculture -2.9 -0.1
B Fishing 0.0 0.0
C Mining and quarrying -42.2 -0.6
D Manufacturing -5.6 -0.4
E Utilities 0.0 0.0
F–Q Services -0.6 0.0
12 Animal farming -94.6 -5.6
221 Publishing -83.6 -2.5
331 Medical instruments -46.6 -2.3 322 Tele/radio transmitters -20.8 -1.7
101 Coal mining -100.0 -1.5
103 Peat extraction -100.0 -1.5
352 Locomotives -66.4 -1.4
242 Other chemicals -40.8 -1.4 289 Other fabricated metal -17.9 -1.0 172 Other textiles -16.6 -0.9
142 Other mining -74.4 -0.9
312 Electricity distribution -34.9 -0.9
152 Dairy -27.7 -0.8
313 Wire and cable -17.2 -0.7 319 Other electrical -11.9 -0.7 315 Lighting equipment -8.7 -0.7 291 General purpose machinery -19.9 -0.6
252 Plastics -20.2 -0.6
232 Refined petroleum -56.3 -0.6 343 Motor vehicle parts -3.9 -0.6
†For comparability, one-digit ISIC sectors are reported.
Subsec-tors are chosen and ordered by largest price changes, assuming elasticity parameters ofσP= 0.5,σDS= 1.0, andσES= 1.5.
Table 5: Dynamic trade impact of a multi-phased Association Agreement with the EU†
20% cap 15% cap 10% cap Zero tariffs
Impact on imports
Imports pre 607,312,981,450 608,387,063,238 609,222,938,398 609,925,251,710 Imports post 608,387,063,238 609,222,938,398 609,925,251,710 611,757,647,812
Change (%) 0.2 0.1 0.1 0.3
Impact on revenue
Tariff revenue pre 39,348,020,532 36,745,153,031 34,864,135,417 33,329,678,556 Tariff revenue post 36,343,585,084 34,690,661,271 33,257,455,209 29,474,493,614
Change (%) -7.6 -5.6 -4.6 -11.6
Total import tax revenue
Total revenue pre 66,777,996,534 64,167,123,489 62,282,566,245 60,746,489,382 Total revenue post 63,711,349,361 62,070,597,188 60,637,719,079 56,808,514,072
Change (%) -4.6 -3.3 -2.6 -6.5
Collected tariff rates
Tariff rate pre 6.5 6.0 5.7 5.5
Tariff rate post 6.0 5.7 5.5 4.8
Change (%) -7.8 -5.7 -4.7 -11.8
†Sequencing of agreement implemented in 3-year liberalization steps, undertaken over 12 years,
with indicated tariff caps applied on EU imports. Scenarios simulated assuming elasticity pa-rameters ofσP= 0.5 andσES= 1.5, with no exclusion list.
regime, yet it does highlight that an informed design of the phase-out schedule of the agreement calls for special attention to the fact that the distribution of tariffs is highly skewed towards the lower side. Depending on the priorities of policymakers in distributing revenue losses across the 12-year period, it may be worth shifting some of the burden resulting from the last liberalization step towards earlier ones. Alternatively, the phasing-out process could be given a different structure; rather than capping tariffs at lower and lower values, a step-by-step percentage reduction in all tariffs may be preferable.
Having investigated the impact of the EUSAA, we now move to a broader analysis of the Syrian import regime which has undergone significant reform over the past decade. Three major problems that stand out in the current regime are the excessively complicated tariff structure (as evidenced by the number of non-zero tariff bands), the large number of tariff lines with “nuisance rates” (of 5% or below) applied, and the proliferation of (often arbitrary) additional charges applied at the border. All these features increase the complexity of the import regime, and make it less transparent and more costly for customs authorities to administer. The complexity of procedures is also a potentially significant source of corruption.
In a first step, we investigate the revenue implications of redesigning the tariff band structure. We assume that the new bands are defined in terms of statutory rates, with no tariff exemptions granted post reform.17 There are
17
several options for tariff band structures that would reduce the number of tariff bands. We consider three possibilities. Our first approach is to collapse the existing bands into four bands by fixing all rates above 40% at 35%, all rates above 20% and below or equal 40% at 30%, raising bands above 10% (5%) and below or equal 20% (10%) to 20% (10%), and eliminating all nuisance tariffs completely; we denote thisOption A. The second approach likewise introduces four bands. It differs from the first option only in its treatment of tariffs smaller or equal 20%. In particular,Option Bfixes bands above 10% (5%) and below or equal 20% (10%) to 10% (5%) and increases all nuisance tariffs to 5%. A third approach is to eliminate all tariffs above 40% completely, to fix rates above 20% and below or equal 40% at 35% and to raise tariffs bands above 10% (5%; 0%) and below or equal 20% (10%; 5%) to their respective upper boundaries (Option C). We summarize the implications of these various reform options in Table 6.
Table 6: Design on alternative tariff bands†
Option A Option B Option C
Old collected tariffs New collected tariffs
Tariff>40 35 35 0
Tariff>20 &≤30 30 30 35
Tariff>10 &≤20 20 10 20
Tariff>5 &≤10 10 5 10
Tariff>0 &≤5 0 5 5
Tariff = 0 0 0 0
†
Tariffs defined as collected tariffs, in percentage terms.
The first column of Table 7 highlights the impact of reform Option A on Syrian trade revenues. The figures project large revenue losses—24.9% in terms of lost tariff revenue and 14.9% in terms of lost overall trade tax revenue—that would result from the reform. This contrasts with the findings for Option B, which is projected to have an almost revenue neutral impact. As mentioned previously, the difference between the two reform scenarios is the differential treatment of tariffs lower or equal to 20%. While tariff bands between 10 and 20% are pushed to their upper limits inOption A, they are fixed at their lower limits inOption B. Conversely, nuisance tariffs are eliminated inOption Awhile they are fixed at their upper boundaries inOption B.
The highly differential impact of the two trade reform scenarios on revenues is striking but there is a straightforward explanation which, once again, involves the skewness towards low tariffs in the distribution of pre-reform tariff bands. The impact of any reform of the tariff band structure depends strongly on the treatment of nuisance tariffs as this is where a large share of tariff revenue is generated. It would be possible to generate a range of other revenue neutral reform options at this point. However, we refrain from doing this, as the final
could also be set higher to obtain the same revenue impact.
choice will be made according to the priorities of Syrian policymakers that are not, therefore, immediately obviousex ante. What we would like to emphasize, however, is that these findings suggest that revenue concerns should not be a reason to shy away from a reform that would likely involve substantial efficiency gains. In other words, a reform of the highly complicated Syrian tariff regime involving a simplification of the tariff band structure can be implemented in the absence of substantial revenue losses if an informed choice is made with respect to the differential treatment of pre-reform tariff bands.
[image:18.612.149.464.378.622.2]Finally, column 3 of Table 7 presents our model’s projections for the impact ofOption C on Syrian revenues. As mentioned previously, this reform option entails a complete elimination of all tariffs above 40%. The reason why we present this perhaps not very realistic policy option is to show that the cut (or complete elimination) of very high tariff rates is not necessarily detrimental to revenues. As shown in the example given, a slight adjustment of the remaining bands can outweigh the incurred losses. Since high tariff rates are not very fre-quent and imports on these lines typically of a low volume, this is not surprising. Given that their removal may entail a major simplification of the tariff regime and boost imports strongly, a cut of the highest tariff rates should be high on the policy agenda.
Table 7: Designs for simplification of tariff regime†
Option A Option B Option C
Impact on imports
Imports pre 607,312,981,450 607,312,981,450 607,312,981,450 Imports post 611,460,704,766 606,006,235,541 604,925,689,795
Change (%) 0.7 -0.2 -0.4
Impact on revenue
Tariff revenue pre 39,348,020,532 39,348,020,532 39,348,020,532 Tariff revenue post 29,558,562,979 40,060,651,077 40,561,116,335
Change (%) -24.9 1.8 3.1
Total import tax revenue
Total revenue pre 66,777,996,534 66,777,996,534 66,777,996,534 Total revenue post 56,822,125,433 67,376,650,753 67,845,562,213
Change (%) -14.9 0.9 1.6
Collected tariff rates
Tariff rate pre 6.5 6.5 6.5
Tariff rate post 4.8 6.6 6.7
Change (%) -25.4 2.0 3.5
†
Scenarios simulated assuming elasticity parameters ofσP= 0.5 andσES= 1.5.
number of additional import charges applied at the border, some of which are levied on import declarations rather than the import item. A reduction in the number of these charges is perhaps among the most pressing policy issues that require attention when attempting to improve the overall efficiency of Syria’s trade regime.
In the following exercise, we consider the impact of a reduction in the number of additional import charges on trade revenues, while investigating the option of concomitantly implementing a VAT to make up for projected revenue losses (Table 8). In particular, we allow for six distinct reform scenarios: First, we eliminate all trade taxes with the exception of tariffs and the spending tax (Reform A); second, all trade taxes besides tariffs are eliminated (Reform B); third (fourth), the elimination of all trade taxes is coupled with the conversion of the spending tax into a 3% (5%) VAT on all products (Reform C; Reform D); and last, the elimination of all trade taxes is coupled with the conversion of the spending tax into a 10% (12%) VAT on all consumer and capital goods (Reform E) (Reform F).
The results presented in Table 8 confirm the importance of some of the additional trade taxes as a share of Syrian trade tax revenues. An elimination of all trade taxes besides tariffs and the revenue tax would imply a reduction in revenues by 20.5%, while a simultaneous abolishment of the latter is projected to lead to imply an overall reduction of almost 40%. Consequently, caution is in order when implementing any reform involving the elimination of one or more—or even all—of these trade taxes, as the revenue impact is nontrivial.
However, columns three to six of Table 8 show that an appropriate (but still reasonable) choice of a VAT (to be implemented in 2010) may more than outweigh these losses. The advantage of a VAT—and the reason why it is so powerful in making up for revenue losses—is that it is levied on every product without exception (while concomitantly minimizing distortion). While the elim-ination of all trade taxes combined with a VAT on all products would still lead to a revenue loss of 11.2% in Reform C, Reform D, involving an only slightly increased VAT rate of 5%, is projected to ensure a considerable gain in trade revenues (of 7.2%). When we repeat these scenarios inReform E andReform F—with the modification that the VAT is now only levied on consumer goods and capital goods—the results suggest that in these cases a rate between 10% and 12% would be sufficient to keep the reform more or less revenue neutral.18 Our final policy experiment is to combine the rationalization scenarios dis-cussed in Tables 7 and 8 into one comprehensive reform, where the focus is on designing a reasonable reform that has a neutral or slightly positive impact on
18
The reason why we distinguish the case of a VAT levied on consumer and capital goods only is because the VAT on intermediate or primary products is usually subject to the possi-bility for rebate. Although the VAT will be levied on the respective final product at a later point, the primary or intermediate goods’ contribution to the value of the final product is unclearex ante. In the context of our attempt to isolate the impact of the VAT on trade revenues, the case of a VAT levied on consumer and capital goods only may give us an broad estimate of the upper bound on the VAT rate that is needed to guarantee revenue neutrality of the reform according to our model. For example, in order to generate a revenue gain of 5.8% in the case ofReform F, our model predicts that a VAT of 12% or below is needed.
Table 8: Designs for simplification of border taxes with VAT introduction†
Reform A Reform B Reform C Reform D Reform E Reform F
Impact on imports
Imports pre 607,312,981,450 607,312,981,450 607,312,981,450 607,312,981,450 607,312,981,450 607,312,981,450 Imports post 614,230,865,273 620,077,332,546 610,942,372,394 604,852,420,329 607,945,713,240 605,519,429,348
Change (%) 1.1 2.1 0.6 -0.4 0.1 -0.3
Impact on revenue
Tariff revenue pre 39,348,020,532 39,348,020,532 39,348,020,532 39,348,020,532 39,348,020,532 39,348,020,532 Tariff revenue post 40,070,814,396 40,350,538,694 39,784,073,523 39,406,408,218 38,843,164,003 38,541,670,035
Change (%) 1.8 2.5 1.1 0.1 -1.3 -2.0
Total import tax revenue
Total revenue pre 66,777,996,534 66,777,996,534 66,777,996,534 66,777,996,534 66,777,996,534 66,777,996,534 Total revenue post 53,091,086,393 40,350,538,694 59,305,866,900 71,619,349,645 65,871,464,510 70,648,297,300
Change (%) -20.5 -39.6 -11.2 7.2 -1.4 5.8
Collected tariff rates
Tariff rate pre 6.5 6.5 6.5 6.5 6.5 6.5
Tariff rate post 6.5 6.5 6.5 6.5 6.4 6.4
Change (%) 0.7 0.4 0.5 0.6 -1.4 -1.8
†
Scenarios simulated assuming elasticity parameters ofσP= 0.5 andσES= 1.5.
revenues. We consider the case in which a VAT is levied on consumer goods and capital goods only. The rate needed to guarantee revenue neutrality of the reform in our model is thus somewhat an upper bound on a realistic value.
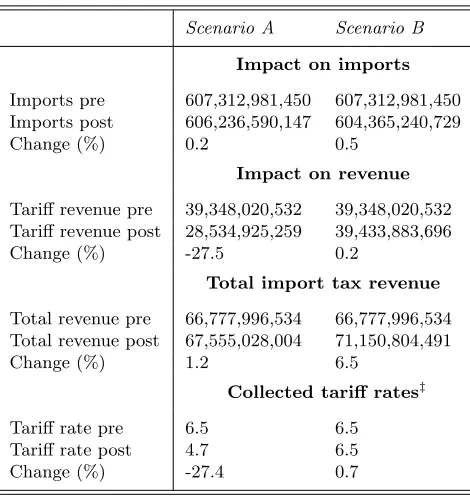
Table 9: Trade impact of two potential comprehensive reform scenarios†
Scenario A Scenario B
Impact on imports
Imports pre 607,312,981,450 607,312,981,450 Imports post 606,236,590,147 604,365,240,729
Change (%) 0.2 0.5
Impact on revenue
Tariff revenue pre 39,348,020,532 39,348,020,532 Tariff revenue post 28,534,925,259 39,433,883,696
Change (%) -27.5 0.2
Total import tax revenue
Total revenue pre 66,777,996,534 66,777,996,534 Total revenue post 67,555,028,004 71,150,804,491
Change (%) 1.2 6.5
Collected tariff rates‡
Tariff rate pre 6.5 6.5
Tariff rate post 4.7 6.5
Change (%) -27.4 0.7
†
Scenario simulated assuming elasticity parameters ofσP = 0.5 andσES= 1.5.
‡
Collected tariff rate refers to rate on applied tariffs.
Table 9 suggests that the combination of the tariff band reformOption A, which has a projected trade tax revenue loss of 14.9%, along with the elimina-tion of all addielimina-tional trade taxes (amounting to -39.6%) could be held revenue neutral if a VAT of 15% on consumer and capital goods were to be implemented simultaneously. Similarly, tariff band reformOption A(with a projected trade tax revenue gain of 0.9%), when combined with the elimination of all additional trade taxes (of -39.6%) and a VAT of 12% on consumer and capital goods, could even result in a considerable gain in revenues (of 6.5%). Note that, as discussed above, the VAT rates needed in these reforms to keep them revenue neutral in our model are upper bounds on the true values, given that VAT is typically levied on all products.
3.3
Robustness of scenarios
We test the robustness of our results in Subsection 3.2 by considering variations in the elasticity parameter vector
σPσES
. We choose three scenarios—the first three in each of our major classes of policy reform—for which we present variations in tariff and overall trade tax revenue changes in response to variations in
σPσES
[image:22.612.194.419.301.563.2] [image:22.612.192.419.303.563.2]. While, in the interests of keeping the robustness results reasonably transparent, we do not report sensitivity results for all scenarios, nor do we present estimates for changes in all the variables of interest. Nonetheless, the results offer a good general impression of the sensitivity of the results to changes in the model’s key parameters. These sensitivity checks are summarized in Table 10, with tariff (trade tax) revenue losses reported on the left (right) half.
Table 10: Sensitivity of changes in tariff and trade tax revenue losses, by scenario†
Tariff revenue Trade tax revenue
EUSAA with no exclusion list
σES σES
σP 1.0 1.5 3.0 σP 1.0 1.5 3.0
0.3 -23.8 -24.8 -27.5 0.3 -14.5 -15.1 -16.7 0.5 -23.3 -24.3 -27.0 0.5 -14.0 -14.7 -16.3 1.0 -22.1 -23.1 -25.7 1.0 -12.9 -13.6 -15.2
Tariff option A
σES σES
σP 1.0 1.5 3.0 σP 1.0 1.5 3.0
0.3 -25.3 -25.4 -25.8 0.3 -15.3 -15.4 -15.5 0.5 -24.8 -24.9 -25.2 0.5 -14.9 -14.9 -15.0 1.0 -23.5 -23.6 -23.9 1.0 -13.8 -13.8 -13.9
Comprehensive scenario A
σES σES
σP 1.0 1.5 3.0 σP 1.0 1.5 3.0
0.3 -26.9 -27.1 -27.5 0.3 2.5 2.4 2.0 0.5 -27.3 -27.5 -27.9 0.5 1.3 1.2 0.9 1 -28.4 -28.5 -28.8 1 -1.8 -1.8 -1.9
†All numbers reported in percentage terms.
tar-iff revenues also decreases revenues for the latter. An increase in the demand elasticity generates a stronger increase in imports as a response to a given tariff liberalization. This increases both tariff and trade tax revenues. The reasoning is similar for the case of a reduction in other trade taxes. The key difference is that trade taxes do not form part of the tax base for tariffs, such that the fall in revenues from, say, the spending tax or the revenue tax does not directly reduce tariff revenues.
4
Conclusion
The ability to successfully implement any trade policy reform, as well as a reasonable evaluation of itsex post impact on national welfare, is often tied to the quality ofex ante evaluations of trade-related adjustment costs. Estimates of these adjustment costs are crucial in building the political-economic case for reform, as well as for practically implementing mitigation and adaptation policies.
This paper seeks to provide these estimates for Syria, which is an interesting case both because it is an economy that is transitioning from a centrally planned system—which has led to a proliferation of border charges applied by multiple actors—as well as because it highlights the tremendous efficiency gains that are possible from tariff rationalization, even when revenue neutrality is to be maintained. These estimates show that the impact on revenue can be close to neutral, while the efficiency gains in terms of resulting cost savings are likely to be substantial.
These results can be used to inform the existing policy debate. The dif-ferent reform options considered show how an informed design of the reform alternatives can lead to substantial differences in the magnitude of their impact on the Syrian economy, both in terms of revenues and protection. Ensuring that revenue neutrality is preserved during tariff reform may engender greater acceptance among government bodies concerned that fiscal integrity would oth-erwise be compromised. Moreover, in scenarios where a clear set of losers can be identified, our results provide estimates that can be used in the design of compensatory mechanisms. These subsidies may even lead to Pareto-improving reform outcomes that would otherwise be regarded as politically unpalatable (Davidson, Matusz & Nelson 2007).
The most straightforward way forward for further consolidating import lib-eralization in Syria therefore calls for a reduction in the number of tariff bands that are currently applied, from the existing 11 to perhaps 3 or 4 bands, with the lower bound for ad valorem tariffs held at or above the nuisance level of 5%. In addition, the myriad number of fixed and proportional trade taxes can be removed with revenue neutrality ensured by the implementation of an ap-propriately sized VAT.
References
Abedini, Javad & Nicolas J. P´eridy (2008). “The Greater Arab Free Trade Area (GAFTA): An Estimation of its Trade Effects”. Journal of Economic Integration23(4) (December): 848–872
Alesina, Alberto F. & Allan Drazen (1991). “Why are Stabilizations Delayed?” American Economic Review81(5) (December): 1170–1188
Armington, Paul S. (1969). “A Theory of Demand for Products Distinguished by Place of Production”.IMF Staff Papers16(1) (March): 159–178
Brenton, Paul, Christian Saborowski, Cornelia Staritz & Erik von Uexkull (2009). “Assessing the Adjustment Costs of Trade Policy Reform Using TRIST (Tariff Reform Impact Sim-ulation Tool)”. World Bank Policy Research Paper 5045, Washington, DC: The World Bank
Chemingui, Mohamed Abdelbasset & S´ebastien C. Dessus (2008). “Assessing Non-Tariff Barriers in Syria”.Journal of Policy Modeling30(5): 917–928
Davidson, Carl, Steven J. Matusz & Douglas R. Nelson (2006). “Fairness and the Political Economy of Trade”.The World Economy 29(8) (August): 989–1004
Davidson, Carl, Steven J. Matusz & Douglas R. Nelson (2007). “Can Compensation Save Free Trade?” Journal of International Economics71(1) (March): 167–186
Fern´andez, Raquel & Dani Rodrik (1991). “Resistance to Reform: Status Quo Bias in the Presence of Individual-Specific Uncertainty”. American Economic Review 81(5) (Decem-ber): 1146–55
Gait´an, Beatriz & Bernd Lucke (2007). “The Barcelona Initiative and the Importance of NTBs: A Dynamic CGE-Analysis for Syria”. International Economics and Economic Policy4(1) (April): 33–59
Grossman, Gene M. & Elhanan Helpman (1994). “Protection for Sale”.American Economic Review84(4) (September): 833–850
Lloyd, Peter J. & Xiao-Guang Zhang (2006). “The Armington Model”.Staff Working Paper
31921, Melbourne, Australia: Australian Productivity Commission
Lucke, Bernd (2001). “Fiscal Impact of Trade Liberalization: The Case of Syria”. In Proceed-ings of the 75th International Conference on Policy Modeling. Brussels, Belgium
Mayer, Wolfgang (1984). “Endogenous Tariff Formation”.American Economic Review74(5) (December): 970–985
Mitra, Pradeep (1992). “The Coordinated Reform of Tariffs and Indirect Taxes”.World Bank Research Observer7(2) (July): 195–218
Technical Appendix
The precise calculation of the price change resulting from a trade policy change depends on how a country applies its tariffs and other trade taxes and charges. In Syria, tariffs are collected as a percentage of the c.i.f. import value, the spend-ing tax, and the revenue tax are levied on the tariff-inclusive c.i.f. import value, while other charges—such as the city local tax—are a complex combination of fixed amounts as well as percentage shares of more than a dozen different tax bases; for simplicity, however, we assume that all other charges are calculated as a percentage of the c.i.f. import value.
A given ceteris paribus tariff change for good i from exporterj leads to a percentage price change given by
∆pij =
τ′
ij−τij
1 +τij
=
1 +τ′
ij
(1 +speij) (1 +revij) (1 +remij) −(1 +τij) (1 +speij) (1 +revij) (1 +remij)
(1 +τij) (1 +speij) (1 +revij) (1 +remij)
,
(A.1)
where τij, speij, revij and remij are the tariff, the spending tax, the revenue
tax and an aggregate of all other charges applied on good i from country j, respectively, and a prime indicates the post-reform value of a variable. For what follows, we utilize the tariff change in (A.1) as the trade policy shock, and describe the demand response changes that result.
The demand response for a given product is modeled in three consecutive steps: First, the model calculates how the allocation of expenditure on imports of a product changes across different country suppliers when tariffs are amended. These relative import changes are computed from the price change in (A.1), adjusted by the elasticity of substitution between exports. To isolate just the substitution effect, total exports are held constant.19 More formally, the export substitution component of imports is calculated as
x∗ijES= 1 +σES∆pijx∗ij·
P nx∗ij P
n 1 +σjES∆pijx∗ij
, (A.2)
whereσES is the elasticity of substitution between exports from different
sup-plier countries.
Second, the model calculates how the allocation of expenditure between domestic and foreign sources of a product is affected when the relative price of imports (to domestic goods) changes in response to trade reform.20 This is implemented in two stages: First, relative demand changes are computed from
19
This involves deflating post-substitution imports from each supplier, by multiplying the ratio of total imports of the product before tariff reform to the sum of imports of the product from all trading partners after the substitution effects.
20
As mentioned in the text, this effect cannot be taken into account in the case of this paper as sufficiently detailed sectoral production data is not available for Syria.
changes in the aggregate (weighted average) price of imports, adjusted by the elasticity of substitution between domestic and foreign products. Individual suppliers then receive their share in the aggregate change in the demand for imported and domestically produced good respectively according to their share of the import market. Formally, we have
Xi∗DS= 1 +σjDS∆ ¯P
Xi∗,
x∗ijDS=x∗ijES+ Xi∗DS−Xi∗
·
x∗
ij P
nx∗ij
, (A.3)
whereσDS is the elasticity of substitution between imports and domestic
pro-duction, X∗
i = P
m P
nx∗ij is (initial) aggregate imports, and the percentage
change in the aggregate price of imports is
∆ ¯P =
n X j=1 1 2· " xij P
nxij
+ x
′
ij P
nx′ij #
·∆pij.
Third, the model calculates how a product’s domestic consumption (and thus both imports and domestic production) is affected by a change in its average domestic price. The price change is computed as a consumption share weighted average between imports and domestically produced goods. As before, this is implemented in stages, with induced consumption changes distributed across domestic and foreign sources, as well as between all importers, according to their shares in the domestic and the import markets, respectively. The calculation of total product demand requires
XiT D′ =1 +σD∆ ˜PXiT D,
Xi∗′=Xi∗DS+ XiT D′−XiT D
· X
∗
i
Xi+Xi∗
,
xij∗′=x∗ijDS+ Xi′∗−Xi∗DS·
x∗
ij P
nx∗ij
,
(A.4)
where a dash indicates a post-reform value of a variable,XT D
i is the initial total
demand for producti,σP is the price elasticity of demand, X=P m
P nxij is
(initial) demand for domestic output, and the percentage change in the aggre-gate price of imports is
∆ ˜P= X
∗
i