The Mechanism of Voltage Instability Analysis
Considering Load Characteristic
Jundong Duan, Jiaxing Huang
School of Electrical Engineering & Automation, Henan Polytechnic University, Jiaozuo, China Email: [email protected], [email protected]
Received 2013
ABSTRACT
Load characteristics are the main factor to affect voltage stability. In addition, load modeling reflecting the actual load characteristics has been a well—known difficult problem and unsolved so far, It is mainly due to the fact that the load composition, amount and characteristics are always changing. This paper introduces the slip into the equivalent imped-ance load model to analyze load characteristic, the varying slip is employed to indicate time-varying load characteristic precisely, and considering the dissimilar load behaviors, discusses node voltage, power during the changes of load cha-racteristic, obtains voltage inflexion and power inflexion, and then analyzes the mechanism of power system voltage instability based on static voltage stability region. An example indicates the feasibility of the method.
Keywords: Power System; Voltage Instability; Dynamic Load Character; Three Element Analysis Method; The Equiv-alent Impedance Load Model
1. Introduction
Load characteristic is one of the most active, direct fac-tors affecting voltage stability, which causes a dynamic change of voltage and even determines the process of voltage collapse in the extreme environment. Therefore, more and more scholars try to investigate load character-istic.
Reference [1] shows the relationship between load characteristic and voltage stability by studying the power exponent relationship between the voltage stability re-gion and the power function model. Reference [2] ana-lyzes voltage stability with load modeling according to the load characteristic space, which has a very strong generalization capability. However, the generalization capability is not enough for unknown sample space. Ref-erence [3] investigates the influence of stalling of induc-tion motor to PV curve and voltage static stability. However, it doesn’t consider the change of PV curve along with the change of the operating condition. Refer-ence [4] transforms the induction motor parameters to line parameters and describes load characteristic of in-duction motor with the constant power load model, but it does not take the instable character of induction motor into account. Reference [5] shows that the adjusting proportion of the dynamic load model will causes the changes of the instable mode by simulation, and there are different effects on the voltage stability under the differ-ent instable mode. Reference [6] studies the node critical
state according to the static voltage stability theory. It analyses the shortages of the p-v description of voltage critical state by using an equivalent circuit of the simple system. In addition, it discusses the influence on the node voltage critical position when the system operating con-dition changes, and describes the node critical state with the load impedance angle, the maximum power and the critical voltage. Therefore, it establishes a more intuitive voltage stability region to make a stability judgment.
On the basis of references[5,6] ,This paper introduces the slip into the equivalent impedance load model to analyze load characteristic, which can reflect the change of load characteristic clearly, meanwhile, discusses the changes of the node voltage and power when the load dynamic characteristic changes. By taking advantage of three element analysis method which deduces the voltage stability region of the transmission network, this paper analysis the mechanism of voltage instability considering load characteristic. At the same time, the research on load dynamic characteristic provides the basis for load modeling which could reflect load characteristic more actually.
2. System Model
chan-ger(OLTC) and the reactive power compensation devices. Therefore, the system can be equivalent to a two-node system from the testing load node to the system by The-venin equivalent theory. It shows in Figure 1.
3. The Transmission Power Characteristic of
Power System
Because of the shortages that the P-V curve changes along with the present operating condition and it's diffi-cult to get a clear steady boundary, In addition, the varia-tion quantity of voltage amplitude and angle isn't equal to the variation quantity of active power and reactive power. This paper takes three element analysis method put for-ward by references [6] to make a stability judgment.
Three-element analysis method presents a clear voltage boundary and power boundary in view of the changes of the operating condition. It describes critical state with load impedance angle, power limit, and critical voltage. The following conclusion will be held from Figure 2 two nodes system: generator-transmission-load.
1) The upper area of Vcr- curve is voltage stability region. The area under Vcr- curve is voltage instability region that the value of voltage is less than the critical value of node voltages.
2) The upper area of Pmax- curve is power instability region that the value of node power is more than trans-mission power limit. The area under Pmax- curve is power stability region.
4. Load Model Analysis
[image:2.595.310.539.259.399.2]At present, the regional power grid adopts the parallel of the induction motor and constant impedance load to si-mulate comprehensive load. Because parallel and serial is equivalent, it does not affect the electric circuit by
Figure 1. The two nodes system.
(a) (b)
Figure 2. (a) Vcr- curve and (b) Pmax- curve.
taking the induction motor and constant impedance load in series. So, comprehensive load _type model equiva-lent circuit can be shown in Figure 3.
Where: r1 + x1 is series constant impedance load,
' ' 1 2
1 2
c r jc x
s is dynamic load. The following analysis of
the proportion of constant impedance load means the proportion of series constant impedance load.
It’s necessary to analyze the change of comprehensive load impedance, because it's the substantial cause for the change of load characteristics. According to Figure 3, the comprehensive load impedance, the power factor and the critical slip can be written as follows:
'
' 1 2
1 1
( c r ) ( 1 2)
Z r j x c
s
x (1)
' 1 2 1
( )
cos
c r r
s Z
(2)
' 1 2 2
1 ( 1 1 2) cr
c r s
r x c x
' 2 (3)
where: 1
1 1 m
x c
x
.
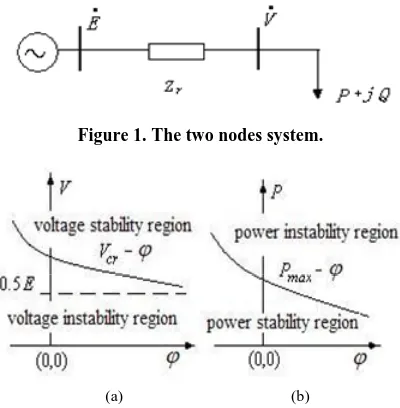
Figure 4 can be given according to (1), it shows that modulus of impedance decreases quickly with slow in-crease of the slip in 0<s<scr. however, module of load impedance changes a little with the quick increase of the slip in scr> s> 1.
Figure 5 can be given according to (2), it shows that power factor decreases quickly with slow increase of the slip in 0<s<s, while modulus of impedance changes a little with quick increase of the slip in s>s>1. Here, the s defines as the abrupt change point of power factor. Power factor changes acutely in s<s, and in s>s , the changes of power factor are unobvious.
[image:2.595.72.272.517.721.2]The increase of proportion of constant impedance load makes the Z-s curve, cos-s curve move up, improved the overall quality of modulus of impedance and power factor.
[image:2.595.315.535.603.720.2]Figure 4. Z-s curve.
Figure 5. cos-s curve.
Figure 6. -s curve
[image:3.595.337.541.204.292.2]Thus, the different slip and proportion of constant impedance dynamic load will alter the impedance of the comprehensive load, moreover affect load characteristic.
Figure 6 can be given according to (2). With micro increase of the slip, impedance angle increases rapidly, therefore, it’s convenient for further analysis to take -s
coordinate change, that it’s clear to analyze the sharp change of load characteristic causes by the module of impedance and power factor in large interval of , but not in small interval of the slip.
5. The Node Voltage and Active
Poweranalysis
In Figure 1, the node voltage and active power can be written as:
2 '
2
2 1 2 '
1 1 1
2 e
T s c r
V r x c
N r s x2
(4)
' 2
1 2 1 2
'
2 ' 1 2
1 1 1 2
c r V
P r
s c r
r x c x
s
(5)
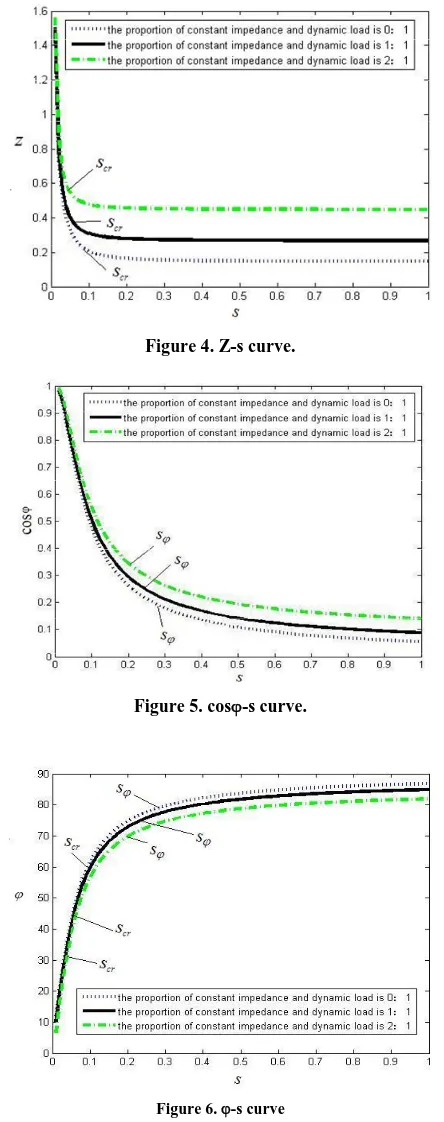
V- curve is given by (2) and (4) when torque is con-stant, which shows in Figure 6. Along with increase of the impedance angle (increase of the slip), voltage drops, and it reach minimum at s .Later, the slip keeps on increasing, on the contrary, voltage rises, P- curve is given by (2) and (5),which shows in Figure 7. Along with increase of the impedance angle (increase of the slip), the node active power increases, and it reach max-imum at scr .Later, the slip keeps on increasing, on the contrary, the active power decreases.
In Figure 7, the increase of the proportion of constant impedance load leads V- curve to move up, and the more the proportion of constant impedance load is, the more powerful the up warp will be, the less s will be, the more beneficial to the voltage recovery will be. At this time, the high current caused by the starting or blocking of motor load can't make the node voltage worse. In Fig. 8, P- curve move down with increase of proportion of constant impedance load, moreover, the more the proportion of constant impedance load is, the less scr will be; It means that the active power could be easier to comes to its maximum, but the smaller the maximum will be.
Therefore, the node voltage inflexion point influenced by load characteristic is s point (load voltage critical turning point); the amount of s determines what time it begins to recover voltage and the amount of the mini-mum node voltage. The node active power inflexion point influenced by load characteristic is scr point (load power critical turning point); the amount of scr deter-mines what time the active power begins to reach maxi-mum and the amount of the maximaxi-mum node power.
6. Example Analysis
civil motor parameters recommended by the IEEE.
Figure 7. V- curve.
[image:4.595.311.536.94.279.2]Figure 8. P- curve.
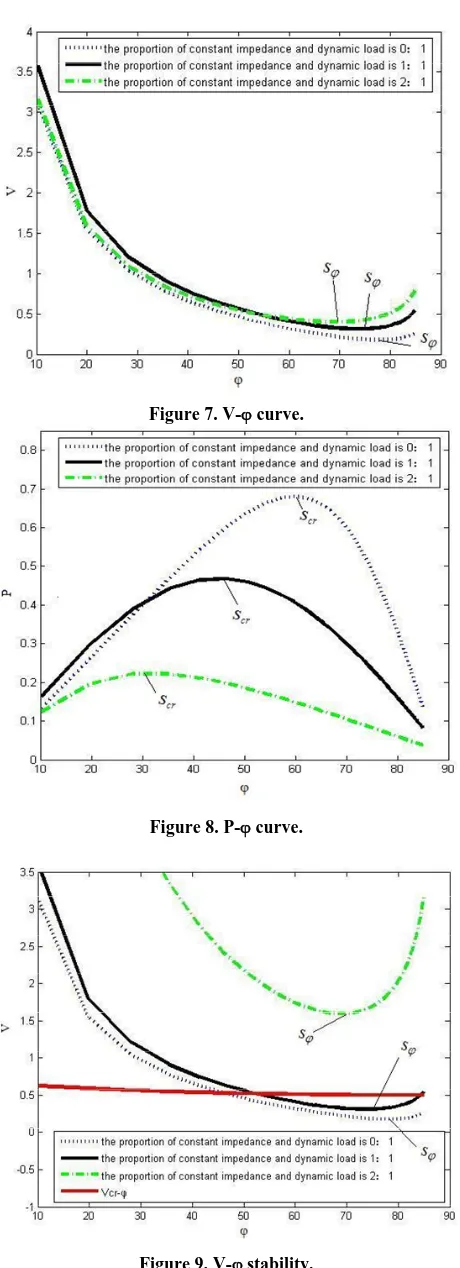
Figure 9. V- stability.
Figure 10. P- stability.
According to the Figure 2(a), 7 and Figure 2(b), 8, the node V- stable curve and P- stable curve can be obtained respectively, as shown in Figure 9 and Figure 10.
6.1. The Analysis of the Influence of Comprehensive Load Characteristic on Static Voltage Stability
Load characteristic varies along with the slip. In Fig. 9, the node voltage drops along with increase of the slip, eventually V- curve and Vcr- curve intersect, and then if the slip continues increasing, the system will be insta-bility, but it's uncertain to cause voltage collapse. In s>s , voltage recovers gradually along with increase of the slip. If it could recover to the critical voltage, the system will recover the voltage stability. Conversely, it will be volt-age collapse. In Fig. 10, the node power increases along with increase of the slip, eventually P- and Pmax- curve intersect, and then if the slip continues increasing, the power will be unbalance, and the unbalance will last forever.
6.2. The Analysis of the Influence of Proportion of Constant Impedance Load and Dynamic Load on Static Voltage Stability
[image:4.595.59.289.97.731.2]Load characteristic varies along with the change of pro-portion of constant impedance load and dynamic load. In
be parts of V- curve falling in the unsteady region; In
Figure 10, the intersection of P- and Pmax- curve may be zero or one. If the proportion of constant impedance and dynamic load is 2:1, P- and Pmax- curve don’t in-tersect, the system has always been in power balance. Nevertheless, with increase of proportion of dynamic load, P- curve moves up, the scr increases, and the value of maximum power increases, P- and Pmax- curve will get an intersection, thus, there will be parts of P- curve falling in the unsteady region.
7. Instability Mechanism Analysis
7.1. Instability Causes by the Slip
The node voltage drops along with increase of the slip. And the system stay in the edge of voltage stability until V- and Vcr- curve intersect. If the slip continues in-creasing, the system will be instable, the voltage start recovery until the slip reach s .At this moment if s is lower, there will be enough space for voltage to recover, it won’t cause voltage collapse. Conversely, if s is larger, voltage can’t return to the critical voltage, because the slip can’t increase again. And finally, it will be voltage collapse.
The node power increases along with increase of the slip. And the system stay in the edge of power stability until P- and Pmax- curve intersect. If the slip continues increasing, the power will be unbalance. The node power is the same to the node voltage which has recovery char-acteristic. In scr< s< 1, with increase of the slip, the node power decrease, however if the power system transfer limits can’t increases, the system will always be in power unbalance state.
7.2. Instability Causes by the Proportion of Dynamic Load and Constant Impedance Load
Along with increase of the proportion of dynamic load, V- curve moves down, s increases, and then the more curve will fall in unstable region. However the increase of s means the voltage recovery space is reduced, the decrease of the voltage minimum corresponding to s means there is bigger distance between the value of vol-tage instability and the value of critical volvol-tage. It’s un-favorable to voltage recovery, thereby, the system volt-age stability weakens. On the contrary, the increase of proportion of constant impedance load will enhance the system voltage stability. Further more, if the proportion of constant impedance load increases to an extent, V- and Vcr- curve won’t intersect, load characteristic which changes along with the slip has no effect on voltage sta-bility.
With increase of proportion of dynamic load, P-
curve moves upward, scr increases, the node power maximum corresponding to scr increases, and the more curve will fall in unstable region. Conversely, with in-crease of proportion of constant impedance load, P-j move downward, scr decreases, and the more curve will fall in unstable region, but the node power maximum corresponding to scr decreases. Here the amount of scr means the positional closeness of Pmax- curve and the node power maximum. Due to the change of load pro-portion, P- may be intersect with Pmax- before scr, or may be intersect with Pmax- after scr. However, if they get intersection before scr, the more transmission power will be transferred under the power balance conditions. Further more, with regard to heavy load line, we hope that it can reduce transmission power under the power balance conditions, so the proportion of dynamic load should be increased. With regard to heavy load line, we hope that it can transfer more power under power balance conditions, so the proportion of constant impedance load should be increased. But the overlarge proportion of con-stant impedance load is unfavorable to transfer more power, and the overlarge proportion of dynamic load is unfavorable to power balance. Hence, a reasonable load proportion should be taken, and then a reasonable power will be transferred under power balance conditions, which benefits to avoiding power unbalance and enhance transmission efficiency.
8. Conclusions
This paper takes the equivalent impedance load model to analyze load characteristic and study the mechanism of voltage instability considering load characteristics based on static voltage stability region. The following conclu-sion will be obtained through the above analysis:
1) The change of the slip result in the change of power factor and module of impedance, consequently, causes the change of load characteristic. And the system stabil-ity worsens along with increase of the slip.
2) The different proportions of constant impedance load and dynamic load result in different comprehensive load characteristics which generate different impacts on static voltage stability. The amount of s determines the strength of system voltage stability. The amount of scr determines the maximum of power transmission.
3) The increase of proportion of Constant impedance load is helpful to voltage stability, however if the propor-tion is overlarge, it’s not conducive to power transfer. Therefore, a reasonable load proportion could avoid power unbalance and enhance transmission efficiency.
REFERENCES
Load-ability and Voltage Stability in Power Systems,” Electrical Power and Energy Systems, Vol. 15, 1993, pp. 145-154.doi:10.1016/0142-0615(93)90029-M
[2] X. B. Wang and Z. X. Han, “PV Cueves Analysis Con-sidering the Static Characteristic of Induction Motor,” Chinese Journal of Automation of Electric Power Systems, Vol. 28, 2004, pp. 32-36.
[3] J. Ma, R. M. He and Y. J. Zhou. “Research on Generali-zation Capability of Load Model,” Chinese Journal of Proceedings of the CSEE, Vol. 26, 2006, pp. 29-35.
[4] L. M. Hajagos and B. Danai. “Laboratory Measurements
and Models of Moderm Loads and Their Effect on Volt-age Stability,” Studies IEEE Trans on Power System, Vol. 13, 1998, pp. 584-592.doi:10.1109/59.667386
[5] P. F. Zhang, C. L. Luo and Y. J. Meng. “Impact of Dy-namic Electric Load Model Proportion on Power System Stability,” Chinese Journal of Relay, Vol. 34, 2006, pp. 24-48.