http://dx.doi.org/10.4236/gep.2016.48005
Micro Hydro Potential Modelling:
Integrating GIS into Energy Alternatives
for Climate Change Mitigation
Gerald C. K. Chelelgo
1, David N. Siriba
2, Elijah K. Biamah
11Department of Environmental and Biosystems Engineering, University of Nairobi, Nairobi, Kenya 2Department of Geospatial and Space Technology, University of Nairobi, Nairobi, Kenya
Received 1 June 2016; accepted 21 August 2016; published 25 August 2016
Copyright © 2016 by authors and Scientific Research Publishing Inc.
This work is licensed under the Creative Commons Attribution International License (CC BY).
http://creativecommons.org/licenses/by/4.0/
Abstract
This research focused on integrating GIS into energy alternatives for climate change mitigation by creating a GIS-based hydrologic model that can be used to identify sites that have significant po-tential for micro hydropower development within the River Perkerra catchment area. Hydropow-er is a clean and renewable enHydropow-ergy source that remains largely untapped in the country and its development can be used to mitigate anthropogenic climate change by reducing reliance on fossil or biomass derived fuels. This research established the extent of this resource and whether the available sites with significant micro hydropower potential within the study area were amply co-pious to warrant further development. Currently, such identification is done physically using means that are menial, costly and significantly time consuming. A 90-metre resolution Digital Terrain Model (DTM) data obtained from the Shuttle Radar Topography Mission and various GIS tools were used to create a hydrologic framework which was used to identify potential sites along River Perkerra that suited any desired head requirement for the purposes of locating micro hy-dropower plants. The derived model demonstrated that it was possible to identify sites at discrete geographic locations along any stream drainage network using GIS. In addition, the model also provides a decision support system that integrates a powerful graphical user interface, spatial da-tabase management system and a generalized river basin network flow model for the purposes of exploiting and developing micro hydropower. With sufficient data on catchment discharge and use of higher resolution DTM, the model can be further enhanced to accurately obtain the total mi-crohydro potential of River Perkerra by aggregating the respective potentials of every steam seg-ment.
Keywords
Delineation, River Perkerra
1. Introduction
Kenya hopes to industrialize by 2030 [1]. This would involve development of industries on an extensive scale and impact on the livelihood of its citizens. Industrialization has both negative and positive impacts. The posi-tive impacts include economic growth and food security among others, whereas the negaposi-tive impacts include climate change which was first noticed as an impact of industrialization by Svante Arrhenious, a 19th century Swede scientist [2]. The development agenda of many developing countries are increasingly being affected by climate related disasters including hurricanes, drought, floods and landslides [3], largely because of the increas-ing climate variability and the risk associated with it [4].
Climate variability is already having a large negative effect on the region’s socio-economic development. This is likely to worsen with climate change hence the need to vigorously pursue adaptation to climate change. Together with other factors including rapidly growing population, poor management of natural resources and limited use of technologies, climate variability or long-term climate change could worsen the poverty situation in Kenya. Due to the many and diverse impacts likely to result from climate change, a combination of mechan-isms including both technical and social strategies would be needed to promote adaptation [5].
The causes of climate change are related to energy use and as such, it has been established that anthropogenic factors mainly resulting from greenhouse gas emissions associated with energy use and generation are the key causes of climate change. Currently, CO2 concentrations stand at 380 ppm and the global average temperature has risen by 0.6˚C over the past 100 years with related impacts being observed. With status quo prevailing, con-tinued use of fossil fuels and destruction of bio-mass to satisfy the ever growing energy demand, the global av-erage temperature is expected to rise by between 1.4˚C and 5.8˚C this century [6].
Energy is indeed necessary for economic development and the level or intensity of its use is synonymous to any country’s economic growth and development. Countries with low per capita consumption of commercial energy would typically have correspondingly low per capita Gross Domestic Product (GDP) [1]. This is true for Kenya whose commercial energy consumption has declined over the previous three decades when the economy has had a weak performance and growth. Countries that have achieved strong growth such as Egypt, South Africa and the Asian tiger economies have equally had a similar increased trend in energy consumption and Gross National Income (GNI) [7].
Since factors related to energy use are the main contributors to climate variability, any technical intervention needs to focus more on greener sources of energy. Some of these green energy sources include the solar, geo-thermal, and hydro-power. These are already being used in the Kenya but siting of the points for harnessing energy including hydropower has been a challenge. This research aimed at providing a means of identifying po-tential micro hydropower sites using GIS to enable further evaluation and development to harness this clean energy source.
Climate change is an issue of global impact and concern which is driven mainly by anthropogenic causes. There is need to adopt cleaner energy and at the same time reduce demand for biomass energy that has driven destruction of forests which naturally act as carbon banks whilst sequestering atmospheric carbon dioxide, one of the major greenhouse gases [8]. Hydropower is one of the most common renewable energy resources abun-dantly available in regions that receive significant rainfall and provides itself as an alternative clean, low cost and well developed technology that can be adopted to avert energy scarcity, biomass destruction and advance-ment of climate change [9]. Likewise in Kenya, there is an estimated 3000 MW of untapped hydroelectric ca-pacity of small, micro to pico hydropower, part of which may be viable for community based electricity produc-tion, detailed resource assessments have only been done for a small number of hydroelectric power projects in all regions making it impossible for hydroelectric power projects to be included in the least-cost power devel-opment plan [10].
The overall problem addressed by this study is that while the use of GIS has been commonplace in disciplines such as forestry, hydrology, environmental management, geology and mining, it has not been used extensively in the exploitation of renewable energy sources. Currently, identification of suitable micro hydropower sites within river drainage networks is conducted through abstract and manual means that do not provide the entirety of crucial hydrological information needed to support decision making. This process is menial, time consuming and costly hence in order to hasten and improve the process of locating and planning micro hydropower projects within a given river basin there are pertinent research questions such as: Could GIS be used as a proactive plan-ning tool that could lay ground for a quicker assessment of micro hydropower potential and identification of suitable sites where this source of renewable energy can be effectively exploited? The objective of this research study was to identify sites along the gauged stream segments within River Perkerra catchment area in Baringo County, Kenya with significant potential for micro hydropower development and subsequently estimate the electric power generation potential.
2. Hydropower Modelling
Hydropower has been in use since ancient times from before 200 B.C. by the Greeks and Chinese where this form of energy was harnessed for basic tasks such as irrigation, grinding of grains into flour [11]-[13]. In terms of significance, hydropower is amongst the key sources of renewable energy for electrical power production with a projected global potential of 14,370 TWh/year, of which 8080 TWh/yr. is currently considered economi-cally viable [14]. Consequently rural populations in Africa including those located far away from the electricity distribution grid can hugely benefit from local small-scale hydropower projects [15].
Electricity is a secondary energy source, obtained through conversion of primary sources of energy such as hydropower, thermal, wind or solar [16] as such; micro hydropower generation is an inexpensive compliment to solar and other renewable energy forms. The nature of hydropower makes its use possible beyond a single home and instead can provide electric power to a several homes. Apart from being environmentally benign, having a long running life and maintenance easy, small-hydro has the advantage of being amongst cost-effective energy technologies that can be considered for rural electrification in developing countries while also augmenting pow-er genpow-eration from large hydro schemes Whpow-ereas respow-ervoirs associated with large-hydro have considpow-erable social and environmental impacts such as interrupted fish breeding, methane release into the atmosphere, water quality degradation, intensification of disease vector as well as reduced water availability downstream, small hydro is a cleaner substitute [17][18]. Another benefit of micro hydropower is that water, which would otherwise cause soil loss on steep slopes, is directed through pipes and its force is used to produce energy rather than cause ero-sion.
To date, there is still no internationally agreed definition of small-hydro. Some school of thought applies the term small-hydro to collectively cover small, mini, micro and pico hydropower schemes. Conventionally, small- hydro refers to between 2.5 and 25 MW, mini-hydro typically refers to schemes below 2 MW, micro-hydro be-low 500 kW and pico-hydro bebe-low 10 kW. These are arbitrary demarcations though most principals cut across smaller and larger schemes [19]. Pepermans and others define small-hydro as ranging between 1 - 100 MW and micro-hydro between 25 kW - 1 MW. Some authors define generation between 1 kW and 1 MW as dispersed generation [20].
While the process of identifying potential micro hydropower sites can be an overwhelming exercise, remote sensing and GIS technology can play a pivotal role in the scientific assessment of drainage networks to accu-rately identify locations with the highest potential for hydropower development hence increasing access to af-fordable energy [21]. Hydropower potential is directly related to the geography of an area, amount of precipita-tion and soil saturaprecipita-tion. GIS can be used to evaluate specific watersheds for runoff and the difference in eleva-tion from where water can be collected and where a turbine can be located. Rojanamon et al. propose new me-thods of application of GIS to site selection of small run-of-river hydropower that can help address some of the challenges encountered during site selection of small run-of-river hydropower projects occasioned by accessibil-ity of the possible sites which are mostly located in rural and mountainous areas, the large amount of data re-quired, and the lack of participation of the local communities [22].
study area and finally to select the most technically suitable site [23].
A study by Jha, R. used the hydro-meteorological data from Department of Hydrology and Meteorology for hydrological analysis of all the rivers in Nepal. By incorporating hydrological analysis, GIS and a purposely de-veloped hydropower model as shown on Figure 1, the power potential and annual run-of-the-river energy esti-mate for the entire country was established [24].
A paper by Feizizadeh & Haslauer [25] discusses the application of a GIS to calculate the theoretical surface hydropower potential of the Tabriz basin in Iran. GIS based hydrological modelling is performed on equi-areal raster cells using topographical and meteorological datasets. The input data was com-piled and analyzed using GIS data layers, including topographic characteristics, monthly evaporation and precipitation data to identify areas of the river network the highest potentials that could be used to locate for hydropower plant. Figure 2 illu-strates the schema of the model used. From the above, GIS thus provides a practical means of modelling both elevation and hydrologic data.
This research proposes to adopt both models by Jha, R. [24] and Feizizadeh & Haslauer [25] to create an en-hanced one capable of identifying focus areas for development of micro hydropower hence facilitating devel-opment and increased use of electricity and mechanical energy derived from micro hydropower with an aim of: 1) reducing the use unsustainable energy sources and 2) reducing emissions generated by use of fossil fuels and biomass.
3. Materials and Methods
3.1. Hydrologic Analysis
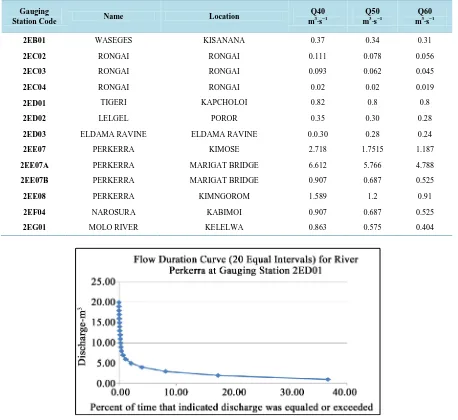
[image:4.595.141.487.411.702.2]Hydrologic Analysis was carried to obtain the respective flow duration curves at gauging station points along the Perkerra River. The flow duration curves were necessary for calculations to determine the average flow magnitude in a year that could be expected to be equal or exceed 40, 50 and 60 percentile of the time. The exer-cise involved use of primary data containing river flows from gauging stations supplied by the Water Resource Management Authority (WRMA) and the Rift Valley Water Services Board.
3.2. Stream & River Network Delineation
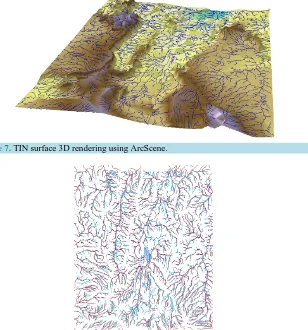
Delineation of River Perkerra drainage network through GIS hydrologic modelling was done using ArcGIS Model Builder & ArcHydro tools to process DEM data from the Shuttle Radar Topography Mission (SRTM) containing elevation data at a 90 m resolution in ASCII format. Ground truthing and topographic maps from the Survey of Kenya were used to validate the derived river network.
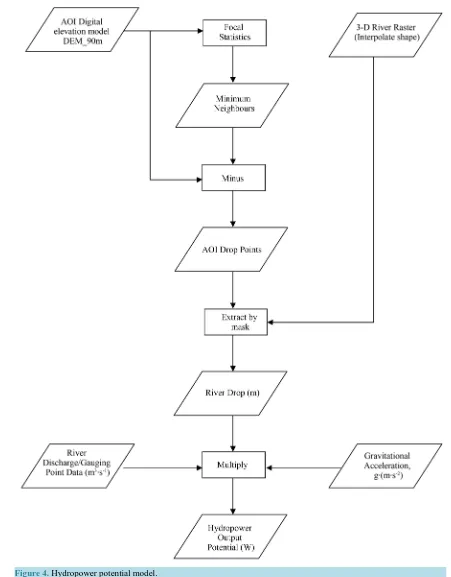
3.3. Hydropower Modelling
A hydropower model was developed by further processing the delineated drainage network of River Perkerra within ArcGIS to:
1) Identify sites along delineated stream network that have suitable head requirement for the purposes of lo-cating micro hydropower plants.
a) Drop points within the area of interest were obtained by subtracting minimum neighbours from the area of interest DEM. The minimum neighbours were derived by applying 3 by 3 cell focal statistics against each pixel on the area of interest DEM.
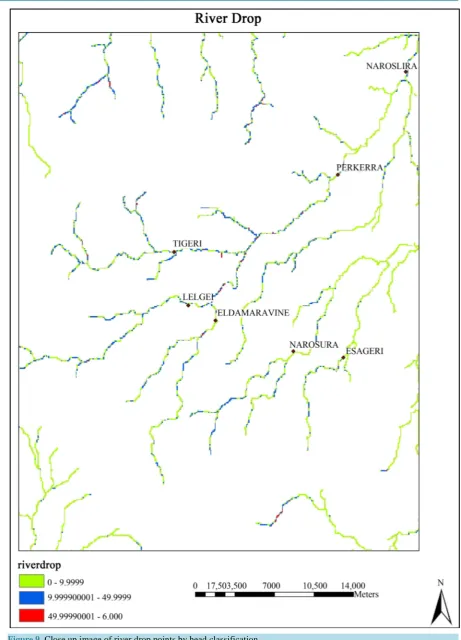
b) Drop points along the river network were obtained through extracting by mask, drop points within the area of interest from a 3D raster representation of the river network. The river drop was colour coded and classified in terms of head as either high (>50 m), medium (10 - 50 m) or low (<10 m) which would guide the type of tur-bine as illustrated on Figure 3.
2) Identify potential hydropower sites along gauged stream segments within the study area.
a) To establish the hydropower potential, the river drop was multiplied by gravitational acceleration 9.81 ms-2.
b) The product of hydropower potential and river discharge would yield the extractable hydropower output of any identified site.
[image:6.595.160.467.443.712.2]3) Estimate the power potential of selected hydropower sites along the gauged stream segments in the drai-nage basin. Using hydropower potential and discharge calculation from hydrologic analysis of the Perkerra Riv-er, the extractable Q40, Q50 & Q60 hydropower output potential was obtained for high head sites along the Ti-geri, Lelgel and Eldama Ravine gauged sections of the River Perkerra. A high-level flow chart of the model is shown in Figure 4.
Figure 4. Hydropower potential model.
4. Results and Analysis
4.1. Derived Flow Duration and Discharge
showed the percent of time specified discharges were equaled or exceeded over the period which readings were recorded. The flow-duration curve represents the long-term characteristics of the gauged stream segments hence were used to predict the distribution of future flows for hydropower estimation. The respective Q40, Q50 and Q60 are tabulated on Table 1 below while Figure 5 and Figure 6 show the flow duration curves for the Tigeri gauging station 2ED01.
4.2. Delineated Stream & River Network
The River Perkerra watershed and its stream network were delineated the from digital elevation model data. Figure 7 illustrates the 3D TIN surface rendering of the resultant river network. The derived stream network compared well to those obtained from digitized maps as shown an overlay with a stream network obtained from DEPHA in Figure 8. Digitized maps carry a bigger approximation due to the scale of representation being lower that the SRTM data used in this research explaining the few differences observed.
In addition, the GPS coordinates for gauging station obtained during site visits all fell within the derived river network confirming accuracy of the model. Figure 9 shows the relative positions of the gauging stations with
Table 1. Q40, Q50 and Q60 discharge values by gauging station.
Gauging
Station Code Name Location
Q40 m3∙s−1
Q50 m3∙s−1
Q60 m3∙s−1
2EB01 WASEGES KISANANA 0.37 0.34 0.31
2EC02 RONGAI RONGAI 0.111 0.078 0.056
2EC03 RONGAI RONGAI 0.093 0.062 0.045
2EC04 RONGAI RONGAI 0.02 0.02 0.019
2ED01 TIGERI KAPCHOLOI 0.82 0.8 0.8
2ED02 LELGEL POROR 0.35 0.30 0.28
2ED03 ELDAMA RAVINE ELDAMA RAVINE 0.0.30 0.28 0.24
2EE07 PERKERRA KIMOSE 2.718 1.7515 1.187
2EE07A PERKERRA MARIGAT BRIDGE 6.612 5.766 4.788
2EE07B PERKERRA MARIGAT BRIDGE 0.907 0.687 0.525
2EE08 PERKERRA KIMNGOROM 1.589 1.2 0.91
2EF04 NAROSURA KABIMOI 0.907 0.687 0.525
[image:8.595.86.541.283.707.2]2EG01 MOLO RIVER KELELWA 0.863 0.575 0.404
[image:8.595.85.543.287.707.2]Figure 6. Flow duration curve (log intervals) for River Perkerra at gauging station 2ED01.
Figure 7. TIN surface 3D rendering using ArcScene.
Figure 8. Comparison between derived stream network (blue) and that digitized from
[image:9.595.243.385.532.697.2]respect to the derived stream network.
4.3. Hydropower Model and Identified Potential Micro Hydropower Sites
River drop points were extracted from the DEM and stream net-work in order to identify sites along delineated stream network that potentially have suitable head requirement for locating micro hydropower plants. Figure 9 shows a close up view of one of the stream segments and drop points classified by available head.
The extractable Q40, Q50 & Q60 hydropower output potential for sites along the Tigeri, Lelgel and Eldama Ravine gauged sections of the River Perkerra identified to have a head drop of 50 metres and above are tabu-lated on Table 2.
5. Conclusions and Further Work
This research demonstrated the use of GIS in accurately identifying and assessing the extent of hydropower
Table 2. Potential hydropower output sites with 50 m or more head.
Reference Gauging Point (s)
Head Drop (m) Hydro Site Coordinates (Decimal Degrees)
Total Available Discharge (m3∙s−1)
Total Potential Power Output (MW)
Q40 Q50 Q60 Q40 Q50 Q60
TIGERI 2ED01 51 35.712236, 0.102368 0.82 0.80 0.80 0.410 0.400 0.400
ELDAMA RAVINE 2ED03 52 35.711548, 0.035348 0.30 0.28 0.24 0.153 0.143 0.122
ELDAMA RAVINE 2ED03 50 35.712513, 0.036192 0.30 0.28 0.24 0.147 0.137 0.118 LELGEL 2ED02 &
ELDAMA RAVINE 2ED03 58 35.725049, 0.069461 0.65 0.58 0.52 0.370 0.330 0.296 LELGEL 2ED02 &
ELDAMA RAVINE 2ED03 63 35.725772, 0.069943 0.65 0.58 0.52 0.402 0.358 0.321 LELGEL 2ED02 &
ELDAMA RAVINE 2ED03 55 35.726978, 0.071630 0.65 0.58 0.52 0.351 0.313 0.281 LELGEL 2ED02 &
ELDAMA RAVINE 2ED03 62 35.728304, 0.074523 0.65 0.58 0.52 0.395 0.353 0.316 LELGEL 2ED02 &
ELDAMA RAVINE 2ED03 51 35.729388, 0.075126 0.65 0.58 0.52 0.325 0.290 0.260 LELGEL 2ED02 &
ELDAMA RAVINE 2ED03 58 35.739343, 0.086141 0.65 0.58 0.52 0.370 0.330 0.296 LELGEL 2ED02 &
ELDAMA RAVINE 2ED03 78 35.742660, 0.092853 0.65 0.58 0.52 0.497 0.444 0.398 LELGEL 2ED02 &
ELDAMA RAVINE 2ED03 69 35.743586, 0.093778 0.65 0.58 0.52 0.440 0.393 0.352 LELGEL 2ED02 &
ELDAMA RAVINE 2ED03 79 35.744357, 0.094704 0.65 0.58 0.52 0.504 0.449 0.403 LELGEL 2ED02 &
ELDAMA RAVINE 2ED03 85 35.746131, 0.099024 0.65 0.58 0.52 0.542 0.484 0.434 TIGERI 2ED01 & LELGEL
2ED02 & ELDAMA RAVINE 2ED03
73 35.748615, 0.103190 1.47 1.38 1.32 1.053 0.988 0.945
TIGERI 2ED01 & LELGEL 2ED02 & ELDAMA RAVINE
2ED03
67 35.754556, 0.110750 1.47 1.38 1.32 0.966 0.907 0.868
TIGERI 2ED01 & LELGEL 2ED02 & ELDAMA RAVINE
2ED03
62 35.755250, 0.111599 1.47 1.38 1.32 0.894 0.839 0.803
TIGERI 2ED01 & LELGEL 2ED02 & ELDAMA RAVINE
2ED03
resources, including whether the availability of sites with micro hydropower potential within the study area was sufficiently large to warrant further development.
Based on the results it is established that:
1) GIS can be used to accurately identify sites at discrete geographic locations along any stream drainage network.
2) Potential sites for hydropower development are numerous within the study area and can reliably generate electricity all year round. These sites have hydropower potential characteristic of pico, micro, mini and small hydropower installations.
The use of GIS in identification and assessment of a country’s hydropower potential should be adopted. With sufficient data on catchment discharge, the model can be further enhanced to obtain the total micro hydropower potential of River Perkerra whereby the potentials of every stream segment are aggregated. This research can be replicated to assess hydropower potential for any river network
References
[1] GoK (2007) Vision 2030. Government of the Republic of Kenya, Ministry of Planning and National Development and the National Economic and Social Council (NESC), Office of the President, Nairobi.
[2] Arrhenius, S. (1896) XXXI. On the Influence of Carbonic Acid in the Air upon the Temperature of the Ground. The London, Edinburgh, and Dublin Philosophical Magazine and Journal of Science, 41, 237-276.
http://dx.doi.org/10.1080/14786449608620846
[3] Mirza, M.M.Q. (2003) Climate Change and Extreme Weather Events: Can Developing Countries Adapt? Climate Pol-icy, 3, 233-248.
[4] Kabat, P., Schulze, R., Hellmuth, M. andVeraart, J. (2003) Coping with Impacts of Climate Variability and Climate Change in Water Management: A Scoping Paper. DWC-Report No. DWCSSO-01 Dialogue on Water and Climate, Wageningen.
[5] Bergkamp, G., Orlando, B. and Burton, I. (2003) Change: Adaptation of Water Resources Management to Climate Change. IUCN, Gland.
[6] Houghton, J.T., Albritton, D., Meira Filho, L., Cubasch, U., Dai, X., Ding, Y., et al. (2001) Technical Summary of Working Group 1. In: Houghton, J.T., Ding, Y., Griggs, D.J., Noguer, M., van der Linden, P.J., Dai, X., Maskell, K. and Johnson, C.A., Eds., Climate Change 2001: The Scientific Basis. Contributions of Working Group I to the Third Assessment Report of the Intergovernmental Panel on Climate Change, Cambridge University Press, Cambridge, 3-45. [7] Cheng, B.S. (1995) An Investigation of Cointegration and Causality between Energy Consumption and Economic
Growth. Journal of Energy and Development, 21, .
[8] Pacala, S. and Socolow, R. (2004) Stabilization Wedges: Solving the Climate Problem for the Next 50 Years with Current Technologies. Science, 305, 968-972.http://dx.doi.org/10.1126/science.1100103
[9] Frey, G.W. and Linke, D.M. (2002) Hydropower as a Renewable and Sustainable Energy Resource Meeting Global Energy Challenges in a Reasonable Way. Energy Policy, 30, 1261-1265.
http://dx.doi.org/10.1016/S0301-4215(02)00086-1
[10] GoK (2004) Sessional Paper No. 4 of 2004 on Energy. National Energy Policy Ed., Nairobi.
[11] Spain, S.D. (2011) Hydro Power Generation: Global and US Perspective. In: Rao, K.R., Ed., Energy and Power Gen-eration Handbook, Chapter 11, ASME Press, New York.
[12] Yannopoulos, S., Lyberatos, G., Angelakis, A. and Theodossiou, N. (2014) Water Pumps through the Ages. e-Pro- ceedings of IWA Regional Symposium on Water, Wastewater and Environment: Traditions and Culture,Hellenic Open Univ., Patras, 615-626.
[13] Reynolds, T.S. (2002) Stronger than a Hundred Men: A History of the Vertical Water Wheel. JHU Press, Baltimore.
[14] Fraenkel, P., Paish, O., Bokalders, V. and Harvey, A. (1991) Micro-Hydro Power—A Guide For development Work. Russell Press Ltd., Nottingham.http://dx.doi.org/10.3362/9781780442815
[15] Klunne, W.J. and Michael, E.G. (2010) Increasing Sustainability of Rural Community Electricity Schemes—Case Study of Small Hydropower in Tanzania. International Journal of Low-Carbon Technologies, 5, 144-147.
http://dx.doi.org/10.1093/ijlct/ctq019
[16] Mirza, U.K., Ahmad, N., Majeed, T. and Harijan, K. (2008) Hydropower Use in Pakistan: Past, Present and Future.
Renewable and Sustainable Energy Reviews, 12, 1641-1651.http://dx.doi.org/10.1016/j.rser.2007.01.028
[18] Renöfält, B., Jansson, R. and Nilsson, C. (2010) Effects of Hydropower Generation and Opportunities for Environ-mental Flow Management in Swedish Riverine Ecosystems. Freshwater Biology, 55, 49-67.
http://dx.doi.org/10.1111/j.1365-2427.2009.02241.x
[19] Paish, O. (2002) Micro-Hydropower: Status and Prospects. Journal of Power and Energy, 216, 31-40.
http://dx.doi.org/10.1243/095765002760024827
[20] Pepermans, G., Driesen, J., Haeseldonckx, D., Belmans, R. and D’haeseleer, W. (2005) Distributed Generation: Defi-nition, Benefits and Issues. Energy Policy, 33, 787-798.http://dx.doi.org/10.1016/j.enpol.2003.10.004
[21] Popli, K. (2012) Barriers in Small Hydro Power Development in India. IASH Journal: International Association for Small Hydro, 1, 3-7.
[22] Rojanamon, P., Chaisomphob, T. and Bureekul, T. (2009) Application of Geographical Information System to Site Se-lection of Small Run-of-River Hydropower Project by Considering Engineering/Economic/Environmental Criteria and Social Impact. Renewable and Sustainable Energy Reviews, 13, 2336-2348.
http://dx.doi.org/10.1016/j.rser.2009.07.003
[23] Das, S. and Paul, P. (2006) Selection of Site for Small Hydel Using GIS in the Himalayan Region of India. Journal of Spatial Hydrology, 6, 18-28.
[24] Jha, R. (2010) Total Run-of-River Type Hydropower Potential of Nepal. Hydro Nepal: Journal of Water, Energy and Environment, 7, 8-13.
[25] Feizizadeh, B. and Haslauer, E.M. (2012) GIS-Based Procedures of Hydropower Potential for Tabriz Basin, Iran. In-ternational Journal, 495-502.
Submit or recommend next manuscript to SCIRP and we will provide best service for you:
Accepting pre-submission inquiries through Email, Facebook, LinkedIn, Twitter, etc. A wide selection of journals (inclusive of 9 subjects, more than 200 journals) Providing 24-hour high-quality service
User-friendly online submission system Fair and swift peer-review system
Efficient typesetting and proofreading procedure
Display of the result of downloads and visits, as well as the number of cited articles Maximum dissemination of your research work
![Figure 1. Model used to calculate the total run-of-river type hydropower potential of Nepal [24]](https://thumb-us.123doks.com/thumbv2/123dok_us/7871164.738563/4.595.141.487.411.702/figure-model-calculate-total-river-hydropower-potential-nepal.webp)
![Figure 2. Model used to calculate hydropower potential for Tabriz Basin, Iran. [25].](https://thumb-us.123doks.com/thumbv2/123dok_us/7871164.738563/5.595.130.497.77.703/figure-model-calculate-hydropower-potential-tabriz-basin-iran.webp)
![Figure 3. Turbine sizing [19].](https://thumb-us.123doks.com/thumbv2/123dok_us/7871164.738563/6.595.160.467.443.712/figure-turbine-sizing.webp)