Munich Personal RePEc Archive
Possible approaches to benchmarking
voluntary health insurance funds in
Bulgaria
Salchev, Petko and Hristov, Nikolai and Georgieva, Lydia
Department of Social Medicine and health care management
2010
POSSIBLE APPROACHES TO BENCHMARKING VOLUNTARY HEALTH INSURANCE FUNDS IN BULGARIA
Petko Salchev, Nikolai Hristov, Lydia Georgieva
Abstract: Following the adoption of the Health Insurance Law in Bulgaria (1999), which provided the legal framework for the development of the voluntary health insurance, several health insurance funds had been established. Bulgaria had two licensed voluntary health insurance funds in 2001; in 2003 their number grew to six; and in 2009 this number stands over twenty. Despite the increased number of funds in recent years, their share of healthcare spending stayed at 1-1.5%, which is below European average.
To this date, there are no serious and profound studies in the field among the scientific community in Bulgaria. The economic data published by the Commission of Financial Surveillance (CFS), conforms to EC regulations, but do not allow non-specialists to assess realistically voluntary health insurance funds (VHIF).
This article introduces a methodology for comparing VHIF and establishment of a complex index (Benchmark Index - BI) based on 5 groups of indicators, related to several available variables. This index is intended as a tool for analyzing the voluntary health insurance sector and managing resources through a set of analytic indicators and variables. It can be used to create a certain type of ranking of VHIF.
Key words: voluntary health insurance, market, comparing methods, benchmark index.
Introduction
The development of the insurance markets changed to a great extent the roles of businesses dealing with the organization and provision of insurance services. The constant demand for new forms of insurance, the development of competition and free market of offered services, the growing motivation of companies and individuals for inclusion into new insurance schemes, the higher insurance culture of businesses and individuals, are challenging all involved market players.
The main challenges to voluntary health insurance are related to:
- Honesty, loyalty, transparency and heightened social sensitivity to the clients needs; - Strict knowledge of legislation, regulatory mechanisms and requirements concerning different forms of insurance;
- Individualized marketing and client servicing;
- Development of forms and models increasing the motivation for inclusion in insurance schemes;
- Provision of measures for safeguarding the clients interests – security for the invested funds, collected information, etc.
- Perfect knowledge of the theory and practice of insurance relations, the forms of insurance, the different methods and models;
- Provision of clear, accessible and understandable information regarding the insurance relations;
- Knowledge of the options for meeting the different individual or company insurance problems and needs;
- Transformation of the “service seller” role to the “personal consultant and counselor” role for all involved in this business;
Following the adoption of the Health Insurance Law in Bulgaria (1999), which provided the legal framework for the development of the voluntary health insurance, several health insurance funds had been established. Bulgaria had two licensed voluntary health insurance funds in 2001; in 2003 their number grew to six; and in 2009 this number stands over twenty. Despite the increased number of funds in recent years, their share of healthcare spending stayed at 1-1.5%, which is below European average.
Table 1. Comparison of public and private funds
General government
Private insurance enterprises (other than social insurance)
(Percentage of GDP) (Percentage of GDP)
2003 2004 2005 2006 2003 2004 2005 2006
Austria 7,57 0,53
Belgium 7,11 7,43 7,36 7,16 0,17 0,18 0,18 0,18
Bulgaria 4,65 4,37 4,53 3,97 0,01 0,01 0,02 0,03
Switzerland 6,67 6,70 6,78 6,41 0,65 0,73 0,71 0,71
Cyprus 1,60 1,44 1,45 1,52 0,07 0,08 0,08 0,09
Czech Republic 6,39 6,17 6,06 5,84 0,02 0,02 0,02 0,01
Germany 8,22 7,86 7,94 7,86 0,91 0,93 0,95 0,94
Denmark 7,42 7,48 7,53 7,70 0,13 0,14 0,14 0,15
Estonia 3,82 3,86 3,86 3,71 0,00 0,00 0,01 0,05
Spain 5,53 5,57 5,63 5,71 0,46 0,47 0,49 0,50
Finland 5,55 5,67 5,86 5,82 0,15 0,15 0,15 0,15
France 8,42 8,48 8,55 8,47
Hungary 5,79 5,57 5,80 5,64 0,05 0,09 0,09 0,11
Iceland 8,48 8,04 7,68 7,49
Japan 6,36 6,39 6,56 0,20 0,20 0,20
Lithuania 3,68 3,79 3,95 0,02 0,02 0,02
Luxembourg 6,65 6,78 6,81
Latvia 3,65 3,44 0,18 0,14
Netherlands 5,85 5,83 5,83 0,97 1,08 1,11
Norway 6,28 7,49 7,07 0,00
Poland 4,14 4,01 4,02 4,05 0,04 0,04 0,03 0,03
Portugal 6,69 6,81 6,91 6,66 0,19 0,21 0,21 0,23
Romania 3,84 3,52 3,85 3,42 0,19 0,13 0,23 0,02
Sweden 7,49 7,30 7,24 7,23
Slovenia 5,91 5,86 5,86 5,68 0,00
Slovakia 5,08 4,91
United States 6,64 6,71 6,77 6,92 5,52 5,49
Data from Eurostat, 2009 http://epp.eurostat.ec.europa.eu/portal/page/portal/eurostat/home
The market for voluntary (private) health insurance funds in Bulgaria is growing in recent years, but with some unfavorable features:
- Unclear packages of offered services;
- Supply of services identical to those offered by mandatory public insurance; - Low share of total healthcare spending;
- Ambiguity concerning the type of insurance offered – additional, replacement or supplementary;
- Predominantly corporative based insurance – inclusion of whole companies, due to tax concessions.
Table 2. Public healthcare spending by year
Public spending/years 2000 2001 2002 2003 2004 2005 2006 2007 2008
Total healthcare spending,
including: 977.7 1196.0 1437,3 1697,7 1769,1 1777,7 1997,4 2215,60 2368,9
Ministry of Health 291.9 462.0 540.0 599.6 644.6 576.4 405.5 514.4 560,80 National Health
[image:4.595.70.532.323.493.2]Insurance Fund 126.8 428.2 585.0 775.1 881.6 982.9 1357.6 1464.9 1550,00 Municipalities 413.8 183.2 209.5 218.8 109.2 138.8 155.2 174.7 179,10 Others 145.2 122.6 102.8 104.2 133.7 79.6 79.1 61.6 79,00
Table 3. Health insurance funds (number, premium income and paid off claims)
Voluntary (private)
health insurance 2000 2001 2002 2003 2004 2005 2006 2007 2008
Number of funds 6 6 11 12 13 15 20 Premium income 3,315 6,405 11,628 17,788 22,297 25,353 30,307 Paid off claims 0,427 2,571 5,625 9,466 12,598 15,319 21,108 Premium income as a
percentage from total public spending
0,23 0,38 0,66 1,00 1,12 1,14 1,28
Paid off claims as a percentage from total public spending
0,03 0,15 0,32 0,53 0,63 0,69 0,89
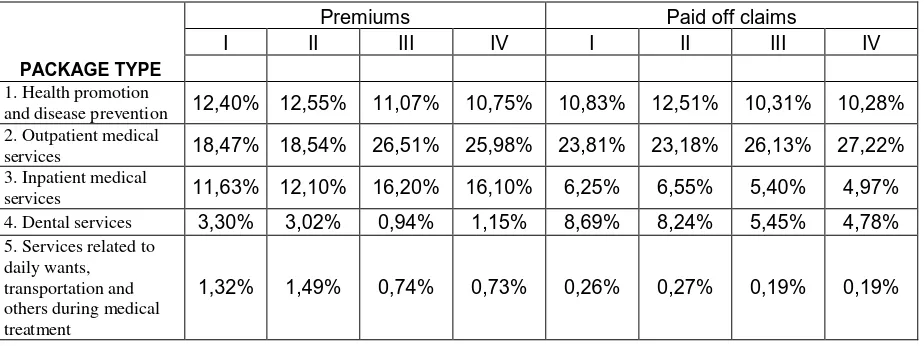
When analyzing the offered services and packages (table 4), it becomes clear that premium incomes come mainly from “other” packages, followed by those for outpatient medical treatment and reimbursement; the paid off claims demonstrate similar structure.
Table 4. Distribution of premiums and paid off claims according to types of packages during the observed period
Premiums Paid off claims
І ІІ ІІІ ІV І ІІ ІІІ ІV
PACKAGE TYPE
1. Health promotion
and disease prevention 12,40% 12,55% 11,07% 10,75% 10,83% 12,51% 10,31% 10,28%
2. Outpatient medical
services 18,47% 18,54% 26,51% 25,98% 23,81% 23,18% 26,13% 27,22%
3. Inpatient medical
services 11,63% 12,10% 16,20% 16,10% 6,25% 6,55% 5,40% 4,97%
4. Dental services 3,30% 3,02% 0,94% 1,15% 8,69% 8,24% 5,45% 4,78%
5. Services related to daily wants, transportation and others during medical treatment
[image:4.595.69.531.600.773.2]6. Reimbursement of
expenses 9,98% 9,48% 15,07% 14,36% 18,36% 17,96% 17,18% 16,46%
7. Other packages 42,91% 42,82% 29,48% 30,92% 31,81% 31,29% 35,35% 36,09%
TOTAL: 100,0% 100,00% 100,00% 100,00% 100,00% 100,00% 100,00% 100,00%
The data demonstrates the ambiguity in the offered services; no fund is able to specify what it means by “other” packages and reimbursement of expenses.
In spite of the upward trend in this type of insurance in Bulgaria, there are no serious and profound studies in the field among the scientific community. In the course of the last 9 years there are 36 publications related to voluntary health insurance; where 1/3 of them are literature reviews, 2 are monographs on the underlying principles of different insurance models, 5 investigate the activities of certain insurance funds and several represent discussions on future developments of the health insurance system.
Real and accessible data regarding health insurance activities can be found exclusively among the data published by the Commission of Financial Surveillance (CFS).
In principle, managerial and customer decisions can only be based on reliable data concerning insurance companies. In view of this, economists, statisticians and managers around the world, have come up with increasingly complex methods of comparisons and assessments of organizational structures in healthcare.
Comparing voluntary health insurance funds in Bulgaria is a daunting task due to the lack of readily available data and the vagueness surrounding assessment practices. Decisions seam to be based on general considerations and “expert statements” and do little to reflect objective realities.
To this day, the only comparisons are based on the market shares of different insurance funds. The economic data published by CFS, conforms to EC regulations, but do not allow non-specialists to assess realistically voluntary health insurance funds (VHIF).
This article introduces a methodology for comparing VHIF and establishment of a complex index (Benchmark Index - BI) based on 5 groups of indicators, related to several available variables. This index is intended as a tool for analyzing the voluntary health insurance sector and managing resources through a set of analytic indicators and variables. It can be used to create a certain type of ranking of VHIF. By easing the comparative analysis theses indicators can be used for evidence-based management.
The creation of complex mathematical methods introducing abundant data is one of the challenges for decision-makers and managers, who prefer to use clear and concise data in their practice.
The establishment of a simplified and easy to use integral BI is a compelling task for the scientific community. Such an index could help the healthcare system in several directions:
- Patients – when choosing a VHIF (social efficiency);
- Politicians – when deciding on resource management and allocation (economic efficiency);
- Managers – assessment of operative management (operative efficiency)
- Medical professionals – assessment of medical activities (medical efficiency)
Methodology for the creation of a benchmark index and the comparison of voluntary health insurance funds
The main challenges and limitations when creating the BI can be summarized like this: - Diversity in size, type and activities of different VHIF;
- Choice of easy to use mathematical and statistical models for data processing and summarization;
- Slow adoption of new IT technologies;
- The desire of politicians to support and managers to participate in the process of evaluating VHIF.
The creation of a BI had the following algorithm:
- Grouping of indicators in separate groups (pillars) and the calculation of an index fro each pillar;
- Calculation of a complex BI as a derivative of pillar BI; - Comparison of VHIF on the basis of BI.
This approach allows for swift analysis and assessment both with non-professionals with no formal evaluation skills, and professionals who want to base their managerial decisions on such estimates. The approach foresees some pretty straightforward comparisons among VHIF, which can no less be used to illustrate complex aspects of organizational stability, economical stability and efficiency, public importance and technological development.
It also looks easier to understand from the general public, when component indicators are analyzed and not general tendencies (Saltelli, 2007)
The main considerations “for” and “against” the usage of component indicators of the complex BI, are the following (adapted from Saisana & Tarantola, 2002):
For and against the BI component indicators usage •Summarize a complex of multi-mathematical
realities to support decision-making.
•Easier to interpret.
•Able to evaluate progress over time.
•Diminish the discernible size of indicators set, without losing information.
•Allow the inclusion of more information in the framework of existing limits.
•Facilitate communication with the public (i.e. general public, media, etc.) and promote accountability.
•Allow customers to compare options effectively.
• May send misleading signals.
• May simplify political decisions without profound analysis.
• May create the basis for misuse, e.g. raise support for a certain policy or
organization, especially if the adoption of such indicators is not a transparent process and has no statistical or conceptual notability.
• The choice of certain indicators is subject to political and scientific arguments.
• May be interpreted incorrectly and lead to serious decisions, discordant with the objective situation.
The strengths and weaknesses of BI ensue to a great extent from the quality of the main variables, included in its calculation. In the perfect case, all variables should be selected on the basis of their significance, analytic stability, timeliness, availability and other solid considerations.
For the purposes of comparing and the creation of a BI we selected the following groups (pillars) of indicators:
- І pillar – activities, organization, efficiency, which includes the following indicators – 1) number of concluded individual insurance policies; 2) number of concluded family policies; 3) number of concluded group policies; 4) number of concluded corporate policies; 5) total number of insured persons; 6) number of regional representatives (offices); 7) number of contracts concluded with medical facilities – medical, dental and pharmacies; 8) number of reused claims; 9) number of complaints 10) number of granted complaints.
services; 5) services related to daily wants, transportation and others during medical treatment; 6) reimbursement of expenses; 7) other packages; 8) total
- ІІІ pillar – market share
- ІV pillar – paid off claims according to package type – 1) health promotion and disease prevention; 2) outpatient medical services; 3) inpatient medical services; 4) dental services; 5) services related to daily wants, transportation and others during medical treatment; 6) reimbursement of expenses; 7) other packages; 8) total
- V pillar – financial parameters – 1) non-material assets; 2) investments; 3) claims; 4) other assets; 5) expenses for future periods and accumulated capital; 6) liabilities.
The selection of these indicators is based on the following criteria – availability, transparency, potential for collection and analysis, respect for trade secrets. During the creation of a BI other indicators can be selected as well.
Mathematical model used in calculations
The model min-max normalization was chosen for calculating the separate indicators. The way of applying this method is to subtract the maximum value from the value in question and then divide by the range of data of the indicator. However, a danger exists that the so called extreme values could obstruct the transformation of data into an indicator. On the other hand, the min-max normalization could enhance the scope of the indicators situated in a small interval, which enhances the effect of the complex index.
The formula used during the calculations according to this method:
Where:
x - value of the indicator for the fund in question; min (n) – minimum value from the group of indicators; max (n) – maximum value from the group of indicators;
When calculating and comparing VHIF we used published data from CFS prior to October 2008.
When calculating and comparing we did not utilize the І pillar, due to lack of actual data.
Results
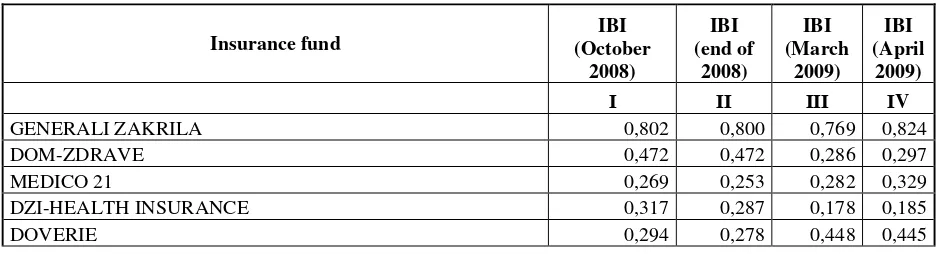
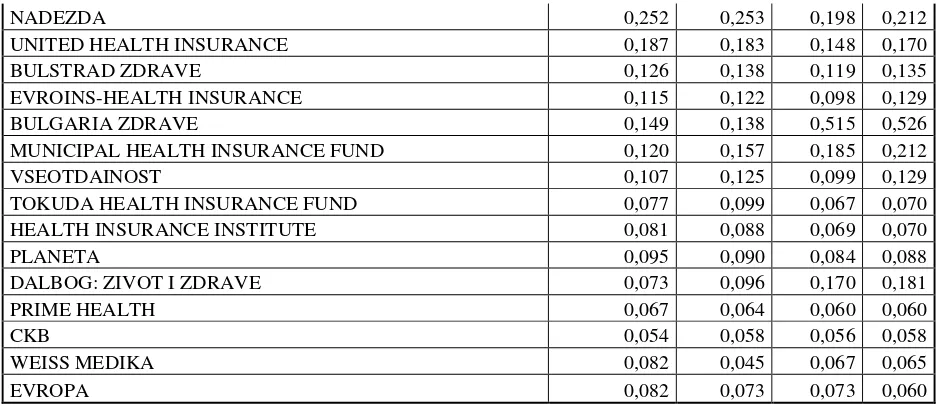
[image:7.595.66.536.635.762.2]After calculating the separate indicators in the pillars, we obtained the following results:
Table 5. Integral Benchmark Index (IBI) of VHIF
Insurance fund
IBI (October
2008)
IBI (end of
2008)
IBI (March
2009)
IBI (April
2009)
І ІІ ІІІ ІV
GENERALI ZAKRILA 0,802 0,800 0,769 0,824
DOM-ZDRAVE 0,472 0,472 0,286 0,297
MEDICO 21 0,269 0,253 0,282 0,329
DZI-HEALTH INSURANCE 0,317 0,287 0,178 0,185
NADEZDA 0,252 0,253 0,198 0,212
UNITED HEALTH INSURANCE 0,187 0,183 0,148 0,170
BULSTRAD ZDRAVE 0,126 0,138 0,119 0,135
EVROINS-HEALTH INSURANCE 0,115 0,122 0,098 0,129
BULGARIA ZDRAVE 0,149 0,138 0,515 0,526
MUNICIPAL HEALTH INSURANCE FUND 0,120 0,157 0,185 0,212
VSEOTDAINOST 0,107 0,125 0,099 0,129
TOKUDA HEALTH INSURANCE FUND 0,077 0,099 0,067 0,070
HEALTH INSURANCE INSTITUTE 0,081 0,088 0,069 0,070
PLANETA 0,095 0,090 0,084 0,088
DALBOG: ZIVOT I ZDRAVE 0,073 0,096 0,170 0,181
PRIME HEALTH 0,067 0,064 0,060 0,060
CKB 0,054 0,058 0,056 0,058
WEISS MEDIKA 0,082 0,045 0,067 0,065
EVROPA 0,082 0,073 0,073 0,060
[image:8.595.66.539.69.272.2]It is evident from the data, that there is a tendency for increase in the indicators for the leading insurance funds. The opposite result for some funds hints at deterioration in their activities (last four in the table).
Table 6. Ranking analysis of VHIF
Insurance fund
RANK (October
2008)
RANK (end of 2008)
RANK (March 2009)
RANK (April 2009)
І ІІ ІІІ ІV
GENERALI ZAKRILA 1 1 1 1
DOM-ZDRAVE 2 2 4 5
MEDICO 21 5 5 5 4
DZI-HEALTH INSURANCE 3 3 8 8
DOVERIE 4 4 3 3
NADEZDA 6 6 6 7
UNITED HEALTH INSURANCE 7 7 10 10
BULSTRAD ZDRAVE 9 9 11 11
EVROINS-HEALTH INSURANCE 11 12 13 12
BULGARIA ZDRAVE 8 10 2 2
MUNICIPAL HEALTH INSURANCE FUND 10 8 7 6
VSEOTDAINOST 12 11 12 13
TOKUDA HEALTH INSURANCE FUND 17 13 18 16
HEALTH INSURANCE INSTITUTE 16 16 16 15
PLANETA 13 15 14 14
DALBOG: ZIVOT I ZDRAVE 18 14 9 9
PRIME HEALTH 19 18 19 19
CKB 20 19 20 20
WEISS MEDIKA 14 20 17 17
EVROPA 14 17 15 18
Table 7. Market share of VHIF for the ІІІ and ІV observed period
Insurance fund Market
share
[image:8.595.68.535.368.691.2]ІІІ ІV
GENERALI ZAKRILA 19,46% 19,25%
DOM-ZDRAVE 8,50% 8,43%
MEDICO 21 12,61% 13,36%
DZI-HEALTH INSURANCE 2,51% 2,35%
DOVERIE 16,07% 13,83%
NADEZDA 2,86% 3,13%
UNITED HEALTH INSURANCE 2,50% 3,15%
BULSTRAD ZDRAVE 1,26% 1,89%
EVROINS-HEALTH INSURANCE 1,28% 2,34%
BULGARIA ZDRAVE 21,43% 18,51%
MUNICIPAL HEALTH INSURANCE FUND 4,52% 5,08%
VSEOTDAINOST 0,22% 1,25%
TOKUDA HEALTH INSURANCE FUND 0,66% 0,70%
HEALTH INSURANCE INSTITUTE 0,51% 0,44%
PLANETA 0,36% 0,41%
DALBOG: ZIVOT I ZDRAVE 4,26% 4,92%
PRIME HEALTH 0,22% 0,27%
CKB 0,05% 0,09%
WEISS MEDIKA 0,74% 0,61%
EVROPA 0,00% 0,00%
When comparing data from IBI, rank analysis and market shares, it becomes evident that, although VHIF “Bulgaria Zdrave” occupies in the III period first place according to market share, it doesn’t come first in terms of IBI and ranking.
The IBI presented here allows assessing and comparing the position of each and every VHIF, additionally allowing interested professionals to base their managerial decisions on supplementary analysis of each indicator and pillar. The comparison by each indicator separately demonstrates that real analysis and ranking is impossible without the application of the integral index. When looking at the VHIF ranking according to market share, one finds it different from the ranking according to IBI, because of the inherent higher informational value of the latter.
Conclusions and recommendations
On the basis of the presented analysis and proposed methodology we formulated the following conclusions and recommendations:
1. It is necessary to develop models and methods for analysis, assessment and ranking of VHIF, allowing the spreading of transparent and adequate information for the needs of the general public and involved professionals.
2. The data published by CFS, which is a predominantly regulatory and surveillance body, are not sufficient for the analysis and comparison of VHIF activities.
3. It is necessary for the Association of VHIF to assist in the introduction of independent assessment and ranking of VHIF, which will make their activities transparent in society.
4. The proposed methodology enhances the opportunities for patients and company managers to make informed choices when choosing health insurance policies.
Literature
1. Advisory Group on the Risk Equalisation Scheme (1998). Report of the Advisory Group on the Risk Equalisation Scheme: the Minister for Health and Children’s independent review of the Risk Equalisation Scheme. Dublin, Advisory Group on the Risk Equalisation Scheme.
2. Anell A, Svarvar P (1999). Health care reforms and cost containment in Sweden. In : Mossialos E, Le Grand J, eds.
Health care and cost containment in the European Union. Aldershot, Ashgate.
3. Beck K, Zweifel P (1998). Cream-skimming in deregulated social health insurance: evidence from Switzerland.
Developments in Health Economics and Public Policy, 6:211–227.
4. Datamonitor (2000a). European health insurance 2000: what’s the prognosis, doctor? London, Datamonitor.
5. European Commission (1997). Liberalisation of insurance in the single market – an update. Dated 15 October 1997. Brussels, European Commission (http: //europa.eu.int/comm/internal_market/en/finances/insur/87.htm, accessed 5 January 2002).
6. Gauthier A, Lamphere J, Barrand N (1995). Risk selection in the health care market: a workshop overview. Inquiry,
32:14–22.
7. Gulliford MC et al. (2001). Access to health care: a scoping exercise. London, National Health Service (NHS) Service Delivery and Organisation Research and Development Programme.
8. Knight J (2000). Private medical insurance: how to get the best care and treatment for you and your family at the lowest price. Moneywise, July.
9. Kulu-Glasgow I, Delnoij D, de Bakker D (1998). Self-referral in a gatekeeping system: patients’ reasons for skipping the general practitioner. Health Policy, 45: 221–223.
10.Manning WG, Marquis MS (1989). Health insurance: the trade-off between risk pooling and moral hazard. Santa Monica, RAND Corporation (Pub. No. R- 3729-NCHSR).
11.Mossialos Elias, S. Thomson. Voluntary health insurance in the European Union. European Observatory on Health Systems and Policies ISBN 92 890 1065 7
12.Natarajan K (1996). European health insurance markets: opportunity or false dawn? London, FT Financial Publishing/Pearson Professional.
13.Office of Fair Trading (OFT) (2000b). Health insurers improve consumer information [press release]. Dated 3 July 2000. London, OFT.
14.Van de Ven WPMM, van Vliet R (1992). How can we prevent cream skimming in a competitive health insurance market? The great challenge for the 90s. In: Zweifel P, Frech III H, eds. Health economics worldwide. Amsterdam, Kluwer. 15.Youngman I (1994). The health insurance opportunity: a worldwide study of private medical insurance markets. Dublin, Lafferty.
16.Б. Давидов Сравнителен анализ намодели за финансираненамедицински услуги: философияи технология
(Продължение III ) - 4, 2004, № 2, 37-42. ISSN 1311-9982
17.Борджуков, Светослав. Допълнителнотоздравноосигуряванетрябвадаедопълнителноизафинансирането: Със СветославБорджуков, зам.-предс. наУСнаАсоц. налицензиранитедружествазадоброволноздравноосигуряванеи прокуриств Булстрад - Здравноосигуряване, разговаряГерганаИванова. // Пари, ХII, N 139, 23 юли 2003, с. 18. ISSN: 0861-5608
18.В. Петков - Новинивобласттаназдравнотоосигуряване. 2, 2002, № 2, 50. ISSN 1311-9982
19.В. Петков - Политика надоброваолнотоздравно осигуряванев Европейския съюз. 1, 2001, № 1, 26-27. ISSN 1311-9982
20.В. Петков Отношениенапациентитекъмздравнотоосигуряване - 5, 2005, № 1, 10-13. ISSN 1311-9982
21.В. Петков, Н. Попов, М. Дякова Анализиоценканачастенздравноосигурителенфонд. (Първачаст - качествени резултати) - 6, 2006, № 4, 35-41. ISSN 1311-9982
22.В. Петков, Н. Попов, М. Дякова Анализ и оценка на частен здравноосигурителен фонд (Втора част -
количественирезултати) - 6, 2006, № 5, 34-39. ISSN 1311-9982
23.Велева, Габриела. ДоброволноздравноосигуряваневЕвропейскиясъюз / Г. Велева . // Здравенмениджмънт, IV, 2004, N 4, с. 9-13. ISSN: 1311-9982
24.Виткова, Мими. ВЕвропаобщественотоичастнотоздравноосигуряванесеразвиватедновременно : [Интервюс]
предс. наАсоц. налицензиранитед-вазадоброволноздравноосигуряване / МимиВиткова. // Застраховател, XIII, N 7, 12 - 26 апр. 2006, с. 13. ISSN: 1310-2397
25.Г. Велева ДоброволноздравноосигуряваневЕвропейскиясъюз - 4, 2004, № 4, 9-13. ISSN 1311-9982
26.Гълъбинов, Румен. Надзор на дейността по доброволно здравно осигуряване в Република България / Румен Гълъбинов. // Банки. Инвестиции. Пари, 2003, N 3, с. 20-26. ISSN: 1311-7947
27.Гълъбинов, Румен. Надзор на дейността по доброволно здравно осигуряване в Република България / Румен Гълъбинов. // Застраховател, IХ, N 9, 14 - 28 май 2003, с. 12-13. ISSN: 1310-2397
28.Е. Шипковенска, М. Дякова, Д. Кръшков Модели на здравно осигуряване в Европа и регулирана предприемаческадейноствсистематаназдравеопазване - 8, 2008, № 3, 57-65. ISSN 1311-9982
29.И. Мишева Мотивациянапотребителитеназдравнизастраховкивусловиятаназдравноосигурителнасистема. - 5, 2005, № 5, 8-13. ISSN 1311-9982
30.И. Мишева ЗдравнозастрахованеИзд. СА "Д. Ценов", Свищов 2005 - 5, 2005, № 6, 58. ISSN 1311-9982
31.Иванова, Величка. Здравното осигуряване - задължително и доброволно / Величка Иванова. // Икономически живот, XXVIII, N 31, 4 авг. 1993, с. 6. ISSN: 0205-0994
32.Иванчев, Никола. Данъчнотретираненавноскитенафизическилицазадоброволноосигуряванеизастраховане /
33.К. Алексиева ПравнорегулираненапазаранадоброволнитездравноосигурителниуслугивБългария - 6, 2006,
№ 5, 28-33. ISSN 1311-9982
34.К. Чамов Бенчмаркингъткатоздравно-политическатехнология - 7, 2007, № 2, 18-25. ISSN 1311-9982 35.М. Владимирова Приватизация, регулиранеипазарвздравеопазването - 4, 2004, № 2, 60-63. ISSN 1311-9982
36.М. Дякова, Н. Попов, В. Петков “Infosure” - новинструментзаанализиоценканаздравно-осигурителнисхеми - 6, 2006, № 1, 25-29. ISSN 1311-9982
37.М. Траяноски и В. Лазаревик Пазарътвздравеопазването - цении ценообразуваневздравеопазването . - 7, 2007, №4, 58-62. ISSN 1311-9982
38.М. Траяноски, В. Лазаревик Доброволнотоздравно осигуряване – възможност за ползваненадопълнителни здравниуслуги извънобхвата на задължителнотоосигуряване. Сп. “Здравенмениджмънт” - 8, 2008, № 6, 89-91. ISSN 1311-9982
39.М. Траяноски,В. Лазаревик, В. Спиркоски Основенпакет отздравниуслугиидопълнителни възможностиза развитиеназдравнотоосигуряваневМакедония. - 8, 2008, № 5, 117- 122. ISSN 1311-9982
40.Н. Попов Здравноосигурителните резерви на дружествата за доброволно здравно осигуряване логика,
нормативнауредбаипрактика. - 8, 2008, № 5, 29-31. ISSN 1311-9982
41.Н. Попов, В. Петков Дружестватазадоброволноздравноосигуряване - структурисгарантиранастабилности сигурност - 5, 2005, № 4, 43-45. ISSN 1311-9982
42.Н. Попов, В. Петков, Л. Спасов Колкобихтеинвестираливздраветоси? - 5, 2005, № 3, 27-29. ISSN 1311-9982 43.Н.Попов, В. Петков Развитие на пазара на доброволното здравно осигуряване в контекста на българската икономика - 6, 2006, № 6, 41-44 ISSN 1311-9982
44.Петков, Н. ДоброволноздравноосигуряваневБългария / Н. Петков. // Социалнамедицина, I, 1994, N 3-4, с. 28-30. ISSN: 1310-1757
45.Попов, Н. Дружестватазадоброволноздравноосигуряване - структурисгарантиранастабилностисигурност /
Н. Попов, В. Петков. // Здравен мениджмънт , V, 2005, N 4, с. 43-45. ISSN: 1311-9982
46.Раковска, Гергана. Принципии практикив системитеза задължителноидоброволноздравно осигуряване / Г.
Раковска. // Социалнамедицина, XI, 2003, N 1, с. 12-14. ISSN: 1310-1757
47.С. Максимова Дългосрочнатаоценка - критерийзакачествотоназдравеопазнатадейност - 4, 2004, № 4, 41-43. ISSN 1311-9982
48.С. Николова - Фактори, влияещивърхупотреблението намедицинскапомощ. 1, 2001, № 1, 36-38. ISSN 1311-9982
49.СалчевП., Л. Георгиева, Принципиипрактикивздравнотоипенсионно осигуряване, София, 2008, ISBN 978-954-92302-1-5
50.Сн. Кондева Закогое (не)справедливаздравноосигурителнатасистема - 6, 2006, № 6, 7-9. ISSN 1311-9982 51.Ст. Гладилов и Н. Велева Търсенеи предлаганевздравеопазването : основнипонятияиприложениетоимв условиятанареформанабългарскотоздравеопазване - 5, 2005, № 1, 32-36. ISSN 1311-9982
52.Ст. Гладилов Финансиране на здравеопазването в условията на присъединяване на България към Обединена Европа - 6, 2006, № 6, 13-15. ISSN 1311-9982