Published Online December 2013 in SciRes (http://www.scirp.org/journal/ce) http://dx.doi.org/10.4236/ce.2013.412A1001
Applying Quantification of Qualitative Verbal Data to
Asynchronous Written Discourse
Jamie Costley
1, Seung Lock Han
21Department of English Education, Kongju National University, Kongju, South Korea 2Department of Education, Kongju National University, Kongju, South Korea
Email: [email protected]
Received September 13th, 2103; revised October 13th, 2013; accepted October 20th, 2013
Copyright © 2013 Jamie Costley, Seung Lock Han. This is an open access article distributed under the Creative Commons Attribution License, which permits unrestricted use, distribution, and reproduction in any medium, provided the original work is properly cited. In accordance of the Creative Commons Attribution License all Copyrights © 2013 are reserved for SCIRP and the owner of the intellectual property Jamie Costley, Seung Lock Han. All Copyright © 2013 are guarded by law and by SCIRP as a guardian.
As more and more universities start to implement online components, the need to build online learning communities grows. An important and widely used type of online community is the internet forum. Inter-net forums operate asynchronously and each member can create threads and reply to others threads. Ex-amination of each member’s writings can give valuable insight into the online community and the learn-ing that is taklearn-ing place within. This paper systematizes a method for researchers to investigate discussions on online forums. More specifically this paper lays out an 8-step process that a researcher may follow when investigating discussions on online forums.
Keywords: Coding; Asynchronous; Verbal Data; Quantification; Qualitative
Introduction
When learners interact there are three aspects or variables which can be measured. The first is volume of interaction,
which is the amount a learner produces within the interaction. This can be measured easily in asynchronous online forums by a simple post count and if one wishes to go deeper, the length of the posts can also be analyzed. The second aspect is with
whom the interaction takes place. The learner may be directing
her comment or question to the whole community, or to some-one in particular. This variable can at times be difficult to measure and can shed some insights into the manner and nature of any particular interaction. The third aspect is the content of the particular utterance, or in the case of a forum, the post.
Analyses of learner-created content have been a useful addition for researching learning for some time. This being said, turning subjective utterances into objective quantifiable data can be by its very nature chaotic and confusing. This paper provides a fra- mework under which the content of online asynchronous fo-rums can be codified and assessed. The ability to put data gath-ered in a qualitative manner into a clear-cut form can be done by many methods. This paper will follow Chi’s (1997) structural guide for making decisions on quantifying qualitative data.
The first step that needs discussing is how qualitative data is to be assimilated into a set of quantitative data that can be ana- lyzed. Quantitative methods provide data that is either numeri- cal or easily codified into a form that is subject to analysis. In this sense quantitative data is a representation of some artifact or idiosyncratic event in the world. Quantitative data is often gathered in unnatural settings or during unnatural events, such as surveys or experiments. Quantitative methods are generally
considered more reliable than qualitative methods but have been criticized for lacking depth and meaning. Qualitative data on the other hand, is often gathered in natural settings, as chil- dren participate in their normal classes for example. Further- more, qualitative data often takes the form of notes or record- ings of events. While it is true that these are also mere repre- sentations of reality, they more closely mimic the nature and form of the reality they seek to represent than do quantitative data. The ease of analysis that quantitative data give us and the depth of meaning that qualitative data provide means that a method of converting qualitative data into quantitative data is a useful addition to understanding whatever research agenda one is pursuing.
The Procedure
Verbal Analysis
A Summary of the Coding Process
After appropriate data has been collected, the first step is to determine whether all data collected will be analyzed or will the data be sampled and that set analyzed. Once that decision has been made, the data chosen for analysis needs to be parsed into units appropriate for coding. This step is generally needed in that the coders need to determine the unit under analysis. Some types of analysis in which particular set phrases or words are picked out of large chunks of data often don’t require unit pars- ing. Examples of this type of data would be some forms of corpus analysis and data mining. The third step is for the cod- ing scheme to be chosen. This step is sometimes done before the study commences. However, in many cases the nature of the data can require a rethinking of the coding scheme at this point in the analysis. The fourth step is for the coders and researchers to make decisions regarding what will be accepted in the data as an example of the code. What particular utterances provide evidence for the coding scheme? This process can take time and require multiple meetings between the coders and researcher and a unique rubric should be designed for the coding. This fourth step also includes the coding of the data. This is because Chi (1997) sees discussion of coding rules and the process of coding to go hand in hand. After the coding of the data, the fifth step is the representation of the data. This representation is usually numerical but can be graphical. Once a representation has been created, the researcher can analyze the data and search for patterns, and then those patterns and analyses can be inter- preted. In the eighth step, Chi (1997) recommends going through the steps multiple times and making different decisions to ascertain if further insight can be gained. Furthermore, in some cases a more detailed analysis is required to answer the research questions.
The summary given runs through eight different steps. One may get the impression that it is a linear process; however that is not the case. The sequence described must be thought of as a holistic process as the research must predict future needs based on future decisions when making choices earlier in the chain. In some cases making choices at certain steps can preclude choic-es later in the rchoic-esearch procchoic-ess. An example would be if at step 3 a coding formula that wasn’t conducive to numerical opera-tionalization was used, then at step 6 many forms of pattern seeking and analysis wouldn’t be available to the researcher. In that case, another type of coding may need to be developed or chosen, or the research questions may need to be limited.
Chi’s (1997) eight steps for coding and analyzing verbal data 1) Choosing the sample
2) Choosing the unit size of each sample 3) Choosing or creating the coding scheme
4) Choosing how the coding scheme will be implemented and coding the data
5) Representing the coded data in a way that can be analyzed 6) Analyzing the data
7) Interpreting the analysis
8) Repeating some or all of the steps for greater clarity
Choosing the Sample
After data collection and transcription (in the case of re- corded data) decisions about how much or how little of the data is to be coded can be made. In some cases, this decision can be made before data is even collected. This is because in the case
of recorded audio or video, simple transcription of the data can take a great deal of time, up to 5 hours of transcription time for 1 hour of audio or video (Himmelmann, 1998). Furthermore, in the case of data that has been written by the subjects, there may be simply too much data to organize and prepare for sampling. Many large internet forums fall into this category, and decisions on sampling may need to be made before data collection. Ac- cording to Chi (1997) there are three important heuristics to be used for sampling: 1) taking a random sample; 2) selecting content based on a “non-content” criterion; 3) do a basic coding of the whole data set then recode parts in more detail.
Random sampling is the most commonly used method in most research and involves either the selection of a random subject or case. What is important to note about random sam- pling as it pertains to this type of protocol is that the sampling can be done at the level of the individual subject, or the case, or data example. For example, one might choose to sample ran- dom postings or threads on a message board rather than the individuals who made the posts. The second heuristic involves selection based on a criterion chosen by the researcher. If a researcher was particularly interested in group planning on a message board, he or she may choose to analyze only those threads in which there were a certain number of responses. In Wang, Woo, & Zhao (2009), one of the research questions was “the extent to which individual reflection promoted critical thinking and knowledge construction”. To this end they sam- pled only examples posted in the student reflection section of the online environment they had created. The third heuristic Chi describes is taking a subset of already coded data and analyzing it in detail. An example of this would be selecting only those threads which contain questions and responses, as in this re- search.
This research is concerned with critical thinking in an online environment and how it relates to features of the learners and their interactions. For this reason only threads with more than 4 posts that contained a question as the original post were coded. This required a preliminary code, to find threads that met the two requirements stated above. This method has the drawback of limiting the total amount of data analyzed and the potential for missing phenomena related to the research question by vir- tue of those phenomena being excluded by the sample regime. However, the forum used in this research contained more than four thousand posts involving one thousand topics. In a case of this type it is necessary to reduce the data set to be coded.
Choosing the Unit Size for Coding
Once the sample has been chosen, the unit size for the coding sample needs to be decided. There are four elements that go into deciding the unit size: 1) grain size of each unit; 2) the relationship of grain size to research questions; 3) the nature of the data; 4) whether or not division of sample is needed (Chi, 1997).
forum, “How should I prepare for the Korean history exam required for all education students?” In the first case the whole post was coded as one unit:
“Don’t worry. U can do it!!!!!!!! I just studied that for 5 days. I passed the exam at once. It is easy enough for me to pass it at once. I recommend Mr. Choi in EBS. His full name is Choi, Tae-seong. He is very famous as Korean-history teacher. If you take his class in cyber, you can feel that Korean history is easy. Cheer up! Anyway, it’s time for my dinner, Good luck~~~~~~”
(R+ Relevant statement; N+ Novelty, New information or ideas, O+ Bringing outside information to help with the prob-lem. C+ Critical assessment/evaluation of own or others con-tribution).
In this second example of grain size, as opposed to coding as a whole post, the coding was done at the level of the sentence:
“Don’t worry. U can do it!!!!!!!! I just studied that for 5 days. I passed the exam at once. It is easy enough for me to pass it at once (OK+ Evidence of using previous knowledge). I recom- mend Mr. Choi in EBSR (R+ Relevant statement, NS+ New
solutions to problems). His full name is Choi, Tae-seong. He is very famous as Korean-history teacher. If you take his class in cyber, you can feel that Korean history is easy (C+ Critical
assessment/evaluation of own or others contribution). Cheer up! Anyway, it’s time for my dinner,(R− Irrelevant statement) Good luck~~~~~~”.
Depending on the grain size analysis we get two different versions of the same text using the same coding system. In these particular examples there are three key differences that should be noted: 1) Coding at the larger grain size is faster but allows less detail; 2) Coding at the smaller grain size allows coders and researchers to see which statements lead to which examples of the particular code. This can complicate inter-rater reliability in the short term, but in the long term it allows easier definitions of particular types of states and operationalization of the coding system; 3) As can be seen with the example of rele- vance (R+ or R−), the smaller grain size can allow conflicting coding within the same post. This allows for greater detail and more depth in the research.
The most important question when deciding grain size are the research questions. Coarser grain size allows for more data to be coded and in some cases it can give a better understanding of the topic being researched. Finer grains can lead to over complicating or over detailed analyses that do not contribute to answering the research questions. In this research, ratios are created to assess how much any particular learner is exhibiting critical thinking in an online asynchronous environment. There- fore it was decided that a smaller grain size was more appropri- ate and a sentence by sentence grain size was chosen. This is because the sentence level of analysis allows a greater degree of analysis and a higher conformance in inter-rater reliability.
Once the choice has been made of grain size a choice needs to be made on the protocols of separation of each unit. In the case of using an individual post, the segmentation protocol is simple as each post represents not only a unit of analysis but also a unit that is easily separated visually. In the case of re- corded data, segmentation can become trickier. For example, if the choice has been made to segment data based at the sentence level, how are interrupts treated? Student A, “I think the more important thing about study is hard work….” Student B, “Yeah!” Student A, “….. and having a good relationship with your teacher and peers.” Cases like this can seem to be self explanatory, however, when there is a great deal of data and
multiple coders being used, clear protocols need to be devel- oped for segmenting each unit of analysis. In this study the non-content feature of punctuation was used. The data collected in this study was written as opposed to spoken so separating each individual sentence was reasonably simple and quick. There were three clear features that were used to divide each sentence: a full stop, a question mark, or an exclamation mark. Furthermore, the nature of the forum was informal therefore there were cases where “proper” punctuation wasn’t used. In the above examples from the forum the student used “~~~~~~” to end a sentence. These cases were very clear and there was 100% inter-rater reliability on a sample of 200 sentences over where the sentence began and ended. One of the ways the cod- ing scheme in this research differs from Newman, Webb, and Cochrane’s scheme is in the difference of unit size delineation. In Newman, Webb and Cochrane’s coding scheme the unit size is ill-defined and varies between the level of the sentence, idea, phrase or message.
Creating or Choosing a Coding Scheme
After the unit size and a method of segmentation have been chosen, coding can begin. This point in the process is the most variable and complex, because this is the point at which the researcher’s varied questions, area being studied and theoretical background come most into play. In the beginning it must be noted that a coding scheme has several possible purposes. It may be to summarize or condense the data. In this type of case the purpose is to allow the researcher to get an overview of the data and gain understanding through seeing the larger picture. In the case of reducing the data, the data is put into a form in which it can be analyzed outside of the data set from which it comes (Salanda, 2009). According to Lichtman (2006) when coding in education generally, approximately 80 original codes are generated. She goes on to say, those 80 codes are coded into approximately 15 categories. Those 15 categories can be further narrowed into 7 or 8 concepts. Creswell (2006) constructs a differing conceptualization of how many codes to use. Accord- ing to Creswell there should be 5 or 6 basic codes that can then be expanded into 30 more specific codes. In this research 45 codes were created based on Newman, Webb, Cochrane’s (1996) content analysis framework.
The coding choice specifically needs to conform to what the researcher is investigating. An example of this is a coding scheme used in Pena-Shaff and Nicholas (2004) wherein one of the primary research questions was how the users of a bulletin board service utilized the knowledge construction process in developing their understanding of the content of their course. Their coding system was founded on knowledge construction and what elements in that knowledge construction we most closely relate to reflection. For this reason their coding scheme was developed around indicators of knowledge construction: questioning, replying, clarifying, interpreting, disagreeing, as- serting, building consensus, judging, reflecting, and supporting (Pena-Shaff & Nicholas, 2004). As can be seen from this exam- ple (Pena-Shaff & Nicholas, 2004, p. 256):
“Excerpts from the Discussion: Community Networking, Week 4
Clarification/stating facts and identifying assumptions: The concepts of “informed citizen” and “community cohesion” have been debated for many years in the public opinion litera- ture. Some schools say... Others say, informed citizens are...
Interpretation/Conclusive response: So anyway, the con- cepts are valid, although their definitions and importance are debatable.
Reflective questions: What I wonder about is whether com- munity networks will ever play a significant role in the lives of the whole community. Will everyone have computers with network access?...
As can be seen in this except codes are written into the text based on the connection between the text and the theoretical construct the researchers were trying to uncover. This coding scheme was mapped against the knowledge construction proc- ess to develop suggestions for implementing knowledge con- struction in online courses.
The method of coding chosen for this paper is based on Newman, Webb, and Cochrane’s (1996) and Newman, Johnson, Webb, and Cochrane’s (1997) models for assessing the levels of critical thinking in online environments. This model is based on Garrison’s (1992) five stages of critical thinking: identifica- tion, definition, exploration, and integration. Newman, Webb and Cochrane’s method contains ten categories which have various sub categories (see Appendix 1).
Choosing How the Coding Scheme Will Be
Implemented and Coding the Data
After selecting the coding scheme the next step is to decide what in the data will constitute an example of the coding scheme. There are two things that need to be considered as most important: 1) if there are ambiguous pieces of data, how will decisions be made on how to code them? 2) How much will the context of each piece of data be considered when cod- ing each piece of data? As discussed earlier, Newman, Webb and Cochrane’s model of coding critical thinking will be used in this study and one example of their coding is R+ for rele- vance. The example given was: “I recommend Mr. Choi in EBSR (R+ Relevant statement).” This was given when re- sponding to a question about how to prepare for a Korean his- tory test. It is reasonably clear that this comment directly relates to the question asked and is therefore relevant.
In Garrison, Cleveland-Innes, Koole, & Kappelman (2006) their coding scheme sought to bring out aspects of a community of inquiry. They sought to put each relevant utterance into ei- ther the elements of cogitative presence, social presence, or teaching presence. To take cogitative presence as an example, it was then expanded into the categories of triggering event, ex- ploration, integration, and restoration. To operationalize their coding scheme they developed indicators that connected to each category. For example the category of triggering event was operationalized by looking in the data for examples of a sense of puzzlement. To follow Garrison, Cleveland-Innes, Koole & Kappelman’s chain of reasoning: anytime a student expressed a sense of puzzlement (indicator) it would be taken as evidence of a triggering event (category) occurring, any triggering event (category) would be taken as evidence for cognitive presence (element). This chain from data to concept is clear and easy to follow.
In the case of Newman, Webb, and Cochrane’s model this chain is also laid out clearly as in Garrison, Cleveland-Innes,
Koole & Kappelman’s research. Therefore there is only a little detail as to how the coding scheme is operationalized. Like Garrison et al. There are three steps from operationalization to final construct: indicator, category and element. However, unlike Garrison, Cleveland-Innes, Koole & Kappelman, there is only one final element that all indicators lead towards. Another significant difference between Newman, Johnson, Webb, and Cochrane’s and other research of this type is that there are negative indicators as well as positive indicators. Here is an example showing the chain of ideas linking the data to the con- struct. This was a response to a thread about a forum user’s first time teaching: “Last year I was in the same situation with you. I just prepared a lot and made good materials, this helped me a lot (OE+ Drawing on personal experience).” The connection is clear. The statement contained in the quote is a positive ex- ample of drawing on personal experience (indicator) which is
evidence of bringing in outside knowledge to bear on a prob- lem (category) which is considered evidence of critical thinking
(element). An example of negative critical thinking from the data should provide further illumination. This is from the same thread in response to a student suggesting making a PPT: “No that’s impossible to do! (O− Sticking to previous assump- tions)” This statement was found to be wrong as later the stu- dent who made the original post mentioned that PPTs were expected. In this case the quoted statement is an example of
sticking to previous assumptions (indicator) which is evidence
of bringing in outside knowledge to bear on a problem (cate-
gory) and that is considered evidence of critical thinking (ele-
ment). However, in this case it is evidence for a lack of critical thinking or negative critical thinking.
The second point of order in this study is that though each sentence is the unit for coding, the individual post is also a reasonable point for cut off for each subject’s thoughts. Within each post there may be more than one sentence that fits the criteria of any given code. However, within this research, if there is more than one sentence within a given post that could be given a particular code then only the first sentence that can be given that particular code will be given that code. This ex- ample was a response to a question posed by another member of the forum, “How can one become a good teacher?” Every sentence in this post could be coded as relevant:
“in Korea, of course, A teacher is creditable career and it’s really cool (R+ Relevant statement).. in my case, but, if some- one dont want to be a teacher sincerely, Finding another career is also good (R+).! we are still young and we have enough time to think about our future (R+).. I believe it’s helpful to experi- ence anything more and more, even though it be failure (R+).. I think all E.E students are talented (R+).! dont hesitate (R+).!”
This makes the coding messy and more complex than it needs to be. Furthermore, the outcome of this coding system was a ratio of critical thinking for each individual student. Therefore it was decided that only the first sentence containing any particular code in each post would be given that code as can be seen in this second example:
Representing the Coded Data
After coding has been completed, the data need to be repre- sented for two reasons: the first is that it is a way data can be easily understood by people attempting to understand it, and the second reason is that it is simpler to conduct analysis and detect patterns when the data has been given some structured repre- sentation. Both of these reasons are similar to reasons why one would represent quantitative data in a clear analytic form (Chi, 1997). There are essentially two main methods for depicting data: either as a figure or as some kind of table. Tables are more frequent but for many types of analysis depicting data as figures lead to greater illumination.
This data set was input into SPSS statistics data editor for analysis. There are multiple ways to represent any particular set of data. In some cases a simple table representing the frequency of a particular event maybe appropriate, as in this example show- ing how many of the subjects in this study had positive ratios in regards to novelty, bringing in new ideas and info (see Table 1).
When data is represented this way it can be useful, however, depending on the type of research questions being asked. In this research the individual subjects are not under analysis, the point of analysis is the content of the forum itself. Therefore a broader but more in depth analysis is useful as in this example which shows the descriptive statistics for the ratios for novelty,
bringing in new ideas and info (see Table 2).
While Table 1 does provide some illumination to the ques- tion of how much novelty there is in the online asynchronous
forum Table 2 gives a broader and clearer picture of the levels of novelty. In cases data maybe represented visually.For an
example from the literature showing data depicted in a figure, one can look at Lobel, Neubaur and Swedburg’s (2005) inves- tigation of the creation of different directions of discourse de- pending on whether or not the interactions took place online or offline. They used a synchronous web based platform for inter- action and interactions were coded into who was the particular recipient of the message. In their research a visual figure was the most appropriate way to represent the data as can be seen in Figure 1.
This is a visual representation of the data showing the inter- actions between students and with a teacher (the large circle in the middle). The thickness of each line represents the amount of interaction and with whom the interaction took place. The size of the circle represents how much interaction each individual engaged in. This figure clearly shows how data can be better represented in some cases by a figure than a table.
In some cases visual figures will not lead to insight into a particular question. From this research into critical thinking a scatter plot showing the relationship between number of posts
Table 1.
Frequencies of positive or negative ratios: novelty.
Positive 41
Negative 9 Total 50
Table 2.
Descriptive statistics: Novelty.
Category N Minimum Maximum Mean SD
Novelty 37 −.55 1.00 .6492 .39382
Figure 1.
Lobel, Neubaur and Swedburg’s online interaction (2005 p. 7).
and the quality of posts shows no clear relationship. This dem- onstrates that selection of representation system is an important step in answering research questions in the transference of qualitative into quantitative data. An example of a figure that does nothing to illuminate the reader to the research question can be seen in Figure 2.
Analyzing the Data
After a method of representing the data has been chosen, the next step is to analyze the data and find relationships among the variables. In some cases that relationships are easy to see as in this example where we can compare Figure 1 with Figure 2. Lobel, Neubaur and Swedburg investigated the creation of dif- ferent types of discourse centered around whether or not inter- action took place online or in a classroom. They used a syn- chronous web-based platform for interaction, though the inter- action was run by the same teacher and had the same content as the offline interactions. What they found was that the offline interactions fell into what might be called a traditional class- room discourse as shown in Figure 3. That is the interaction was centered on the teacher (expert) and few students took part with a low level of overall interaction during the class. How- ever, in the group that took part in the online synchronous dis- cussion, there was much broader interaction among the students as in the previously shown Figure 2.
In this case the visual representation of the data is the most appropriate for depicting the reality of the interaction.
In this research of critical thinking tables of numerical data will be used for making comparisons, analyzing and looking for pattern. This research has a simple agenda: to see if critical thinking emerges in an online forum and to see what those lev- els are. To that end critical thinking ratios based on Newman, Webb and Cochrane’s (1996) critical thinking constructs have been put into a numerical form and analyzed.
As can be seen from Table 3, each of the categories coded showed positive evidence of critical thinking. A further step in analysis can be taken by combining each category into a one
Figure 2.
[image:6.595.57.287.344.523.2]Relationship between number of posts and quality of those posts.
Figure 3.
Lobel, Neubaur and Swedburg’s offline interaction (2005 p. 7).
Table 3.
The categories: Descriptive statistics.
Category N Min Max Mean SD
Relevance 46 −.67 1.00 .613 .4002
Importance 42 −1.00 1.00 .641 .496
Novelty 37 −.55 1.00 .649 .393
Ambiguity 38 −.87 1.00 .450 .562
Outside 36 −.56 1.00 .591 .515
Linking 32 −1.00 1.00 .404 .581
Justification 37 −.56 1.00 .664 .460
Critical 32 −.56 1.00 .413 .564
Practical 34 −.77 1.00 .457 .547
Understand 31 −.44 1.00 .765 .326
unified concept of critical thinking. As can be seen in Table 4, combination of the individual elements of critical thinking yields a positive ratio.
Interpreting the Analysis
This next stage of the analysis will potentially vary more than any other stage depending on the research questions and theoretical background of the researcher. There are two main avenues that can be followed when interpreting the data: an approach that focuses on the processes occurring during an experiment, or an approach that focuses on the final result of an experiment.
The most effective way to interpret data is to create a clear hypothesis and then argue towards that thesis. To that end a single theoretical framework that is supported by multiple data points leads to being able to strongly hold that the thesis is cor- rect. To those ends a clear and falsifiable hypothesis in neces- sary.
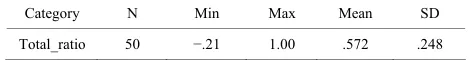
In the case of this research, the single research question does critical thinking emerge in an online forum without prompting?
leads to a clear single hypothesis critical thinking will emerge in an online forum without prompting. In the case of this re- search the hypothesis can be held on two grounds. The first and most obvious is that the construct of critical thinking devised for this research shows that the total ratio in the experiment was positive. The second is that each of the constituent parts that make up the ratio is also positive. These two features of the data show that the hypothesis can be maintained.
Validity and reliability of the analysis also need to be con- sidered at this stage of the research. Validity can be strength- ened through evidence that lies outside the main data set being collected. For example, in this research, the researcher may have collected interview data with the participants of the forum to garner more insight into the occurrence of critical thinking. Other methods of coding that purport to measure the same basic construct can also be used to increase validity. Validity can also be increased by limiting the cases that are considered. In this research it would mean introducing stricter protocols on what would be considered critical thinking. Reliability can be in- creased by increasing the level of inter-rater reliability to be accepted before the data can be fully coded. Furthermore, Chi (1997) mentions recoding the entire data set is another method to increase what she calls “validity”, but would perhaps fall more properly into the category of reliability. Clear and unam- biguous definitions of the construct being examined help to increase reliability. Once clear examples of what will be con- sidered as part of each category and how they contribute to the construct, inter-rater reliability increases. Furthermore, clear- ness in categoryincreasesrefinement and exactionof the analy- sis.
Repeating All or Some of the Steps for Greater
Clarity
It is sometimes useful and perhaps necessary to go through
Table 4.
The combined ratios.
Category N Min Max Mean SD
[image:6.595.57.288.583.735.2] [image:6.595.305.540.705.735.2]the whole process or part of the process of coding and analyz- ing the data again. Commonly, recoding is done when either a different grain size or coding scheme is either useful or neces- sary to answering the research questions. In this respect the data produced on online asynchronous forums is excellent in that it can be easily reexamined regardless of time. Once an experi- ment is completed the data collected can be examined and re- coded multiple times for multiple purposes. Though if an ex- periment is designed for a particular purpose or to answer a specific question, great care must be taken if the data is to be reexamined to answer a different question.
Conclusion
This paper has codified an eight-step process a researcher can use to further understand what is taking place on online for- ums. Using these steps helps clarify a gap in existing research into how to understand the phenomena occurring on these mes-sage boards. Internet forums are a potentially invaluable source of data for researchers looking to understand how learners in-teract with one another.
This paper provides a framework from which researchers can go through the process of quantifying qualitative data. Though the framework provided here is in the form of an eight-step method, in practice each step can be done in nearly any order. The process in and of itself is an organic one.
Acknowledgements
The authors would like to thank Jiyeong Won, Earl Noble and Chris Lange for their contributions and thoughts in the construction and editing of this paper.
REFERENCES
Chi, M. T. H. (1997). Quantifying qualitative analyses of verbal data: A practical guide. The Journal of Learning Sciences, 6, 271-315. http://dx.doi.org/10.1207/s15327809jls0603_1
Creswell. J. W. (2006). Qualitative inquiry and research design: Choo- sing among five approaches. London: Sage Publications.
Himmelmann, N. P. (1998). Documentary and descriptive linguistics.
Linguistics, 6, 161-195.
Garrison, D. R. (1992). Critical thinking and self directed learning in a text based environment: Computer conferencing in higher education.
Adult Education Quarterly, 43, 136-148.
Garrison, D. R., Cleveland-Innes, M., Koole, M., & Kappleman, J. (2006). Revisting methodlogical issues in transcript analysis: Nego- tiated coding and realiablity. Internet and Higher Education, 9, 1-8.
http://dx.doi.org/10.1016/j.iheduc.2005.11.001
Lichtman, M. (2006). Qualitative research in education: A user’s guide. London: Sage Publications.
Newman, D. R., Johnson, C., Webb, B., & Cochrane, C. (1997). Evalu- ating the quality of learning in computer supported co-operative learning. Journal of the American Society for Information Science, 48, 484-495.
http://dx.doi.org/10.1002/(SICI)1097-4571(199706)48:6<484::AID-ASI2>3.0.CO;2-Q
Newman, D. R., Webb, B., & Cochrane, C. (1996). A content analysis method to measure critical thinking in face to face and online sup-ported group work.
http://umsl.edu/~wilmarthp/mrpc-web-resources/CA-analysis-metho d-to-measure-thinking-in-f2f.pdf
Pena-Shaff, J. B., & Nicholas, C. (2004). Analyzing student interac-tions and meaning in computer-mediated bulletin board discussions.
Computers & Education, 42, 243-265. http://dx.doi.org/10.1016/j.compedu.2003.08.003
Salanda, J. (2009). The coding manual for qualitative researchers.
London: Sage Publications.
Wang, Q., Woo, H. L., & Zhoa, J. (2009). Investigating critical thinking and knowledge construction in an interactive learning environment.
Appendix 1
Category Positive Indicator Negative Indicator
R± Relevance R+ Relevant statements R− irrelevant statements, diversions
I± Importance I+ Important points/issues I− unimportant, trivial points/issues
N± Novelty. New info, ideas, NP+ New problem-related information NP− Repeating what has been said
solutions NI+ New ideas for discussion NI− False or trivial leads
NS+ New solutions to problems NS− Accepting first offered solution
NQ+ Welcoming new ideas NQ− Squashing, putting down
new ideas
NL+ learner (student) brings NL− dragged in by tutor
new things in
O± Bringing outside knowledge or OE+ Drawing on personal experience OQ− Squashing attempts to bring in
experience to bear on problem OC+ Refer to course material outside knowledge
OM+ Use relevant outside material O− Sticking to prejudice or
OK+ Evidence of using previous assumptions
knowledge
OP+ Course related problems brought in
OQ+ Welcoming outside knowledge
A± Ambiguities: clarified or confused AC+ Clear, unambiguous statements AC− Confused statements
A+ Discuss ambiguities to clear them up A− Continue to ignore ambiguities
L± Linking ideas, interpretation L+ Linking facts, ideas and notions L− Repeating information without
making inferences or offering
an interpretation.
L+ Generating new data from L− Stating that one shares the ideas
information collected or opinions stated, without taking
these further or adding any
personal comments.
J± Justification JP+ Providing proof or examples JP− Irrelevant or obscuring
questions or examples
JS+ Justifying solutions or judgments JS− Offering judgments or solutions
without explanations or justification
JS+ Setting out advantages and JS− Offering several solutions
disadvantages of situation or solution without suggesting which is
most appropriate.
C± Critical assessment C+ Critical assessment/evaluation of own C− Uncritical acceptance
or others’ contributions. or unreasoned rejection
CT+ Tutor prompts for critical evaluation CT− Tutor uncritically accepts
P± Practical utility (grounding) P+ relate possible solutions to P− discuss in a vacuum (treat as
familiar situations if on Mars)
P+ discuss practical utility of new ideas P− suggest impractical solutions
W± Width of understanding W+ Widen discussion (problem within a W− Narrow discussion. (Address bits
(complete picture) larger perspective. Intervention strategies or fragments of situation. Suggest
within a wider framework.) glib, partial, interventions)