Munich Personal RePEc Archive
Using Rasch analysis to form plausible
health states amenable to valuation: the
development of CORE-6D from
CORE-OM in order to elicit preferences
for common mental health problems
Mavranezouli, I and Brazier, JE and Young, Tracey A. and
Barkham, M
The University of Sheffield
2009
Online at
https://mpra.ub.uni-muenchen.de/29849/
HEDS Discussion Paper 09/09
Disclaimer:
This is a Discussion Paper produced and published by the Health Economics and Decision Science (HEDS) Section at the School of Health and Related Research (ScHARR), University of Sheffield. HEDS Discussion Papers are intended to provide information and encourage discussion on a topic in advance of formal publication. They represent only the views of the authors, and do not necessarily reflect the views or approval of the sponsors.
White Rose Repository URL for this paper:
http://eprints.whiterose.ac.uk/42913/
Once a version of Discussion Paper content is published in a peer-reviewed journal, this typically supersedes the Discussion Paper and readers are invited to cite the published version in preference to the original version.
Published paper
Mavranezouli I, Brazier JE, Young TA, Barkham M. Using Rasch analysis to form plausible health states amenable to valuation: the development of CORE-6D from a measure of common mental health problems (CORE-OM). Qual Life Res 2011;20(3):321-33.
ScHARR
1
H
H
e
e
a
a
l
l
t
t
h
h
E
E
c
c
o
o
n
n
o
o
m
m
i
i
c
c
s
s
a
a
n
n
d
d
D
D
e
e
c
c
i
i
s
s
i
i
o
o
n
n
S
S
c
c
i
i
e
e
n
n
c
c
e
e
D
D
i
i
s
s
c
c
u
u
s
s
s
s
i
i
o
o
n
n
P
P
a
a
p
p
e
e
r
r
S
S
e
e
r
r
i
i
e
e
s
s
No. 09/09
Using
Rasch
analysis
to
form
plausible
health
states
amenable
to
valuation:
the
development
of
CORE
‐
6D
from
CORE
‐
OM
in
order
to
elicit
preferences
for
common
mental
health
problems
Ifigeneia Mavranezouli1,2, John E Brazier1, Tracey A Young1,3, Michael Barkham4
1. Health Economics and Decision Science, School of Health and Related Research,
University of Sheffield, Sheffield, UK
2. National Collaborating Centre for Mental Health, Centre for Outcomes Research
and Effectiveness, Research Department of Clinical, Educational & Health
Psychology, University College London, London, UK
3. Yorkshire and Humber Research Design Service, University of Sheffield,
2
4. Centre for Psychological Services Research, University of Sheffield, Sheffield, UK
Correspondence
to:
Ifigeneia Mavranezouli
National Collaborating Centre for Mental Health, Centre for Outcomes Research and
Effectiveness (CORE), Research Department of Clinical, Educational & Health
Psychology,UCL, Philips House, 1-19 Torrington Place, London, WC1E 7HB,UK
Tel: +44 (0)207 679 1964
Fax: +44 (0)207 91 68 511
e-mail: [email protected]
3
Title: Using Rasch analysis to form plausible health states amenable to valuation:
the development of CORE-6D from CORE-OM in order to elicit preferences for
common mental health problems
Authors: Ifigeneia Mavranezouli1,2, John E Brazier1, Tracey A Young1,3, Michael
Barkham4
1. Health Economics and Decision Science, School of Health and Related Research,
University of Sheffield, Sheffield, UK
2. National Collaborating Centre for Mental Health, Centre for Outcomes Research
and Effectiveness, Research Department of Clinical, Educational & Health
Psychology, University College London, London, UK
3. Yorkshire and Humber Research Design Service, University of Sheffield,
Sheffield, UK
4. Centre for Psychological Services Research, University of Sheffield, Sheffield, UK
Corresponding author:
Ifigeneia Mavranezouli
National Collaborating Centre for Mental Health
Centre for Outcomes Research and Effectiveness (CORE)
Research Department of Clinical, Educational & Health Psychology
4
London WC1E 7HB
UK
Tel: +44 (0)207 679 1964
Fax: +44 (0)207 91 68 511
e-mail: [email protected]
Key-words: Rasch analysis, Health-related quality of Life, Condition-specific
measure, Preference-based-health, health states; CORE-6D, CORE-OM, mental
health, Quality-Adjusted Live Years
Running title: Generating Plausible Health States with Rasch Analysis
Wordcount: 4,463
List of abbreviations:
CORE-OM: Clinical Outcomes in Routine Evaluation Outcome Measure
CSM: Condition-Specific Measure
DIF: Differential Item Functioning
HRQoL: Health-Related Quality of Life
PBM: Preference-Based Measure
SRM: Standardised Response Mean
5 Abstract
Purpose To describe a new approach for deriving a preference-based index from a
condition specific measure that uses Rasch analysis to develop health states.
Methods CORE-OM is a 34-item instrument monitoring clinical outcomes of people
with common mental health problems. CORE-OM is characterised by high
correlation across its domains.Rasch analysis was used to reduce the number of
items and response levels in order to produce a set of unidimensionally-behaving
items, and to generate a credible set of health states corresponding to different
levels of symptom severity using the Rasch item threshold map.
Results The proposed methodology resulted in the development of CORE-6D, a
2-dimensional health state description system consisting of a uni2-dimensionally-
unidimensionally-behaving 5-item emotional component and a physical symptom item. Inspection of
the Rasch item threshold map of the emotional component helped identify a set of 11
plausible health states, which, combined with the physical symptom item levels, will
be used for the valuation of the instrument, resulting in the development of a
preference-based index.
Conclusions This is a useful new approach to develop preference-based measures
where the domains of a measure are characterised by high correlation. The
CORE-6D preference-based index will enable calculation of Quality Adjusted Life Years in
6 INTRODUCTION
Calculation of Quality Adjusted Life Years (QALYs) in cost-utility analysis requires
description and subsequent valuation of health states characterising a disease
area.[1] Generic preference-based measures (PBMs), such as EQ-5D,[2] SF-6D,[3]
and HUI-3,[4] are widely used for this purpose. These instruments consist of a
general health descriptive system, and an algorithm converting each health state into
a utility value. For example, EQ-5D can describe 243 health states, created by
combining 5 dimensions (mobility, self-care, usual activities, pain/discomfort and
depression/anxiety) with 3 levels of response each (no problems, moderate
problems, severe problems). Valuation of a number of these states based on public
preferences and further econometric modelling has resulted in the development of
an algorithm that links each of the 243 health states with a utility value, thus allowing
use of EQ-5D in cost-utility analysis.
Generic PBMs may be inappropriate or insensitive in capturing Health-Related
Quality of Life (HRQoL) in some medical conditions.[5] On the other hand, the
majority of available condition-specific measures (CSMs) are not preference-based.
One solution to this problem has been the “mapping” from CSMs directly onto
generic PBMs (e.g. Refs [6,7]); however, this process may result in limited
performance in terms of model fit and ability to predict values where the overlap
between the generic measure and the CSM is poor.[8,9] For this reason, there has
been an increased interest in the development of PBMs directly from existing CSMs.
CSMs normally consist of a large number of items capturing multiple dimensions of
7
massive number of potential health states that would be impractical to use and
complicated to value. The main approach of dealing with this situation is to develop
health state classifications by selecting 1-2 items from each dimension represented
in a CSM, thus defining a concise set of health states. This approach was first
applied to the generic SF-36 in the development of the SF-6D preference-based
index[3] and has since been used at the development of PBMs from a number of
CSMs.[10-13] Factor analysis can be used in such cases to assess the dimension
structure of a measure, explore potential correlations between dimensions and
suggest appropriate reductions in dimensions.[14] Items can be selected based on
classical psychometric criteria, such as internal consistency and responsiveness to
change. Rasch analysis has also been used at the development of health state
classifications from existing CSMs, in order to select items within dimension and
reduce item response levels.[15,16]
Ideally health state classifications should have a multi-dimensional structure with
little or no correlation between dimensions. This requirement results from the
demands of the valuation stage, where a sample of states is selected for valuation
since it is not practical to value all states. For instruments like EQ-5D and SF-6D that
employ statistical inference, statistical designs such as orthogonal arrays and
balanced designs are used to estimate additive models in order to predict the values
for all potential health states. For the HUI3 that uses multi-attribute utility theory,
‘corner’ states must be valued where one dimension is at the worst level and all
others are at the best level. A major problem arises when items in a health state
classification tap the same or highly correlated dimensions and therefore cannot be
8
states may include combinations of statements that are not plausible (e.g. I feel
happy most of the time and I often feel like crying). This problem is most likely to
arise in the case of CSMs with high correlation between dimensions.
An alternative approach in order to develop plausible health states was described by
Sugar et al.,[17] who conducted k-means cluster analysis using the mental and
physical health composite scores of SF-12 obtained from patients with depression, in
order to assign them into groups of different symptom severity. Cluster analysis
indicated 6 distinct patient groups and respective health states covering 2
dimensions, i.e. mental and physical health. Subsequently, the authors examined the
distribution of patients’ responses on SF-12 in each cluster and found that, for any
item, one or two levels of response accounted for at least 50% of responses in a
cluster. By combining these ‘popular’ item responses, the authors developed health
state descriptions for depression that were clinically meaningful. The advantage of
this approach is that it creates plausible health states and can therefore be employed
for the development of PBMs from CSMs with few and highly correlated dimensions,
where conventional approaches for generating health states (such as orthogonal
arrays) are not appropriate. On the other hand, cluster analysis uses arbitrary cut-off
points for cluster identification and therefore its results need confirmation by clinical
judgement. Moreover, this approach results in a limited number of health states, thus
not covering all states observed in the patient population. A final drawback is that
health descriptions were constructed by combining the most frequent responses for
every item in each cluster. However, these descriptions did not necessarily reflect
the most popular item combinations in the study sample; what’s more, they did not
9
In this paper we propose an alternative approach for constructing PBMs from CSMs
with high correlation between their dimensions, using Rasch analysis. Rasch
analysis has already been used in order to select appropriate items and response
levels from existing multidimensional CSMs.[15,16] Here, we take advantage of
another property of Rasch models relevant to our context, that is, the ability of Rasch
analysis to assign respondents to different points of severity along the latent
variable, based on their responses, and to subsequently generate groups of
respondents of different symptom severity.[18] We have used this attribute of Rasch
models in order to develop plausible health states from the Clinical Outcomes in
Routine Evaluation Outcome Measure (CORE-OM).
METHODS
The Clinical Outcomes in Routine Evaluation - Outcome Measure (CORE-OM)
CORE-OM is an instrument measuring common mental health problems that has
been developed to evaluate the effectiveness of psychological therapies across
multidisciplinary services in the UK.[19] It consists of 34 items, each with 5 levels of
response: ‘not at all’, ‘only occasionally’, ‘sometimes’, ‘often’, and ‘most or all the
time’. The items tap 4 domains considered by practitioners to be necessary
components in a ‘core’ measure: ‘subjective well-being’ (4 items), ‘problems’ (4 items
on depression, 4 items on anxiety, 2 items on physical symptoms and 2 items on
trauma), ‘functioning’ (4 items on general functioning, 4 items on close relationships
and 4 items on social relationships) and ‘risk’ (4 items on risk-to-self and 2 items on
risk-to-others). Eight of the items are positively worded. The dimensional structure of
10
CORE-OM comprises a valid, reliable and acceptable effectiveness measure across
a wide range of practice settings offering psychological therapies.[20,21] It has been
routinely used to evaluate psychological therapies and counselling services in
primary and secondary settings in the UK[19,22] and is a widely used patient-based
tool for measuring mental health outcomes in the British National Health
Service.[23,24] Based on these characteristics and given the scepticism about use of
generic PBMs in mental health and the arguments favouring the development of a
condition-specific PBM in this area,[25-27] CORE-OM was selected as the basis for
constructing a PBM specific to common mental health problems.
With 34 items having 5 levels each, CORE-OM may form a practically
unmanageable number of 534 health states. Previously undertaken factor analysis
identified 3 major components of the instrument: risk items, positively worded items,
and all the remaining items.[20] Examination of correlation across domains
demonstrated that the domains of ‘subjective well-being’, ‘problems’ and ‘functioning’
are highly correlated with each other (in pair-wise examinations of the 3 domains the
Spearman’s ρ value exceeded 0.70 in both clinical and non-clinical populations); the
‘risk’ items also showed high though somewhat lower correlation with the group of all
non-risk items, which included positively worded and remaining items (Spearman’s ρ
value = 0.64 in a clinical sample; 0.44 in a non-clinical sample).[20] Thus generating
states using standard statistical design from the health state classification would not
be appropriate in this case, as it would most likely result in implausible health states.
For this reason, a new method using Rasch analysis was applied, aiming at the
11 The CORE-OM dataset used in Rasch analysis
Data analysed in this study were derived from a database service containing
information on 6,610 clients from 33 NHS primary care services. Data included
CORE-OM scores, as well as patients’ age, gender and ethnicity. Details on the full
dataset and the data collection procedures are available in Evans et al.[22] A
random sample of 1,500 primary care clients formed the initial dataset for the work
presented in this paper [N1500]. Data from a sub-sample of 400 randomly selected
respondents were used for Rasch analysis [N400a]. The analysis was validated on
another random sub-sample of 400 respondents [N400b].
Use of Rasch analysis to select items and identify plausible health states
amenable to valuation
The Rasch model is underpinned by the principles of unidimensionality and local
independence of items. The latter means that once the Rasch factor, i.e. the main
scale, has been accounted for, no further associations between items other than
random associations should exist.[28] Rasch analysis cannot be therefore used as a
primary tool for the development of standard health state classifications, which, by
definition, are multidimensional. In contrast, it can play a significant role at the
development of PBMs derived from existing CSMs where items are strongly
correlated and tend to behave unidimensionally. The objective of this study was to
use Rasch analysis as the primary tool for developing a health state system from
CORE-OM, amenable to valuation.
12
To reduce the number of items and response levels based on a number of set
criteria, so that the final instrument describes a concise number of health states
To ensure that the final instrument comprises a unidimensionally-behaving scale
with local independence between items so that each person’s responses can be
predicted based on his/her symptom severity
To generate health states, described by unique combinations of item responses,
corresponding to different locations across the latent variable, that is, to different
levels of severity along the scale.
The new instrument describing health states for common mental health problems
across 6 domains (named ‘CORE-6D’) was derived from CORE-OM following 4
major steps:
Step 1: Factor analysis
Factor analysis in the form of principal component analysis was undertaken on the
whole dataset [N1500] in order to confirm previous findings and identify major
domains that should be represented in the final measure.
Step 2: Use of Rasch analysis and conventional psychometric tests in order to
exclude items and develop a unidimensionally-behaving scale
Rasch analysis (primarily) and conventional psychometric tests were performed on
all 34 CORE-OM items in sample N400a, in order to discard items non-suitable for
the final instrument and to ultimately develop a unidimensionally-behaving scale. The
13
studies.[15,16] In summary, the following criteria were considered at the
development of CORE-6D:
A. Rasch analysis criteria:
Item level ordering: item-threshold maps were inspected to investigate whether
respondents were able to distinguish between adjacent response levels. When
items had disordered thresholds (i.e. when an item score was likely to decrease
as respondent’s severity increased), then visual inspection of respective category
probability curves determined which adjacent responses to merge. If the only way
to order an item’s thresholds was by merging adjacent responses that were not
clinically meaningful (such as ‘sometimes’ and ‘often’), then this item was
eventually excluded.
Goodness of fit following threshold re-ordering: overall and item fit statistics were
examined to assess whether the whole instrument and individual items fit into the
Rasch model.
Differential Item Functioning (DIF): items demonstrating DIF (that is, responses
depended on patients’ age, gender or ethnicity) were candidates for exclusion.
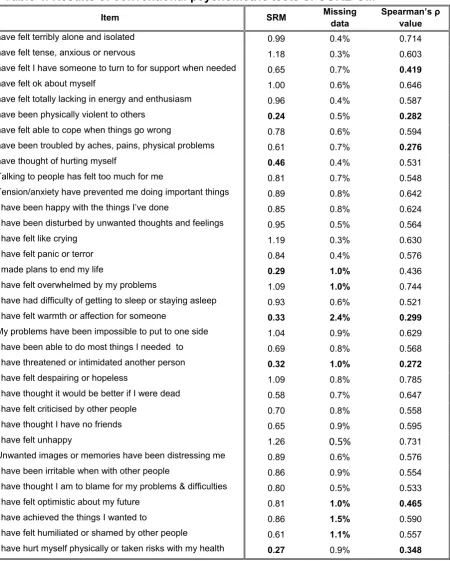
B. Conventional psychometric tests:
Responsiveness to treatment, measured by the standardised response mean
(SRM)
Percentage of missing data
Correlation with total CORE-OM score, expressed by Spearman’s non-parametric
14
Items not fitting into the Rasch model were excluded one at a time followed by
Rasch analysis on the remaining items and subsequent testing of Rasch statistics.
Person-separation index was constantly checked to ensure that the model had good
ability to discriminate amongst different respondent groups. This process was
repeated until all remaining items fit into the Rasch model.
Step 3: Selecting items for the emotional component of CORE-6D
After misfitting items were discarded, a concise, unidimensionally-behaving scale
was constructed from the remaining items, after testing different item combinations
and applying the following criteria:
Model statistics should demonstrate best possible fit of the measure into the
Rasch model. Independent t-tests should ensure unidimensional behaviour of the
final scale.
One item per domain identified by factor analysis should ideally be included in the
final instrument.
Response levels should be the same for all items and reflect clinically meaningful
situations.
The locations of respective thresholds of all items (the points where the
probabilities of adjacent levels of response are equally likely) should ideally
increase with increasing ‘difficulty’ of the item, expressed by its location. This was
checked by visual inspection of the item threshold map and ensured a ‘smooth’
transition of responses from milder to more severe health states.
The final instrument should cover the whole range of symptom severity observed
in the study population, i.e. items should cover different locations across the latent
15
Step 4: Deriving health states from the emotional component of CORE-6D for utility
measurement
The item threshold map was visually inspected after all the above criteria had been
satisfied, to identify plausible health states. Subsequently, the new measure was
validated on sample N400b.
Rasch analysis was performed on RUMM2020;[29] all other statistical analyses were
undertaken using SPSS 11.5.[30]
RESULTS
Factor analysis
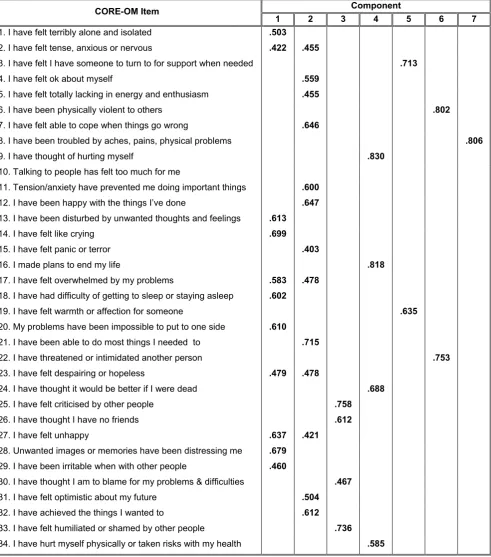
Factor analysis (principal component analysis) identified 7 components in
CORE-OM: physical symptoms, risk-to-others, risk-to-self, social relationships, interpersonal
relationships, depression and anxiety. Although these 7 domains are broadly similar
to some of the conceptual domains and sub-domains of CORE-OM, there are a
number of differences between them, as not all conceptual sub-domains are
represented in factor analysis (for example items of ‘general functioning’ do not load
on a separate factor); moreover, some domains contain a different number of items
(for example, conceptual sub-domain ‘close relationships’ included items 1, 3, 19,
and 26, but ‘interpersonal relationships’ included only items 3 and 19 in our factor
analysis). Twenty of the 34 items loaded on the two factors capturing depression and
anxiety, with some items loading on both. Results of factor analysis are presented in
16
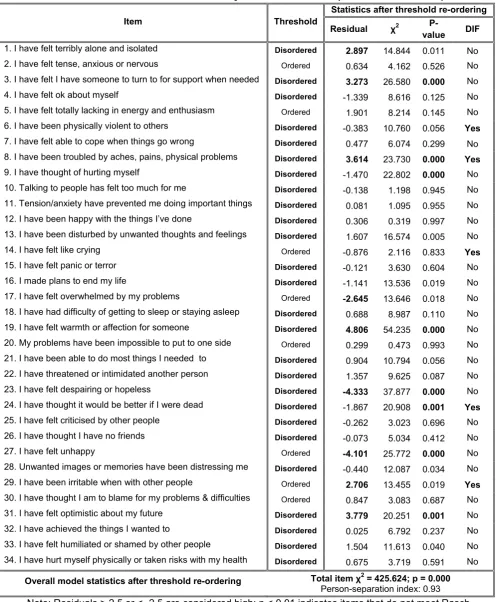
Rasch analysis and conventional psychometric tests for exclusion of items
Rasch analysis on N400a revealed that 26 out of 34 CORE-OM items had
disordered thresholds. Threshold ordering was achieved by merging adjacent
response levels following visual inspection of item category probability curves. After
all thresholds were ordered, goodness of fit was assessed by examining overall
model and individual item statistics. CORE-OM did not fit into the Rasch model, with
11 items showing misfit (either a fit residual > 2.5 or < -2.5 or a χ2 probability
significant at the 0.01 level). Moreover, 6 items demonstrated DIF. Results of Rasch
analysis are shown in Table 3. Table 4 shows the results of conventional
psychometric tests. Based on the results of Rasch analysis (primarily) and
conventional psychometric tests, a number of items were consecutively excluded
from further analysis. This process involved successive Rasch analyses and
examination of model and item statistics after excluding one item at a time, until a
good model fit was achieved.
At an early stage of this process, it was decided to exclude items 6 (I have been
physically violent to others) and 22 (I have threatened or intimidated another person)
that expressed ‘risk-to-others’ in both original sub-domain classification of CORE-OM
and in factor analysis conducted for this study. These items were judged not to be
relevant to a utility measure, as they expressed external behaviour and not people’s
perceptions on their HRQoL. Moreover, both items had very low correlation with the
total CORE-OM score and demonstrated low responsiveness to treatment.
The next item to exclude was item 8 (I have been troubled by aches, pains, physical
17
our factor analysis. This item showed misfit in the Rasch model, demonstrated DIF,
and had very low correlation to the total CORE-OM score. Obviously item 8 cannot
conceptually form part of a unidimensionally-behaving scale measuring emotional
status, the development of which was the aim of Rasch analysis; nevertheless,
‘physical symptoms’ was judged to constitute a major domain that should be
captured by the final PBM; hence, it was decided to exclude item 8 at this stage, and
combine it with the final product of Rasch analysis, thus creating a 2-dimensional
measure tapping emotional and physical symptoms.
Items 23 (I have felt despairing or hopeless) and 27 (I have felt unhappy) showed
significant misfit to the Rasch model with highly negative fit residuals, meaning that
they did not add information on the respondents’ level of symptom severity.
According to clinical judgment these items expressed overall emotional status rather
than certain aspects of it; consequently both were excluded from further analysis.
Items 3 (I have felt I have someone to turn to for support when needed) and 19 (I
have felt warmth or affection for someone), loading on ‘interpersonal relationships’ in
factor analysis, were characterised by strong misfit, low responsiveness and low
correlation with total CORE-OM score. Item 19 had the highest percentage of
missing data. Although it was attempted to retain one of them for inclusion in the final
instrument, consecutive analyses demonstrated constant misfit so both items were
eventually excluded. Therefore ‘interpersonal relationships’ were not represented in
18
Items 14 (I have felt like crying) and 29 (I have been irritable when with other people)
were excluded because they showed persistently significant DIF. Although DIF can
be dealt with by splitting items so as to consider different patient subgroups, we
deemed this process unsuitable and not relevant in our case of developing a PBM,
since we aimed to derive a universal measure capturing the same aspects of HRQoL
across all patient sub-populations.
Following the process of consecutive Rasch analyses and exclusion of misfitting
items one at a time after considering also conventional psychometric tests, 8 more
items were excluded from the instrument (items 5, 9, 18, 24, 28, 30, 31, and 34),
until fit was achieved in the Rasch model. During the whole process we aimed to
retain at least one item per domain identified in factor analysis, even if initially all
items of a domain appeared to misfit, as this misfit could disappear at later stages,
following exclusion of other items and “modification” of the overall model fit.
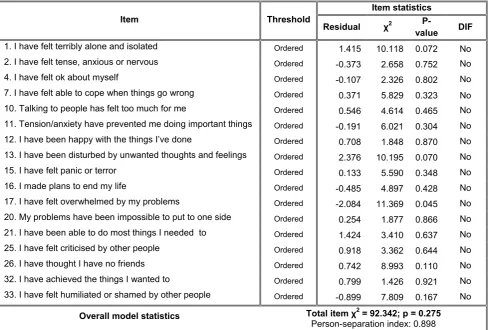
The 17 items of CORE-OM that fitted into the Rasch model and the respective
Rasch statistics are presented in Table 5. The 17-item scale had a good fit (total χ2
probability 0.275) with an excellent ability to discriminate amongst different groups of
respondents (person-separation index 0.898).
Selecting items for the emotional component of CORE-6D
The purpose of this stage of analysis was to further remove items so as to derive a
19
Following exclusion of all items loading on ‘risk-to-others’, ‘physical symptoms’ and
‘interpersonal relationships’ domains, it was judged that the emotional component of
the measure should ideally include one item from each of the remaining domains
identified in factor analysis (that is, depression, anxiety, social relationships,
risk-to-self) plus one positively worded item. Thus, different combinations of items that fit
into the Rasch model were tested, in order to identify a final scale fulfilling this
condition and the other set criteria described in step 3 of the methodology.
The result of these analyses was a measure consisting of 5 items (1, 15, 16, 21, 33),
each with 3 levels of response (‘not at all’, ‘only occasionally or sometimes’, and
‘often, most or all the time’). The person-separation index reached 0.659, which was
deemed acceptable, considering that the ability of the scale to discriminate amongst
different respondent groups needed to be traded off with its conciseness and
convenience in using as a PBM. The scale demonstrated good model fit (χ2
probability 0.69). All 5 items fit into the model, as shown by item fit statistics; no DIF
was observed. Principal component analysis verified the local independence of items
and individual t-tests confirmed the scale’s unidimensional behaviour. The
instrument was validated in N400b. The emotional component of CORE-6D is
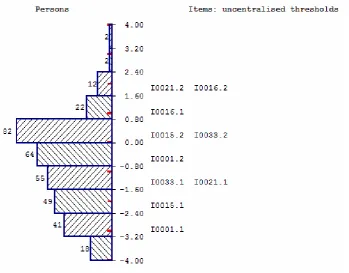
presented in Table 6. The respective item map confirms that the instrument is well
targeted to the study population as it is able to capture the whole range of severity of
mental symptoms, with no floor or ceiling effects and good spread of items across
the full range of respondents’ scores (Figure 1).
Deriving health states from the emotional component of CORE-6D for utility
20
The derivation of states for valuation was based on the item threshold map of the
emotional component of CORE-6D, provided in Figure 2. The map illustrates the
most likely combinations of responses expected to be obtained by people with
common mental health problems at various levels (locations) of symptom severity.
Items have been listed from the easiest (item 1) to the most difficult one (item 16), as
indicated by their average location. Shaded areas 0 (black), 1 (dark grey) and 2 (light
grey) correspond to the 3 response levels, that is, ‘not at all’, ‘only occasionally or
sometimes’, and ‘often, most or all the time’ respectively, with the exception of item
21, which is positively worded and therefore response levels are reversed. Threshold
locations between response levels 0-1 and 1-2 increase (that is, they move to the
right) with increasing difficulty of the item, thus ensuring a smooth transition of
responses from milder to more severe symptoms. The item threshold map allows
prediction of the most likely responses at various levels of symptom severity. For
example, a person whose severity corresponds to location +1 on the logit scale is
expected to most likely respond 22210 (to items 1, 15, 33, 21 and 16, respectively).
The combinations of responses depicted in the threshold map represent plausible
health states in people with common mental health problems. As illustrated in Table
7, 11 distinct health states can be identified. These states covered 37% of complete
responses in N400a. In contrast, the coverage of health states derived using an
orthogonal block design on the full range of 35=243 potential health states of
CORE-6D was only 7%. Moreover, some of the states generated using the latter approach
were not credible, as, for example, they described a situation where a person ‘never
felt alone and isolated’ and at the same time ‘made plans to end their life often, most
21 DISCUSSION AND CONCLUSIONS
This paper proposes a methodology that uses mainly Rasch analysis to develop
plausible health states from existing CSMs that are either unidimensional or
characterised by high correlation between dimensions; in such cases, conventional
approaches for generating states from health state classifications (e.g. orthogonal
block designs) are not appropriate, as, by treating items as independent
(uncorrelated) statements, they are likely to result in formation of implausible health
states. In contrast, the proposed ‘Rasch vignette approach’ helps create credible
health states comprising combinations of item responses observed in a real
population. Indeed, the health states developed with this method represent not only
plausible, but also the most likely combinations of responses over a continuum of
symptom severity, thus allowing prediction of a person’s severity of symptoms based
on his/her responses and vice versa.
One limitation of this approach, similar to the clustering-based approach proposed by
Sugar et al.,[17] is that the number of generated health states is limited and does not
capture the whole range of plausible combinations of responses. In the case of the
emotional component of CORE-6D, the Rasch vignette approach generated 11
health states, which, nevertheless, covered 37% of the study sample’s complete
responses; in contrast, use of an orthogonal block design, which assumes that items
are independent statements, achieved a much lower coverage of 7%, and, more
22
Despite generating a limited number of health states, application of our approach
allows valuation of all potential health states described by CORE-6D: an advantage
of Rasch analysis over the clustering-based approach is that it assigns all potential
health states (i.e. all combinations of item responses including those not illustrated in
item threshold maps) to different locations along the scale according to their level of
severity. The relationship between the health states’ location across the latent
variable and the respective utility values obtained in a valuation exercise can be
estimated and used to generate utility values for all patients completing CORE-OM.
This solution has been explored, using regression techniques, in a subsequent
application of this approach on the Flushing questionnaire, described in a companion
paper.[31] The findings of this latter study show that it is possible to assign
appropriate utility values to all potential health states of a measure based on their
location along the latent variable as estimated by Rasch analysis.
The emotional component of CORE-6D comprises a unidimensionally-bahaving
5-item scale, able to capture the full range of severity of common mental symptoms.
The proposed Rasch vignette approach has led to identification of 11 plausible
health states observed in the study population. These states, combined with 3
response levels (same as for the 5 ‘emotional’ items) of item 8 of the original
CORE-OM (I have been troubled by aches, pains, or physical problems), produce a
2-dimensional set of 11 x 3 = 33 health states that can be used to value the overall
emotional and physical HRQoL in people with common mental health problems. The
next step of this study, currently under way, is to undertake a valuation survey in a
representative sample of the UK population, in order to attach appropriate utility
23
index. This new condition-specific PBM will be appropriate to use in the area of
mental health, where the use of generic PBMs such as EQ-5D has been shown to be
problematic.[27,32,33] Since this measure will have been derived from CORE-OM,
an instrument routinely used for outcome monitoring in people with common mental
health problems in the UK, it is expected that this study will enable wider assessment
of healthcare interventions for the management of common mental health problems
in the form of cost-utility analysis.
Acknowledgements: Ifigeneia Mavranezouli undertook this work as a PhD student
in the School of Health and Related Research at the University of Sheffield. We are
grateful to the UK MRC Methodology Programme for supporting this work and to the
24 References:
1. Brazier, J., Ratcliffe, J., Salomon, J.A., Tsuchiya, A (2007). Measuring and valuing
health benefits for economic evaluation Oxford/New York: Oxford University
Press.
2. Brooks, R., with the EuroQol Group (1996). EuroQol: the current state of play.
Health Policy, 37(1), 53-72.
3. Brazier, J., Roberts, J., Deverill, M. (2002). The estimation of a preference based
measure of health from the SF-36. Journal of Health Economics, 21(2), 271-292.
4. Feeny, D., Furlong, W., Torrance, G.W., Goldsmith, C.H., Zhu, Z., DePauw, S.,
Denton, M., Boyle, M. (2002). Multiattribute and single-attribute utility functions for
the health utilities index mark 3 system. Medical Care, 40(2), 113-128.
5. Brazier, J., Deverill, M., Green, C., Harper, R., Booth, A. (1999). A review of the
use of health status measures in economic evaluation. Health Technology
Assessment, 3(9), 1-164.
6. Tsuchyia, A., Brazier, J., McColl, E., Parkin, D. (2002). Deriving preference-based
condition-specific instruments: converting AQLQ into EQ-5D indices. Sheffield
Health Economics Group Discussion Paper 02/01. Sheffield: School of Health and
Related Research, University of Sheffield.
7. McKenzie, L., Van der Pol, M. (2009). Mapping the EORTC QLQ C-30 onto the
EQ-5D Instrument: The Potential to Estimate QALYs without Generic Preference
Data. Value in Health, 12(1), 167-171.
8. Gray, A.M., Rivero-Arias, O., Clarke, P.M. (2006). Estimating the association
between SF-12 responses and EQ-5D utility values by response mapping.
25
9. Brazier, J., Yang, Y., Tsuchiya, A. (2008). A review of studies mapping (or cross
walking) from non-preference based measures of health to generic
preference-based measures. Sheffield Health Economics Group Discussion Paper 08/02.
Sheffield: School of Health and Related Research, University of Sheffield.
10. Brazier, J.E., Roberts, J., Platts, M., Zoellner, Y.F. (2005). Estimating a
preference-based index for menopausal specific health related quality of life
questionnaire. Health and Quality of Life Outcomes, 3: 13.
11. Yang, Y., Tsuchiya, A., Brazier, J., Young, T. (2006). Estimating a
preference-based single index from the Asthma Quality of Life Questionnaire (AQLQ). Health
Economics and Decision Science Discussion paper No. 07/02. Sheffield: School
of Health and Related Research. Available from:
http://www.shef.ac.uk/scharr/sections/heds/discussion.html
12. Brazier, J., Czoski-Murray, C., Roberts, J., Brown, M., Symonds, T., Kelleher,
C. (2008). Estimation of a preference-based index from a condition-specific
measure: the King's Health Questionnaire. Medical Decision Making, 28(1),
113-126.
13. Yang, Y., Brazier, J., Tsuchiya, A., Coyne, K. (2009). Estimating a
Preference-Based Single Index from the Overactive Bladder Questionnaire. Value
in Health, 12(1), 159-166.
14. Chatfield, C., & Collins, A. J. (1980). Introduction to multivariate analysis.
Cambridge: Chapman and Hall, University Press.
15. Young, T., Yang, Y., Brazier, J., Tsuchiya, A. (2007). The use of Rasch
analysis as a tool in the construction of a preference based measure: the case of
26
Sheffield: School of Health and Related Research. Available from:
http://www.shef.ac.uk/scharr/sections/heds/discussion.html
16. Young, T., Yang, Y., Brazier, J.E., Tsuchiya, A., Coyne, K. (2009). The first
stage of developing preference-based measures: constructing a health-state
classification using Rasch analysis. Quality of Life Research, 18(2), 253-265.
17. Sugar, C.A., Sturm, R., Lee, T.T., Sherbourne, C.D., Olshen, R.A., Wells,
K.B., Lenert, L.A. (1998). Empirically defined health states for depression from the
SF-12. Health Services Research, 33(4 Pt 1), 911-928.
18. Bond, T.G., Fox, C.M. (2006). Applying the Rasch Model: Fundamental
Measurement in the Human Sciences. Mahwah, New Jersey: Lawrence Erlbaum
Associates Inc
19. Barkham, M., Margison, F., Leach, C., Lucock, M., Mellor-Clark, J., Evans, C.,
Benson, L., Connell, J., Audin, K., McGrath, G. (2001). Service profiling and
outcomes benchmarking using the CORE-OM: toward practice-based evidence in
the psychological therapies. Clinical Outcomes in Routine Evaluation-Outcome
Measures. Journal of Consulting and Clinical Psychology, 69(2), 184-96.
20. Evans, C., Connell, J., Barkham, M., Margison, F., McGrath, G., Mellor-Clark,
J., Audin, K. (2002). Towards a standardised brief outcome measure:
psychometric properties and utility of the CORE-OM. British Journal of Psychiatry,
180, 51-60.
21. Barkham, M., Gilbert, N., Connell, J., Marshall, C., Twigg, E. (2005).
Suitability and utility of the CORE-OM and CORE-A for assessing severity of
presenting problems in psychological therapy services based in primary and
27
22. Evans, C., Connell, J., Barkham, M., Marshall, C., Mellor-Clark, J. (2003).
Practice-based evidence: Benchmarking NHS primary care counselling services
at national and local levels. Clinical Psychology & Psychotherapy, 10, 374-388.
23. Barkham, M., Stiles, W.B., Connell, J., Twigg, E., Leach, C., Lucock, M.,
Mellor-Clark, J., Bower, P., King, M., Shapiro, D.A., Hardy, G.E., Greenberg, L.S.,
Angus, L. (2008). Effects of psychological therapies in randomized trials and
practice-based studies. British Journal of Clinical Psychology, 47(Pt 4), 397-415.
24. Jacobs, R. (2009). Investigating Patient Outcome Measures in Mental Health.
CHE Research Paper Number 48. York: Centre for Health Economics, University
of York.
25. Chisholm, D., Healey, A., Knapp, M. (1997). QALYs and mental health care.
Social Psychiatry and Psychiatric Epidemiology, 32(2), 68-75.
26. Knapp, M., Mangalore, R. (2007). "The trouble with QALYs...". Epidemiologia
e Psichiatria Sociale, 16(4), 289-93.
27. Brazier, J. (2008). Measuring and valuing mental health for use in economic
evaluation. Journal of Health Services Research & Policy, 13 (Suppl 3), 70-5.
28. Tennant, A., Conaghan, P. (2007). The Rasch Measurement Model in
Rheumatology: What is it and why use it? When should it be applied, and what
should one look for in a Rasch paper? Arthritis & Rheumatism (Arthritis Care &
Research), 57(8), 358-1362.
29. Andrich, D., Lyne, A., Sheridan, B., Luo, G. (2003). RUMM2020. Perth:
RUMM Laboratory Pty Ltd. http://www.rummlab.com
28
31. Young, T., Rowen, D., Brazier, J.E., Norquist, J., Ambegaonkar, B., Sazonov,
V. Developing Preference-Based Health Measures: Using Rasch Analysis to
Generate Health State Values. Submitted to Quality of Life Research,
32. Moock, J., Kohlmann, T. (2008). Comparing preference-based quality-of-life
measures: results from rehabilitation patients with musculoskeletal,
cardiovascular, or psychosomatic disorders. Quality of Life Research, 17(3),
485-95.
33. van de Willige, G., Wiersma, D., Nienhuis, F.J., Jenner, J.A. (2005). Changes
in quality of life in chronic psychiatric patients: a comparison between EuroQol
29
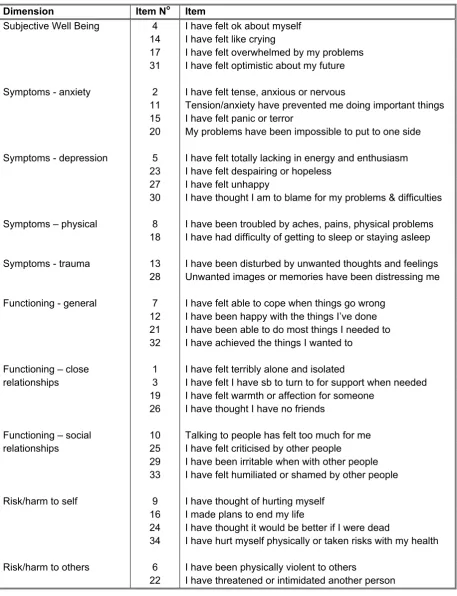
Table 1. The dimensional structure of the CORE-OM Dimension Item No Item
4 I have felt ok about myself 14 I have felt like crying
17 I have felt overwhelmed by my problems Subjective Well Being
31 I have felt optimistic about my future
2 I have felt tense, anxious or nervous
11 Tension/anxiety have prevented me doing important things 15 I have felt panic or terror
Symptoms - anxiety
20 My problems have been impossible to put to one side
5 I have felt totally lacking in energy and enthusiasm 23 I have felt despairing or hopeless
27 I have felt unhappy Symptoms - depression
30 I have thought I am to blame for my problems & difficulties
8 I have been troubled by aches, pains, physical problems Symptoms – physical
18 I have had difficulty of getting to sleep or staying asleep
13 I have been disturbed by unwanted thoughts and feelings Symptoms - trauma
28 Unwanted images or memories have been distressing me
7 I have felt able to cope when things go wrong 12 I have been happy with the things I’ve done 21 I have been able to do most things I needed to Functioning - general
32 I have achieved the things I wanted to
1 I have felt terribly alone and isolated
3 I have felt I have sb to turn to for support when needed 19 I have felt warmth or affection for someone
Functioning – close relationships
26 I have thought I have no friends
10 Talking to people has felt too much for me 25 I have felt criticised by other people
29 I have been irritable when with other people Functioning – social
relationships
33 I have felt humiliated or shamed by other people
9 I have thought of hurting myself 16 I made plans to end my life
24 I have thought it would be better if I were dead Risk/harm to self
34 I have hurt myself physically or taken risks with my health
6 I have been physically violent to others Risk/harm to others
30
Table 2. Results of Factor Analysis – Rotated component matrix. The 7 factors from the
left to the right correspond to the domains of ‘depression’, ‘anxiety’, ‘social relationships’, ‘risk-to-self’, ‘interpersonal relationships’, ‘risk-to-others’ and ‘pain/physical symptoms’, respectively.
Component CORE-OM Item
1 2 3 4 5 6 7
1. I have felt terribly alone and isolated .503
2. I have felt tense, anxious or nervous .422 .455
3. I have felt I have someone to turn to for support when needed .713
4. I have felt ok about myself .559
5. I have felt totally lacking in energy and enthusiasm .455
6. I have been physically violent to others .802
7. I have felt able to cope when things go wrong .646
8. I have been troubled by aches, pains, physical problems .806
9. I have thought of hurting myself .830
10. Talking to people has felt too much for me
11. Tension/anxiety have prevented me doing important things .600
12. I have been happy with the things I’ve done .647
13. I have been disturbed by unwanted thoughts and feelings .613
14. I have felt like crying .699
15. I have felt panic or terror .403
16. I made plans to end my life .818
17. I have felt overwhelmed by my problems .583 .478
18. I have had difficulty of getting to sleep or staying asleep .602
19. I have felt warmth or affection for someone .635
20. My problems have been impossible to put to one side .610
21. I have been able to do most things I needed to .715
22. I have threatened or intimidated another person .753
23. I have felt despairing or hopeless .479 .478
24. I have thought it would be better if I were dead .688
25. I have felt criticised by other people .758
26. I have thought I have no friends .612
27. I have felt unhappy .637 .421
28. Unwanted images or memories have been distressing me .679
29. I have been irritable when with other people .460
30. I have thought I am to blame for my problems & difficulties .467
31. I have felt optimistic about my future .504
32. I have achieved the things I wanted to .612
33. I have felt humiliated or shamed by other people .736
34. I have hurt myself physically or taken risks with my health .585
31
Table 3. Results of initial Rasch analysis of CORE-OM (all items included)
Statistics after threshold re-ordering Item Threshold
Residual χ2
P-value DIF
1. I have felt terribly alone and isolated Disordered 2.897 14.844 0.011 No
2. I have felt tense, anxious or nervous Ordered 0.634 4.162 0.526 No
3. I have felt I have someone to turn to for support when needed Disordered 3.273 26.580 0.000 No
4. I have felt ok about myself Disordered -1.339 8.616 0.125 No
5. I have felt totally lacking in energy and enthusiasm Ordered 1.901 8.214 0.145 No
6. I have been physically violent to others Disordered -0.383 10.760 0.056 Yes
7. I have felt able to cope when things go wrong Disordered 0.477 6.074 0.299 No
8. I have been troubled by aches, pains, physical problems Disordered 3.614 23.730 0.000 Yes
9. I have thought of hurting myself Disordered -1.470 22.802 0.000 No
10. Talking to people has felt too much for me Disordered -0.138 1.198 0.945 No
11. Tension/anxiety have prevented me doing important things Disordered 0.081 1.095 0.955 No
12. I have been happy with the things I’ve done Disordered 0.306 0.319 0.997 No
13. I have been disturbed by unwanted thoughts and feelings Disordered 1.607 16.574 0.005 No
14. I have felt like crying Ordered -0.876 2.116 0.833 Yes
15. I have felt panic or terror Disordered -0.121 3.630 0.604 No
16. I made plans to end my life Disordered -1.141 13.536 0.019 No
17. I have felt overwhelmed by my problems Ordered -2.645 13.646 0.018 No
18. I have had difficulty of getting to sleep or staying asleep Disordered 0.688 8.987 0.110 No
19. I have felt warmth or affection for someone Disordered 4.806 54.235 0.000 No
20. My problems have been impossible to put to one side Ordered 0.299 0.473 0.993 No
21. I have been able to do most things I needed to Disordered 0.904 10.794 0.056 No
22. I have threatened or intimidated another person Disordered 1.357 9.625 0.087 No
23. I have felt despairing or hopeless Disordered -4.333 37.877 0.000 No
24. I have thought it would be better if I were dead Disordered -1.867 20.908 0.001 Yes
25. I have felt criticised by other people Disordered -0.262 3.023 0.696 No
26. I have thought I have no friends Disordered -0.073 5.034 0.412 No
27. I have felt unhappy Ordered -4.101 25.772 0.000 No
28. Unwanted images or memories have been distressing me Disordered -0.440 12.087 0.034 No
29. I have been irritable when with other people Ordered 2.706 13.455 0.019 Yes
30. I have thought I am to blame for my problems & difficulties Ordered 0.847 3.083 0.687 No
31. I have felt optimistic about my future Disordered 3.779 20.251 0.001 No
32. I have achieved the things I wanted to Disordered 0.025 6.792 0.237 No
33. I have felt humiliated or shamed by other people Disordered 1.504 11.613 0.040 No
34. I have hurt myself physically or taken risks with my health Disordered 0.675 3.719 0.591 No
Overall model statistics after threshold re-ordering Total item χ2 = 425.624; p = 0.000
Person-separation index: 0.93
32
Table 4. Results of conventional psychometric tests of CORE-OM
Item SRM Missing data
Spearman’s ρ value
1. I have felt terribly alone and isolated 0.99 0.4% 0.714
2. I have felt tense, anxious or nervous 1.18 0.3% 0.603
3. I have felt I have someone to turn to for support when needed 0.65 0.7% 0.419
4. I have felt ok about myself 1.00 0.6% 0.646
5. I have felt totally lacking in energy and enthusiasm 0.96 0.4% 0.587
6. I have been physically violent to others 0.24 0.5% 0.282
7. I have felt able to cope when things go wrong 0.78 0.6% 0.594
8. I have been troubled by aches, pains, physical problems 0.61 0.7% 0.276
9. I have thought of hurting myself 0.46 0.4% 0.531
10. Talking to people has felt too much for me 0.81 0.7% 0.548
11. Tension/anxiety have prevented me doing important things 0.89 0.8% 0.642
12. I have been happy with the things I’ve done 0.85 0.8% 0.624
13. I have been disturbed by unwanted thoughts and feelings 0.95 0.5% 0.564
14. I have felt like crying 1.19 0.3% 0.630
15. I have felt panic or terror 0.84 0.4% 0.576
16. I made plans to end my life 0.29 1.0% 0.436
17. I have felt overwhelmed by my problems 1.09 1.0% 0.744
18. I have had difficulty of getting to sleep or staying asleep 0.93 0.6% 0.521
19. I have felt warmth or affection for someone 0.33 2.4% 0.299
20. My problems have been impossible to put to one side 1.04 0.9% 0.629
21. I have been able to do most things I needed to 0.69 0.8% 0.568
22. I have threatened or intimidated another person 0.32 1.0% 0.272
23. I have felt despairing or hopeless 1.09 0.8% 0.785
24. I have thought it would be better if I were dead 0.58 0.7% 0.647
25. I have felt criticised by other people 0.70 0.8% 0.558
26. I have thought I have no friends 0.65 0.9% 0.595
27. I have felt unhappy 1.26 0.5% 0.731
28. Unwanted images or memories have been distressing me 0.89 0.6% 0.576
29. I have been irritable when with other people 0.86 0.9% 0.554
30. I have thought I am to blame for my problems & difficulties 0.80 0.5% 0.533
31. I have felt optimistic about my future 0.81 1.0% 0.465
32. I have achieved the things I wanted to 0.86 1.5% 0.590
33. I have felt humiliated or shamed by other people 0.61 1.1% 0.557
34. I have hurt myself physically or taken risks with my health 0.27 0.9% 0.348
33
Table 5. Results of Rasch analysis with the 17 items of CORE-OM fitting into the Rasch model
Item statistics Item Threshold
Residual χ2
P-value DIF
1. I have felt terribly alone and isolated Ordered 1.415 10.118 0.072 No
2. I have felt tense, anxious or nervous Ordered -0.373 2.658 0.752 No
4. I have felt ok about myself Ordered -0.107 2.326 0.802 No
7. I have felt able to cope when things go wrong Ordered 0.371 5.829 0.323 No
10. Talking to people has felt too much for me Ordered 0.546 4.614 0.465 No
11. Tension/anxiety have prevented me doing important things Ordered -0.191 6.021 0.304 No
12. I have been happy with the things I’ve done Ordered 0.708 1.848 0.870 No
13. I have been disturbed by unwanted thoughts and feelings Ordered 2.376 10.195 0.070 No
15. I have felt panic or terror Ordered 0.133 5.590 0.348 No
16. I made plans to end my life Ordered -0.485 4.897 0.428 No
17. I have felt overwhelmed by my problems Ordered -2.084 11.369 0.045 No
20. My problems have been impossible to put to one side Ordered 0.254 1.877 0.866 No
21. I have been able to do most things I needed to Ordered 1.424 3.410 0.637 No
25. I have felt criticised by other people Ordered 0.918 3.362 0.644 No
26. I have thought I have no friends Ordered 0.742 8.993 0.110 No
32. I have achieved the things I wanted to Ordered 0.799 1.426 0.921 No
33. I have felt humiliated or shamed by other people Ordered -0.899 7.809 0.167 No
Overall model statistics Total item χ2 = 92.342; p = 0.275
Person-separation index: 0.898
Note: Residuals > 2.5 or < -2.5 are considered high; p < 0.01 indicates items that do not meet Rasch item fit criteria. All items were shown to fit into the Rasch model.
Table 6. Emotional component of CORE-6D: sub-domains and Rasch statistics
Rasch analysis statistics Item Sub-domain
Residual χ2 P-value
1. I have felt terribly alone and isolated Depression -0.099 2.044 0.843
15. I have felt panic or terror Anxiety -0.058 3.403 0.638
16. I made plans to end my life Risk to self -0.358 5.812 0.325
21. I have been able to do most things I needed to Positive 0.717 6.520 0.259
33. I have felt humiliated or shamed by other people Social relationships 0.156 3.191 0.671
Overall model statistics Total item χ2 = 20.970; p = 0.694
[image:36.595.68.536.531.669.2]Table 7. Health states of the emotional component of CORE-6D as identified by the item threshold map
N = not at all; S = only occasionally or sometimes; O = often, most or all the time; note that item 21 is positively worded and therefore response levels are reversed
Health states Item
1 2 3 4 5 6 7 8 9 10 11
1. I have felt terribly alone and isolated N S S S S O O O O O O
15. I have felt panic or terror N N S S S S O O O O O
33. I have felt humiliated or shamed by other people N N N S S S S O O O O
21. I have been able to do most things I needed to O O O O S S S S S N N
[image:37.595.75.425.298.571.2]16. I made plans to end my life N N N N N N N N S S O
[image:37.595.81.522.641.769.2]Figure 1. Item map of the emotional component of the CORE-6D
Figure 2. Item threshold map of the emotional component of the CORE-6D illustrating the plausible health states obtained by Rasch analysis