Munich Personal RePEc Archive
The Impact of Reducing the
Administrative Costs on the Efficiency in
the Public Sector
Matei, Ani and Savulescu, Carmen
National School of Political Studies and Public Administration
(NSPSPA)
15 February 2009
THE IMPACT OF REDUCING THE ADMINISTRATIVE COSTS ON THE EFFICIENCY IN THE PUBLIC SECTOR
Abstract
The goal of the paper is to evaluate the impact of reducing the administrative costs on the efficiency in the public sector.
Within the general framework provided by the specialised literature, the proposed methodology uses the classical model of a function of production, thus describing the factors of influence of the administrative costs on production and productivity in the public sector.
The theoretical results are empirical exemplified for a local service of public utility.
Adapting the theoretical model to the empirical situation is grounded on statistic methods of analysis and regression. The interpretation of results inscribes in the economic framework specific for public economics. The results aim both the novel model of analysis and the concrete evaluation of the economic impact of reducing the administrative expenditure in the public sector.
At the same time, the general topic of reducing the administrative costs is extended towards the public sector. The most relevant conclusion refers to the capacity of the classical economic models in developing the public sector.
JEL classification: H59, H72
1. Introduction
Efficiency, often found in the economic terminology, may be considered in two meanings: a) performance – very good outcomes – of an activity;
b) maximum effects of an activity related to the allocated or consumed resources.
We find both meanings in the private and public sector. In the above context, the public sector is considered efficient when it provides maximum of public goods and services, within the limit of the available resources1.
The approaches on the public sector related to efficiency are more frequent both in theory and practice. An explanation derives from ongoing situations when both central and local governments take into consideration especially the degree of meeting the citizens’ needs, ignoring or minimising the topic of costs. This situation is not only a matter of attitude, it could be justified stating that efficiency in the public sector should be understood as a consequence of economic factors, as well as of the political, cultural, legal and especially human factors, as „human resources represent the basis for success or failure”2.
Mayer (1957), attempting to substantiate the study on the organisational typology in public administration, expresses his reticence related to introducing efficiency in the public organisations, underlining the indefinite matters assumed by introducing the above concept in the mentioned field, thus referring directly to the relation between the administrative measures and their social effects.
In the middle of 1990s, New Public Management (NPM) provides a new alternative to the public sector management. NPM emphasises the values of efficiency, economy and effectiveness in the public sector, based on the fact that the governmental actions should be result-oriented and not exclusively process-oriented. Efficiency represents the main objective of the administrative reform, as well as responsibility and accountability towards the consumers.
The papers recently published by the European Central Bank (ECB), „Working Paper Series (WPS)” on assessing the efficiency and performance of the public sector3 reveal both indicators of „opportunity” concerning the administrative, education and health related outcomes, quality of public infrastructure, support to rule of law and a level playing field in a market economy, and „Musgrave” indicators, concerning the tasks for government: allocation, distribution and stabilisation. This period is dominated by the economic crisis, imposing also a series of conditional elements concerning the efficiency of the public sector. In this respect, Ul Haque et al (1998) paper, concerning the quality of employees, analyses how the situations generating constraints for the public sector may lead to improving efficiency4.
1
Details on efficiency in public economics may be found in Connolly, S. and Munro, A. (1999), “Economics of the public sector”, Prentice Hall Europe, Chapter 3, pp. 40 – 56 or Matei, A. (2003), “Economie publică. Analiza economică a deciziilor publice”, Ed. Economica, Bucharest, chapter III.3, pp. 110 – 115.
2
Bonnet, Fr (1993), “Management de l’administration”, De Boeck Université, Paris, p. 47.
3
See the papers published by Afonso, A., Schuknecht, L., Tanzi, V., „Public sector efficiency : an international comparison”, ECB, WPS242 or „Public sector efficiency. Evidence for New Member States and Emerging Markets”, ECB, WPS581.
4
Effectiveness represents another concept accumulating several references. While efficiency
represents the ratio between the outcome obtained and the means involved, effectiveness refers to the ratio between the outcome obtained and the objective to be attained5. More pertinent for the public sector or public administration, effectiveness means, on one hand to define previously an objective and on the other hand, to measure (or at least, to estimate) the outcome obtained.
Regarding effectiveness, the authors state that one cannot speak about efficiency without
effectiveness because “it is more important to make well what you planned to make –
effectiveness – than to make well something else – efficiency”6. They also state that the relationship between effectiveness and efficiency is a part/whole relation, effectiveness having a direct impact on efficiency, especially the efficiency of the staff, which is in fact, one of its intrinsic elements.
In order to produce results, that is to be efficient, in the public sector the rules of market competition in providing goods and services should apply, which implies the reorganization of the public organisations according to the principles that operate in the private sector or determining the public organisations to enter into competition with the private ones.
Public management authors state that the effectiveness of the public managers depends on their managing abilities during the management processes while they exercise their functions; the authors also acknowledge that efficiency is a main matrix in the application of management logic in the public sector7, as a ratio between performance and costs8, as a ratio between the outcome obtained and the means involved9, while effectiveness is looked upon as the ratio between the result obtained and the objective that has to be attained10. In the last mentioned paper, it is also stated that the total neglect of efficiency in the public sector has been a source of waste and non-performance.
The values of efficiency and effectiveness are expressed in terms of cost-effectiveness, which synthetically means “how to get more outputs for each dollar spent”11. The cost-effectiveness analysis is also the study object for economic analysis of public decisions, the authors pointing out the fruitful consequences of cost-effectiveness measures when the government’s objective is defined largely enough to allow the comparison of more alternatives for different policies necessary to fulfil this objective12.
In view of our study, we emphasise synthetically the considerations of Rosenbloom and O'Leary (1996) concerning the obstacles described by NPM for efficiency and effectiveness in the public sector, namely:
public organisations dominated by excessive rules regarding the staff, the way of spending public money, working methods;
centralized rules of public procurement, not result-oriented rules;
5
Matei, L., (2001), “Management public”, Editura Economica, Bucharest, pp. 195 – 197.
6
Drucker, P.(2001), „Eficienţa factorului decizional”, Editura Destin, Bucharest, p. 147
7
Matei, L. (2006), Management public”, op. cit., p. 106
8
idem, p. 145
9
idem, p. 194
10
idem, p. 192
11
Rosenbloom, D. H., O'Leary, R. (1996), „Public Administration and Law”, second edition, CRC Press, p. 180
12
the control focused on procedures, and not on responsibility and preventing corruption; in this respect, the values of public administration that forward a strongly hierarchical control are the source of many restrictions of the constitutional rights that the employees of the public sector have as citizens.13
Concerning the public organisations, Bartoli (1997) addresses some questions concerning the pertinence of the objective defined, the means involved in order to attain the outcomes, motivation and actors’ identity, eventual negative effects etc.14
The major problem, when analysing comparatively the efficiency of the public sector and the
efficiency of the private sector is that the objectives of efficiency are fundamentally different in the case of the two sectors. While the private enterprises have a relatively limited objective, which is the maximization of profit, the public enterprises have a large set of objectives consisting in the attempt to maximize the social welfare along with the fulfilment of long term economic objectives.15
Considering this synthetic presentation, we draw the conclusion that the topic on reducing the public expenditure or administrative costs (AC) both in the public and private sector becomes an up-to-date issue in specialised studies and public or private managerial practice.
The terminology and contents of administrative costs are different and depend on the analysed situations and contexts. In various situations, they refer to expenditure for achieving the information obligations. According to the International Standard Cost Model Manual, the administrative burden (AB) refers to „expenditures generated in companies, when they meet the information obligations required by public administration, based on the legislative rules”16.
The extension of this issue towards the public sector will lead to an extension of the sphere of administrative burden to „compliance costs for enterprises, services and citizens, including administrative and bureaucratic (operational) costs as well as capital costs17.
It is worth to remark, from this perspective the occurrence of some networks concerning the application of the Standard Cost Model (SCM), aiming to reduce the administrative expenditures for businesses. Even the European Commission aimed to elaborate and implement a strategy for reducing the administrative costs for the businesses inside the European Union. We find similar initiatives in OECD and several European states as well as other countries, i.e. United Kingdom, Denmark, Netherlands, Sweden, Norway etc.
SCM Network comprises over 19 states and organisations, and recently also Romania. In fact, for Romania, the “Strategy for better regulation at central government level”, 2008 – 2013 comprises as priorities on medium term, „preliminary analysis of the issue of administrative
13
Rosenbloom, David H., O'Leary, R. op. cit., pp.7-8 and p.183
14
Bartoli, A., (1997), “Le management les organisations publiques “, Ed. Dunod, Paris, pp. 80 – 90.
15
See Clifton, J., Fuentes, D. (2003), „Privatisation in the European Union: Public Enterprises and Integration”,
Springer, pp.12-13
16
„International Standard Cost Model Manual; measuring and reducing administrative burdens for business”, SCM Network, Oct., 2005, www.administrative-burdens.com.
17
burden, development of a general methodology to assess the administrative costs and to elaborate a concrete action plan in order to implement the Standard Administrative Cost Model”18.
The concern for reducing the administrative costs gains greater extensions and the solutions are increasingly diversified. Even soon the European Institute of Public Administration (EIPA), Maastricht will organise a seminar with high level experts from public administration, European Commission, and academic environment.
The seminar19 will be oriented to emphasise the best practices for reducing the administrative costs as well as the barriers, obstacles and critical successful factors. Interesting evaluations of the effects of reducing the administrative costs are achieved both in the academic environment (Keyworth (2006), Jackson and Rosenberg (2006), Chen, Lu and Sougiannis (2009), Matei and Dinu (2009)), or in international organizations (Guasch and Hahn (2005), Richard et al. (2006)) etc.
Public expenditure represents „the ensemble of annual expenditure of public nature of a country, financed on the basis of the public budgetary resources”20. In fact, public expenditure reflects the political choices of the Government, representing costs of the elements of economic policy aiming to deliver public goods. These costs relate to delivering goods through the budget of the public sector or represent expenditure in the private sector, induced by regulations and laws made by the public sector.
What we called in the introduction the administrative burden of private companies can be framed in this second category of expenditure. The costs from the first category are in fact public expenditure, as such, of which a part represents the costs of bureaucracy in any public administration. In an extended meaning for the administrative burden, the costs of bureaucracy are in this category for the public sector.
In the structure of the national or local budgets we find:
• Exhaustive public expenditure focused on procurement of goods and services (i.e. labour, consumables) and capital goods (i.e. investments of the public sector in streets, schools, hospitals).
• Transfer public expenditure, such as public expenditure for pensions, subsidies, interests, unemployment allowances.
Consequently, the administrative burden in the public sector comprises, mainly, procurement of goods and support services for bureaucracy as well as payment of some charges etc.
The weight of public expenditure is different and depends on the development levels for the public or private sector. Reported to the latter, the administrative burden in the public sector will have a certain non linear evolution. In this prospect it is worth to mention the models formulated by Musqrave (1974) and Rostow (1960), stating that in the earlier stages of growth and economic development, investments in the public sector are high, providing the core social infrastructure. The purpose of these investments is to help economy to reach higher development stages, and
18
Government of Romania – “Strategy for better regulation at central government level”, 2008 – 2013, pp. 13, www.sgg.gov.ro
19
EIPA, (2009), “Reduction of Administrative Burden. Adapting to the evolution of needs of Citizens and Businesses, Transformational Government”, Maastricht, Netherlands, 7-8 December 2009
20
although the state will continue investments, their role will be to complete the private investments. The conclusions of the two economists are relevant also for the evolution of the administrative burden, both in the public and private sector.
• While total investments increase as proportion from GDP growth, the relative share of the public sector decreases21.
• When economy reaches the maturity stage, the mix of public expenditure will be oriented from expenditure for infrastructure to expenditure for education, health and welfare services 22.
In this context, the general working hypotheses refer to:
• opportunity to extend the topic of reducing the administrative costs towards the public sector;
• possibility to evaluate the economic impact of reducing the administrative costs through the use of economic models, grounded on statistic analyses and evaluations.
• the economic impact of reducing the administrative costs is expressed in the growth of the production of goods and services and consequently in the modification of labour productivity.
The economic models refer to those of the functions of production, benefit analyses or cost-effectiveness analyses as well as the input-output analyses.
To the above general hypotheses we add some specific hypotheses in view to support the idea of extending the topic of reducing the administrative costs towards the public sector.
Therefore, if we take into calculation, the total administrative costs, obtained by summing up those from the public and private sector:
private public
tot AC AC
AC = + (1)
we shall have the following characteristics:
• ACtot can be considered constant, for certain periods of economic development;
• ACpublic and ACprivate are variables in time;
• between ACpublic and ACprivate there is bidirectional transfer due to effects of dislocation between public and private expenditure, specific for different periods of economic and social development.
The above assertions are based on Peacock-Wiseman’s analyses, stating that „Governments have the trend to spend more money and the citizens do not wish to pay more taxes. Consequently, the Governments should take into consideration the wishes of their citizens”23. We add the so called
21
Musqrave, R., A., (1974) „Expenditure Policy for Development”, University of Florida Press, U.S.A., pp. 35.
22
Rostow, W., (1960), “The Stages of Economic Growth : A Non – Communist Manifesto”, Cambridge University Press, U.K., pp. 9 – 10.
23
effect of dislocation, namely the public expenditure dislocates the private expenditure in certain periods, such as crises.
Chapter I Assessing the administrative costs
I.1. General issues
The idea to assess the administrative costs is based on simple judgements, focused on the structure of the public sector, respectively private sector. In the specialised literature, public expenditures are grouped depending on different administrative or economic criteria. An administrative classification of expenditures could be as follows:
• organic, when expenditures are grouped depending on institutions: ministries and other central bodies, administrative – territorial units, other public institutions;
• functional, when expenditures are grouped depending on the profile of the activity of public institutions: public power and general administration, justice and police, international relations, army, culture, education, social actions, economic actions.
Taking into account the economic criterion, the classification is as follows: operational expenditure, transfer expenditure and investment expenditure. In this context, the administrative costs in the public sector will include, mainly, the operational expenditure and will be direct proportional with the number, size and structure of the institutions concerned.
Identified as representing the “administrative burden”, the assessment of the administrative costs in the business environment, consequently in the private sector, takes into consideration another philosophy. The roots of such activity are situated in the Netherlands, when at the beginning of 1990s, the first methods were formalised for assessing and reducing the administrative costs for small and medium sized enterprises. The practical experience and positive results of the Netherlands were undertaken by several European counties and US, Canada or Australia, representing general concerns of each private organisation to reduce bureaucratic expenditure.
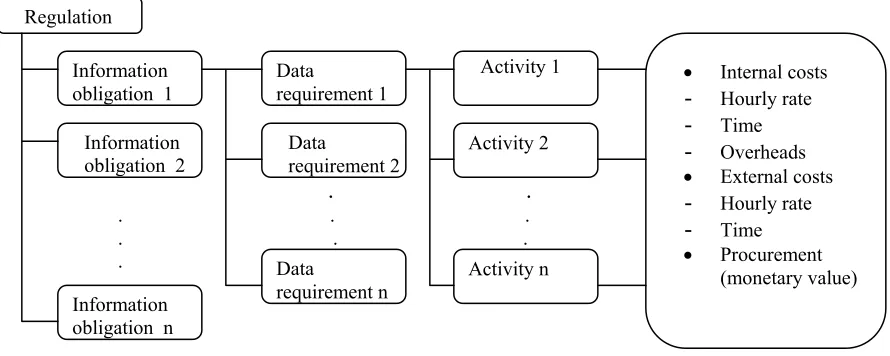
The assessment activity for the administrative costs should start with precise identification of information obligations. „An information obligation (IO) represents the duty to draw up and keep record of certain information and to make them available to public administration or other authorised institutions. It is a compulsory activity for companies. Each information obligation comprises a number of data requirements, and the companies should submit them”24.
The assessment of the costs for administrative activities imposed by I.O. respect the following scheme, which represents in fact the structure of the standard cost model.
24
. .
. . . . . . . .
Regulation
Information obligation 1
Information obligation n
Information obligation 2
• Internal costs
- Hourly rate
- Time
- Overheads
• External costs
- Hourly rate
- Time
• Procurement (monetary value) Activity n
Activity 2 Activity 1 Data
requirement 1
Data
requirement 2
Data
[image:9.612.84.529.123.301.2]requirement n
Fig. 1. Structure of the Standard Cost Model (SCM) 25
Combining the components above described, we obtain the core formula for SCM: AC26 = Price x Time x Quantity (population x frequency) (2)
where:
Price: price consists of a tariff, wage costs plus overheads for administrative activities carried out internally or hourly cost for external service providers;
Time: the amount of time required to complete the administrative activity;
Quantity: comprises the size of the population, businesses affected and the frequency of the activity which should be achieved yearly.
I. 2 Standard costs
SCM has its origins in the United States and it was called “the system of estimative costs”. The essence of the method consists in making a comparison between the standard cost and the effective cost, establishing the deviations from the standard cost.
In an economic approach, the standard costs are the ante-calculated costs on rigorous scientific grounds, for a certain structure of the organisations, use of technological methods and procedures in the production process, service and public goods delivery. The rigorous establishment of standard costs determines them to be considered “real costs”; any modification that occurs during the production process is considered a deviation and is therefore ascribed to the final outcomes of the enterprise.
25
Idem, p. 9
26
SCM application implies the following stages:
1) The calculation of the standard cost for product, service or public good. This stage consists in:
determining the standard volume of the activity and sizing the standard costs;
determining standards for indirect costs, respectively indirect production costs (overheads of departments), general administration costs (general overheads) and the distribution costs (sales);
the actual establishment of standard costs on cost holder;
2) The account of deviations. Registration, calculation, supervision and analysis of the deviations from the standard costs are made according to the types of costs, namely the deviations from the standard costs of materials, human resources and overheads. The account of deviations implies:
making a comparison between the effective costs and the standard costs and establishing the deviations;
evaluating the amount of deviations and their causes;
taking measures to avoid negative situations and generalizing the positive aspects.
3. The organization of standard cost accounting. Three main alternatives of accounting can be applied:
the partial cost standard method;
the single cost standard method;
the double cost standard method.
SCM main advantages are as follows:
by supervising the deviations from the standard costs, solutions can be found which regulate the activity of the organization, with positive impact on its profit, respectively the citizens’ satisfaction as beneficiaries of the public goods or services;
the method obliges the management of the public or private organisations to choose those methods which guide its future activity towards attaining basic and ideal standards.
I. 3 Efficiency of the European regulations through reducing the costs
Besides political and administrative reasons, the economic and budgetary reasons represent the basis for enhancing efficiency of the EU regulations. Regulations involve a cost and, in the debates regarding the quality of regulation, the cost is crucial.
European Commission that are not accompanied by an independent controlled impact evaluation that should include the evaluation of any useless administrative obstacles by means of SCM.
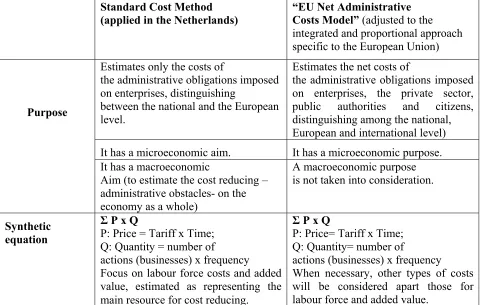
According to the European Commission, the efforts of the European Union in light of reducing administrative costs in the legislative system, demonstrate the SCM adjustment to the EU administrative system, identified by the Commission as the “EU Net Administrative Cost Model”, synthetically expressed in Table 1.
Standard Cost Method (applied in the Netherlands)
“EU Net Administrative Costs Model” (adjusted to the integrated and proportional approach specific to the European Union)
Purpose
Estimates only the costs of
the administrative obligations imposed on enterprises, distinguishing
between the national and the European level.
Estimates the net costs of
the administrative obligations imposed on enterprises, the private sector, public authorities and citizens, distinguishing among the national,
European and international level)
It has a microeconomic aim. It has a microeconomic purpose.
It has a macroeconomic
Aim (to estimate the cost reducing – administrative obstacles- on the economy as a whole)
A macroeconomic purpose is not taken into consideration.
Synthetic equation
Σ P x Q
P: Price = Tariff x Time; Q: Quantity = number of
actions (businesses) x frequency Focus on labour force costs and added value, estimated as representing the
main resource for cost reducing.
Σ P x Q
P: Price= Tariff x Time; Q: Quantity= number of
actions (businesses) x frequency
[image:11.612.66.550.188.493.2]When necessary, other types of costs will be considered apart those for labour force and added value.
Table 1. Adapting SCM for the EU Member States27
All the above actions aim to reduce bureaucracy and administrative expenditures for authorising the companies’ activity, improving the transparency and simplifying the administrative procedures, enhancing the relation of administration with the companies.
I.4 Romania and reducing the administrative costs
Since January 2008, Romania, through the General Secretariat of the Government belongs to the network of the users of standard expenditure instrument. The governmental strategy has a chapter dedicated to reducing bureaucracy. In this chapter the focus is on the financial aspect and
27
simplification of legislation. The Government established the percentage to reduce the bureaucratic expenditures. At EU level, this percentage represents 25%. For Romania, the objective is to have a competitive percentage. The initiatives to reduce the administrative costs of enterprises were focused on the SMEs sector, for the beginning.
In 2006, it was achieved the inventory for authorisations, certificates, licences and permits for the activity of companies, finding out that 34 public institutions have competences in their issuance. We find a total number of 534 authorisations, certificates, licences, permits and there are authorisations under the responsibility of several public institutions.
The real number of authorisations, certificates, licences and permits is 488; the difference between the total number and the real number results from the existence of double competences for issuance.
The legal duration to issue authorisations, certificates, licences and permits is between 5 working days and 90 days, only 21.3% from the authorisations (only 104) apply for the procedure of tacit approval.
Chapter II. The efficiency of public administration and services in the context of reducing the administrative costs
II.1 The impact of reducing the administrative costs on the efficiency of public services
The following example28 that we shall describe is based on a classical approach, for the production process in an enterprise, using the Cobb-Douglas production function.
β α
L K A
Y= where: (3)
Y – output resulted from the production process;
K –fix capital of the enterprise used in the production process;
L – labour force involved in the production process;
A, α, β are constants with economic significance, namely:
A – coefficient of dimension, α - elasticity of production related to capital, and
β - elasticity of production related to labour force.
From (3), we define a series of performance indicators, i.e. the average productivity (average output) as well as the marginal productivity (marginal output). On its turn, the average productivity can be determined depending on capital (RK) or labour force (RL) as follows:
β α
L K A
RK = −1 , respectively, (4)
1
−
=AKα Lβ
RL (5)
We opted for the indicator concerning productivity on the ground of two reasons:
productivity, precisely its growth represents the necessary way forward to be approached during crisis;
productivity is determined by production/service (effectiveness) in the light of the effort invested in order to attain the outcome (efficiency).
28
At the same time, we should take into consideration the fact that, for public services, the economic efficiency refers to the economic results of the public organisations. The social
efficiency is closer to the objective proposed. It refers to the outcomes of the service activities from the consumers’ point of view, expressed through the degree of meeting the needs or the qualitative level of the services. The qualitative level of services may be expressed by means of models, such as L.S.Simon’s 29 model or indicators concerning the weight of the service providers related to the number of inhabitants etc.
II.1.1. The formal model
The model describing the influence of reducing the administrative costs on the economic
efficiency is based on the following important hypotheses:
• in the public or private organisation there is a policy for reducing the administrative costs, determined both by internal and external measures;
• the administrative costs are within a relation of proportionality both with the total capital, Kt, and total labour force, Lt.
In a simplified expression, this second hypothesis is translated through existence of positive, sub unitary constants λ, μ , so that the administrative cost AC is as follows:
t
t L
K
AC=λ +μ (6)
• in the situation of reducing the administrative costs, the financing flows are used exclusively in production, assuming that they will determine its increase.
Consequently, in the absence of other influences, we shall have:
t
t K K
K = +λ (7)
t
t L L
L = +μ
Solving (7) and introducing in (3) we obtain:
(
λ) (
α μ)
β AKtα LβtY
= − − 1
1 (8)
If we write:
(9)
(
−λ) (
α −μ)
β=Y / 1 1
Yt
Ytwill have the significance of a total production that will be obtained using the whole capital and labour force.
The expression: k=
(
1−λ) (
α 1−μ)
β (10) will be defined as a factor of influence of the administrative costs on production.• In the case of a policy for reducing the administrative costs spread out on several years, n, we obtain a succession of effects overlapped, due to annually factors of influence,
k1, k2, ..., kn and consequently:
i n i
t Y k
Y
1 /
=
Π
= , where: (11)
29
(
λ) (
α μ βi i
i
k = 1− 1−
)
(12)represents the factor of influence of the administrative costs on production in the year i.
Through a similar judgement, we obtain factors of influence on average productivity depending on capital, kK, or depending on labour, kL,:
(
−λ) (
α −μ)
β= −
1
1 1
K
k , respectively, (13)
(
) (
)
11
1− − −
= λ α μ β L
k (14)
From (10), (13) and (14), it results easily:
(
1)
(
1)
][ 2 1
L
K k
k
k= −λ + −μ (15)
II.1.2. An empiric example
In order to provide an example on the above mentioned issues, we turned into consideration the autonomous regies R.A. „Apa”, Braila, Romania, (R.A. „Water”), whose general objective is to develop the system of water and sewerage at local level through modernisation and its enlargement towards peripheral areas of Braila Municipality.
The statistic quarterly data for 2000 - 200830are presented in Appendix 1.
The determination of constants for the production function (3) imposes, firstly its logarithmic process. Consequently we obtain31:
L K
A
Y lg lg lg
lg = +α +β (16)
Appendix 2 presents the logarithmic values that will be used in (16).
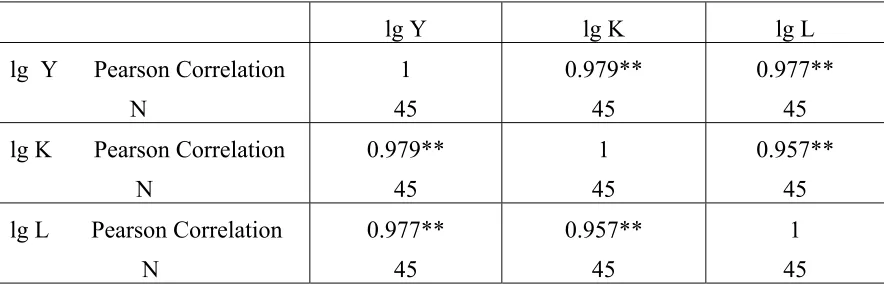
The results of a statistic correlation analysis demonstrates, as resulted from Table 1, significant positive powerful correlations of the variables from (16), supporting the validity of the empirical data and their compatibility with the model.
30
Data undertaken from the Bulletins of the National Statistics Institute, 2000 – 2008, as well as from financial reports transmitted by R.A. „Apa” to local authorities.
31
lg Y lg K lg L
lg Y Pearson Correlation
N 1 45 0.979** 45 0.977** 45
lg K Pearson Correlation
N 0.979** 45 1 45 0.957** 45
lg L Pearson Correlation
N 0.977** 45 0.957** 45 1 45
[image:15.612.66.508.84.226.2]** Correlation is significant at the 0.01 level (2 – tailed)
Table 2 Double varied correlations of the logarithmic variables of Cobb-Douglas function
In order to determine the constants from (16), we use the regression analysis, obtaining:
lg Y = 0.179 + 0.531 lg K + 0.448 lg L (17)
From (16) and (17) it results: A = 1.511, α = 0.531, β = 0.448, which transforms (17) into (17’):
511 . 1
=
Y K L (17’)
531 . 0 448 . 0
Formulating a hypothetic situation for reducing the administrative costs at the level λ = 5% and
μ= 10% we obtain, using (10) the value of the factor of influence on production:
= 0.9283 k (18)
Consequently the limitation of the administrative costs at the above described level will involve an increase of production by 1/k = 1.077 namely 7.7%.
Calculating the average productivity depending on capital or labour force, we shall discover that the reduction of administrative costs does not lead necessarily, at least for the present example to its increase.
In fact, using (13), respectively (14) we get:
0315 , 1 , 9771 , 0 = = L K k k (19)
leading to a growth of the average productivity depending on capital by 2.34% and a reduction by 3.05% of average productivity depending on labour force.
Thus, by processing the data from Appendix 1 and 2, taking into consideration the above model, we find:
ΔY = 0.738 AC0.985 (20)
as well as:
lg ΔY = 5.122 + 15.213 ΔRK – 4.174 ΔRL (21)
lg AC = 5.784 – 6.109 ΔRK – 2.202 ΔRL (22) Consequently, we discover a non-linear relation between the growth of production further the injection of the financial flows deriving from limited administrative costs. For the empirical example, the influences of labour productivity are different related to the growth of production or the administrative costs.
Conclusions
The model taken into consideration confirms the reason of the working hypotheses, presented in introduction. The enlargement of the topic of reducing the administrative costs towards the public sector is justified through close connections between the public and private sector, also demonstrated by the actual developments of New Public Management. The topic of reducing the administrative costs is not specific only for the private sector, but, as confirmed by the recent documents of the European Commission, is found as effect of the legislative harmonization or transposition of EC legislation and acquis communautaire in the practice and jurisprudence of the Member States. And this fact represents only an example.
The novelty of the results derive from the economic model proposed for assessing the impact of reducing the administrative costs on the efficiency in the public sector. The theoretical construction presented, confirms also the direct link between the level of production and the level of the administrative costs as well as the influence of the efficiency of using the capital and labour force. When speaking about reducing the administrative costs, we associate to this process the reinvestment of the amounts made available in the production process. This assumption becomes essential in model building.
Referring to the empirical model, the proposed limitations for the administrative costs and their proportionality with the capital expenses, respectively labour force are extracted from the reality found in several organisations providing public services. Thus the average level of the administrative costs amounts 7 – 8% from the capital value, respectively 15 – 23% from the expenses for labour force.
The impact on production is significant, amounting 7.7% in our example. Therefore, a quick overview reveals non-linearity of the ratios between the growth of production and reduction of the administrative costs, transposed in relation (20) in our paper.
Those evolutions, revealing the growth by 2.34% of productivity related to capital and reduction by 3.05% of productivity related to labour force, demonstrate, in our opinion, the following issues:
• a limit of the proposed model that could lead to the need to determine intervals for the variation of the coefficients λ and μ in order to ensure a simultaneous growth of productivity. For the quantitative modelling, it imposes simultaneous sub unitary conditions for relations (10), (13) and (14). An easier case would be the one supposing that λ = μ, but it is deviated from the empirical reality;
• need of restructuring the production process further the policy of reducing the administrative costs. Our example reveals the fact that restructuring refers even to the labour force, for which the expenses should increase in a larger proportion than the capital expenses. We refer herewith at the financial resources, reallocated due to reducing the administrative costs.
A novel conclusion derives from the analysis of the equations (21) and (22), showing a differentiated behaviour of the influence of the variation of productivity related to the growth of production; respectively to the volume of the administrative costs.
The significant conclusion is for the growth of productivity related to capital which will determine an increase of production and decrease of the administrative costs.
References
“Administrative Costs: The Effort to Identify, Measure and Reduce Them – The 2007 Federal Government Report on the Use of the Standard Cost Model”, The Federal Government, www.Bundesregierug.de;
Afonso, A., Schuknecht, L., Tanzi, V., (2003), „Public sector efficiency: an international comparison”, ECB, WPS242;
Afonso, A., Schuknecht, L., Tanzi, V., (2006), „Public sector efficiency: Evidence for New EU Member States and Emerging Markets”, ECB WPS581;
Androniceanu, A., (2000), „Management public international”, Editura Economică, Bucharest, Romania;
Allen, R., Tommasi, D. (eds), (2001), „Managing Public Expenditures: A Reference Book for Transition Countries”, OECD;
Bartoli, A., (1997), „Le management dans les organisation publiques”, Ed. Dunod, Paris;
Bonnet, Fr., (1993), „Management de l’administration”, De Boeck Universite, Paris, France;
Drucker. P., (2001), „Eficienţa factorului decizional”, Editura Destin, Bucharest, Romania;
Chen, C., X., Lu, H., Sougiannis, Th., (2009), “Managerial Empire Building, Corporate Governance, and the Asymmetrical Behavior of Selling, General, and Administrative Costs”, AAA 2009 Management Accounting Section (MAS), Meeting Paper, Available at SSRN: http://ssrn.com/abstract=1209162;
Clifton, J., Fuentes, D., (2003), „Privatisation in the European Union: Public enterprises and Integration”, Springer;
Connolly, S., Munro, A., (1999), „Economics of the public sector”, Prentice Hall Europe;
Cowper, J., Samuels, M., (2001), „Analiza comparativă a performanţelor în sectorul public: experienţa Regatului Unit al Mării Britanii”, in Matei, A. (coordinator of translation), „Analiza comparativă, evaluare şi management strategic în sectorul public”, Editura Economică, Bucharest, Romania;
Dobrotă, N., (coord.), (1999), „Dicţionar de economie”, Editura Economică, Bucharest, Romania;
D’Souza, J., (2004), „Public Administration and the Public Management: A Case of Study Reform in the United Kingdom”, in „Public Administration and Management: An Interactive Journal”, 9(2);
„Good Practice Guidelines for the Management of the Evaluation Function”, http://europa.eu.int/comm/dg19/evaluation/eu/goodpracticieen.htm;
Guasch, J. L., Hahn, R., W., (2005), “The Costs and Benefits of Regulation: Implications for Developing Countries”, World Bank Policy Research Working Paper, no. 1773;
Iovănaş, I., (1979), „Dreptul administrativ şi elemente ale ştiinţei administraţiei”, Editura Didacticăşi Pedagogică, Bucharest, Romania;
„International benchmark EC Directives; Germany, Denmark and the Netherlands”, 2006;
Jackson, R., J., Rosenberg, D., (2006), “A New Method of Random Sampling to Reduce the Cost of Regulatory Monitoring”, Harvard Law and Economic Discussion Paper No. 562, Available at SSRN: http://ssrn.com/abstract=943038.
Keyworth, T., (2006), “Measuring and Managing the Costs of Red Tape: A Review of Recent Policy Developments”, Oxford Review of Economic Policy, Vol. 22, Issue 2, pp. 260 – 273;
Matei, A., (2002), (coordinator of translation), „Analiză comparativă, evaluare şi management strategic în sectorul public”, Editura Economică, Bucharest, Romania;
Matei, A., (2003), „Economie publică. Analiza economică a deciziilor publice”, Ed. Economică, Bucharest, Romania;
Matei, A., (2007),"Empirical Approaches About the Input-Output Model for the Local Economic Development: Case Study in Braila Municipality", International Journal of Public Administration in Central and Eastern Europe, No. 1, pp 38-49, Available at SSRN: http://ssrn.com/abstract=1317609
Matei, A., (2008), „Performance of Public Expenditure Management at Local Governance Level in Romania”, Transylvanian Review of Administrative Sciences, No. 23E/June/pp. 59 – 73;
Matei, A., Dinu, T., (2009), “Improvement of Government Financing through Non-Conventional Methods: Reducing the Administrative Costs in the Public Sector”, Fifth TransAtlantic Dialogue. The Future of Governance in Europe and the US, Washington, D.C., June, 11 - 13, Available at SSRN: http:// ssrn.com/abstract=1421133;
Matei, A., Matei, L., (2007), „Systemic Models of Local Development”, Theoretical and Applied Economics, No. 1(506), pp. 11-24, Available at SSRN: http:// ssrn.com/abstract=1311811;
Matei, L., (2001), „Management public”, Editura Economică, Bucharest, Romania;
Mayer, P., (1957), „Administrative organization. A comparative Study of the Organization of Public Administration”, Stevens&Sons Ltd. London, U.K.;
„Measuring Administrative Costs: UK Standard Cost Model Manual, 2005, Better Regulation Executive”, Cabinet Office, www.cabinet-office.x.gsi.gov.uk;
„Méthodologie commune de l’Union Européene pour l’estimation des coûtes administratifs imposés par la legislation – Manuel operationel”, (2004), http://www.europa.eu.int/comm/secretariat-general/impact/docs_en.htm
Musqrave, R., A., (1974), „Expenditure Policy for Development”, University of Florida Press, USA;
Payne, J., E., Ewing, B., T., Mohammadi, H., (2006), „Wagner’s hypothesis: new evidence from the US using the bounds testing approach” in Ott, F., A., Cebula, R., J., (2006), „Empirical Public Economics”, Edgar Elgar Publishing Company, pp. 30 – 40;
Rosenbloom, D., H., O’Leary, R., (1996), „Public Administration and Law”, second edition, CRC. Press;
Rostow, W., W., (1960), „The Stages of Economic Growth: A Non – Communist Manifesto”, Cambridge University Press, U.K.
Seerden, R., Stroink, F., (2002), „Administrative Law of European Union, its Member States and The United States – a comparative analysis”, Ed. Intersentia;
Simon, L. S., (1965), „Measuring the Market Impact of Technical Services”, Journal of Marketing Research, Feb., pp. 32 - 39
Staff Working Paper, Annex to the 2005 Communication on “Better Regulation for Growth and Jobs in the European Union, Minimizing Administrative Costs Imposed by Legislations, Detailed Outline of a Possible EU Net Administrative Costs Model – SEC (2005) 175”, European Commission, (2005);
Government of Romania, (2008) “Strategy for better regulation at central government level”,
2008-2013, http://www.sgg.ro;
Ul Haque, N., Montiel, P. J., Sheppard, St., c., (1998), „Public Sector Efficiency and Fiscal Austerity”, IMF Working Paper No 98/56;
Appendix 1 Empirical data concerning the variables of Cobb-Douglas production function
Year Quarter Production (Y)
[lei]
Capital (K)
[lei]
Wage expenses (L)
[lei]
I 2,627, 221 6,791, 052 1,060, 729 II 3,002, 539 5,578, 364 1,157, 159 III 3,502, 961 5,093, 289 1,253, 589 IV 3,377, 857 6,791, 055 1,350, 022 2000
Total 12,510,578 24,253, 760 4,821, 499
I 2,514, 648 5,009, 156 1,191, 781 II 2,971, 856 4,174, 296 1,418, 787 III 3,200, 461 3,988, 772 1,475, 539 IV 2,743, 254 5,380, 206 1,589, 044 2001
Total 11,430, 219 18,552, 430 5,675, 151
I 3,060, 248 5,134, 438 1,126, 901 II 3,122, 702 5,339, 815 1,229, 346 III 3,372, 518 5,412, 751 1,231, 364 IV 2,935, 442 4,650, 748 1,534, 666 2002
Total 12,490, 910 20,537, 752 5,122, 277
I 3,455, 260 5,500, 753 1,486, 987 II 3,593, 470 6,000, 822 1,517, 333 III 3,404, 740 6,500, 731 1,638, 720 IV 3,367, 570 7,001, 120 1,426, 295 2003
Total 13,821, 040 25,003, 426 6,069, 335
I 3,854, 825 6,420, 961 1,505, 072 II 3,933, 495 6,677 ,803 1,641, 897 III 4,248, 147 6,776, 979 1,778, 722 IV 3,697, 514 5,808, 103 1,915, 548 2004
Total 15,733, 981 25,683, 846 6,841, 239
I 4,711, 802 6,900, 794 1,914, 231 II 4,899, 756 7,528, 336 1,953, 839 III 4,988, 657 8,155, 769 2,109, 660 IV 4,155, 620 8,783, 168 1,835, 826 2005
Total 18,755, 835 31,368, 067 7,813, 556
I 5,540, 381 9,635, 849 1,962, 557 II 5,653, 541 9 719, 579 2,114, 818 III 6,015, 276 9,957, 719 2,439, 602 IV 5,404, 604 8,832, 845 2,404 641 2006
Total 22,613, 802 38,145, 992 8,921, 618
I 6,242, 098 8,359, 439 2,812, 296 II 6,437, 208 9,767, 902 2,869, 663 III 6,734, 082 10,981, 231 2,899, 236 IV 5,485, 851 11, 588, 470 2,897, 458 2007
Total 24,899, 239 40 697, 042 11,478, 653
I 6,344, 326 10,499, 398 3,312 ,739 II 6,743, 208 10,417, 927 3,613 ,789 III 6,199, 607 11,157, 124 3,915 ,505 IV 6,608, 067 10,782, 667 4,215 ,873 2008
Total 25,895, 208 42,857, 116 15,057, 906
Appendix 2 Logarithmic empirical data of Cobb-Douglas production function
Year Quarter lg Y lg K lg L
I 6.41 946 6.83 193 6.02 531 II 6.47 727 6.74 648 6.06 333 III 6.54 432 6.70 697 6.09 447 IV 6.52 853 6.83 193 6.13 033 2000
Total 7.09 726 7.38 741 6.68 314
I 6.39 037 6.69 975 6.07 591 II 6.47 290 6.62 055 6.14 860 III 6.50 515 6.59 966 6.16 879 IV 6.43 823 6.73 078 6.19 112 2001
Total 7.05 805 7.26 834 6.75 412
I 6.48 572 6.71 046 6.04 269 II 6.49 443 6.72 746 6.08 955 III 6.52 789 6.73 336 6.08 991 IV 6.46 761 6.66 745 6.18 583 2002
Total 7.09 656 7.31 281 6.70 944
I 6.53 845 6.74 036 6. 17 202 II 6.55 546 6.77 815 6.17 355 III 6.53 199 6.81 291 6.21 431 IV 6.52 724 6.84 516 6.15 412 2003
Total 7.13 735 7.39 794 6.78 312
I 6.58 591 6.80 754 6.17 754 II 6.59 472 6.82 458 6.21 511 III 6.62 818 6.83 097 6.24 993 IV 6.56 785 6.76 403 6.28 217 2004
Total 7.19 673 7.40 960 6.83 512
I 6.67 311 6.83 885 6.28 194 II 6.68 922 6.87 668 6.29 070 III 6.69 793 6.91 142 6.32 408 IV 6.61 857 6.94 364 6.26 364 2005
Total 7.27 508 7.49 638 6.89 282
I 6.74 351 6.98 385 6.29 270 II 6.75 228 6.98 762 6.32 510 III 6.77 924 6.99 813 6.38 721 IV 6.73 272 6.94 606 6.38 093 2006
Total 7.35 430 7.58 040 6.95 041
I 6.79 532 6.92 215 6.44 902 II 6.80 868 6.98 976 6.45 773 III 6.82 827 7.04 060 6.46 225 IV 6.73 918 7.06 371 6.46 195 2007
Total 7.39 602 7.60 949 7.05 956
I 6.80 236 7.02 078 6.52 009 II 6.82 885 7.01 745 6.55 787 III 6.79 232 7.04 727 6.59 273 IV 6.82 007 7.03 262 6.62 480 2008
Total 7.41 313 7.63 195 7.17 754