© 2018, IRJET | Impact Factor value: 6.171 | ISO 9001:2008 Certified Journal | Page 332
Review on Assessment of Mode Shift Behavior due to Introduction of
New Mass Transit System
Sourabh C. Ladhi
1, Sujesh D. Ghodmare
2, Bharati B. Sayankar
31M.Tech Scholar, Department of Civil Engineering, GHRCE, Nagpur, India 2Assistant Professor, Department of Civil Engineering, GHRCE, Nagpur, India 3Assistant Professor, Department of Electronics Engineering, GHRCE, Nagpur, India
---***---Abstract -
The Metropolitan cities in developing nationsare attempting execution of rail transit system, particularly metro, as reply to problems of swiftly increasing travel demand and traffic congestion, considering the target of sustainable development. Traffic congestion is mainly caused due to constantly increasing private vehicles, which in turn had primarily attributed for low level of service on roads. The paper presents various survey methods adopted to assess commuters demographic, socio-economic and travel characteristics. Survey is helpful in evaluating travel behavior in a hypothetical travel environment and to study current travel behavior. Various models developed for analysis of survey data are also investigated. The scenario of old transit modes is compared with scenario of new transit modes. The mode shifting behavior & modal split when any new transit mode is added in present transit modes is examined. Methodology to evaluate mode choice probability is discussed in detail.
Key Words: Stated Preference, Revealed Preference, Mode
Choice Behavior, Choice Probability, Mode Shift.
1. INTRODUCTION
As size of cities expand, the vehicle trips on roads increase substantially. This necessitates adopting strategy to debilitate private transit modes and support Public Transportation System (PTS) once the traffic volume level along any transit corridor in one way surpasses 8000 people for every hour. The execution of a rail Mass Rapid Transit System (MRTS) or Bus Rapid Transit System (BRTS) becomes essential. In developed countries, making arrangements for MRTS starts when population of city surpasses 1 million, the MRTS is implemented when population is 2-3 million & when population surpasses 4 million planned expansions to the MRTS are quickly taken up. After introduction of MRTS, however, an analysis as to whether the system has been triumphant in deviating the people apart from private transit modes and onto the new MRTS mode is of great importance. Hence the success of project is evaluated by the assumptions that are considered during the modal shift evaluation process. A mode choice study refers to the assessment of travel behavior considering socio-economic efficiency and environmental impact. Mode choice behavior of commuters is a basic part in transportation planning. Travelers have an option to choose a mode out of many available modes for particular reasons. Many elements are
responsible for mode choice determination. A proper investigation of mode choice behavior can aid in coping the issues like forecasting demand for new travel modes, reducing traffic congestion, resources allocation and travel efficiency evaluation. Mode choice investigation is method of coming at a conclusion about the mode utilized by the travelers in a particular set of situations. A traveller having a mode choice gives separate weights of utility to the attributes of other modes when compared with own mode. From the summation of weights, a commuter decides suitable travel mode. Feasibility of MRTS is evaluated considering factors like alternative modes option, strategically planed blueprints, different design and location for financial feasibility, social and environmental factors. MRTS provides vast benefits like lowering air pollution levels, travel time saving, accident reduction, traffic congestion reduction and fuel saving.
2. LITERATURE REVIEW
Vineet Chauhan et .al (2016) studied commuters mode choice pattern for Delhi PTS & found out causes for shift of travellers into metro transit system from buses and private motor vehicles (PMV). In order to predict if existing metro commuters have switched from PMV or buses and to estimate mode usage of metro users before metro service start, binomial logistic regression model was developed. The cannibalization effect i.e. shift of travellers within same category of travel modes like public transport, considering shift from buses to metro was studied.
Yuanqing Wang et. al. (2013) evaluated mode shifting behavior due to commencement of metro system in Xian city in China. Stated Preference (SP) survey was performed along metro corridor before starting of metro. The SP model was compared with Revealed Preference (RP) survey conducted after starting of metro. For work and non-work trips logistic regression model was developed. The inadequacy of modal joint and incorporation relative to different cities cause decrease in shift of travellers to metro by 8 to 19%. These outputs are helpful for developing cities which lack modal joint and incorporation.
© 2018, IRJET | Impact Factor value: 6.171 | ISO 9001:2008 Certified Journal | Page 333 surveys. The RP survey was performed on commuters
commuting on newly functional east-west metro corridor, while SP survey was performed on commuters residing across the corridor of proposed additional metro. Sequential estimation method was adopted to estimate econometric mode choice model from combined RP & SP dataset.
R. Ashalatha et. al. (2013) assessed mode choice behavior of traveller influences the general travel productivity in city. The multinomial logistic regression was used to assess commuter’s mode choice behavior in urban area of Thiruvananthapuram. The investigation disclosed that as age grows commuter’s favor to car grows while favor to two-wheelers lowers compared to PTS. As cost per distance & travel time increases, commuters switch to two-wheelers and cars from PTS.
Yuanqing Wang et. al. (2013) researched that commuters demographic, socioeconomic and trip related attributes were essential in influencing modal shift to BRTS in China. Binary logistic analysis technique was utilized for assessing modal shift impacts from private vehicles, normal buses & non-motorized vehicles due to BRTS deployments employing SP survey data gathered from six BRTS corridors. Probability of modal shift to BRTS was found out.
Ling Ding et. al. (2013) studied the consequence of multiple transit priority strategy on modal shift of car commuters in China. Comparison of effects of multi strategy and single strategy on modal shift was done. SP & RP data sets were utilized to develop logit model. The increment in parking fees and Managed Bus Lanes (MBL) had substantial effect on the modal shift of car commuters. Discount in travel fare was unable to push car commuters shifting to MRTS. Estimated modal split from RP & SP data was found much higher in comparison to actual modal split, which indicated that SP data may overestimate actual choice of commuters.
3. DATA COLLECTION
For forecast of travel characteristics in hypothetical travel scenario SP survey is used while for present travel scenario RP survey is used. In these surveys questionnaire forms are prepared to collect data regarding socio-economic & travel characteristics of commuters. Data collection done by conducting field questionnaire survey or internet questionnaire survey. Before conducting survey sample size is calculated. In this column various data collection techniques used by various researchers for their respective projects are explained. Along with this various sampling techniques and categorical and quantitative variables calibration techniques are explained in detail.
[1]RP survey of metro commuters was conducted at various metro lines. For survey following Delhi Metro stations Chandni Chowk, Hauz Khas, Kashmere Gate,
Rajeev Chowk, Central Secretariat and New Delhi were considered. Survey questionnaire included questions regarding profile data like income, age, occupation, gender & vehicle ownership of metro commuters & their travel mode before metro usage. Questionnaire also included questions corresponding to causes for shifting to metro. Sample size was taken as 500 respondents.
[2]SP survey was conducted at passenger stations, rail stations, sport centers, government centers and commercial and market places along metro corridor within 2 km scope before its implementation. After opening of metro line additional RP survey was conducted. The SP and RP models were compared. Sample size for SP survey was 3826 respondents (883 field + 2943 online) and for RP survey was 437 respondents. The SP survey was conducted by two methods, field questionnaire and internet questionnaire. The questionnaire survey collected information about traveler’s socio-economic attributes (occupation, income, gender, trip purpose, spatial group and vehicle available) for different modes. Data regarding commuter’s mode shift behavior to metro under different scenario with separate out-of-vehicle times, in-vehicle travel times and travel expense was also collected. The survey produced five different probabilities (0.95, 0.75, 0.5, 0.25 and 0.05) for preferring metro rail.
[3]The RP survey with sample size of 153 respondents was performed on commuters of Mumbai Metro line I which started in year 2014.
The survey contained three segments
1) ‘Socio-Economic Background’
2) ‘Details of Travel to Work by Old Mode’ 3) ‘Details of Travel to Work by Metro’
The analysis was done for binary choice among two options ‘before metro’ and ‘after metro’ with preference to ‘after metro’ option.
SP survey with sample size of 169 respondents was conducted on commuters on Jogeshwari - Vikhroli Link Road, proposed metro line.
The survey contained three segments
1) ‘Socio-Economic Background’
2) ‘Details of Normal Mode of Travel to Work’ 3) ‘Stated Preference Experiment’
[4]RP survey was done on commuters to get following information.
1) Mode choice of each commuter.
© 2018, IRJET | Impact Factor value: 6.171 | ISO 9001:2008 Certified Journal | Page 334 The interview was done on employees of government and
private offices & education institutes in city. Commuter’s satisfaction levels for their current mode, their wish to switch to other mode and their reasons for that were evaluated from survey. The information regarding performance oriented ranking of city bus service was gathered.
It was considered that city population is distributed normally and sample size was determined from following empirical formulas.
where n0 = sample size for infinite population, Z = statistical parameter corresponding to confidence level
(Z is 1.96 for 95% confidence interval), e = desired error margin (adopted as 5%), p = hypothesized true proportion for population (adopted as 0.5 to account for the worst case) and
[ ( )]
where n = sample size for finite population, N = population size.
From above equations minimum sample size determined was 385, but 739 samples in total were collected. The data represented every section of society (high income to low income), every age group (21 to 60) and equal distribution of both genders. The SPSS software was used to analyze data.
[5]Six BRTS corridors were considered for this SP survey. The SP survey questionnaires were bifurcated into four groups: commuters socio-economic and transit characteristics, quality of ride, mode shifts to BRTS and frequency of travel. The survey was organized at bus stops, transfer hubs and subway stations for BRTS, normal bus and subway commuters. The survey was organized at parking places and roadsides for non-motorized and automobile users. A total of 2,647 commuters from six different study area participated in survey. The survey was focused on acquiring data before & after starting of BRTS. The data constituted information like peak & off-peak hour’s average transit operating speed, BRTS ridership/hour/direction in peak & off-peak hours and frequency of BRTS.
[6]The RP survey questionnaire collected data regarding travel characteristics. SP survey was performed to estimate the transformation in mode choice behavior of travellers under the transit priority policy. To calculate the productivity of transit priority policies on mode shift, three main transit priority policies viz. transit fare discount, MBL and high parking fee in main urban areas
were proposed. These factors were used in developing utility equation.
3. METHODOLOGY
Various SP & RP data analysis models viz. binomial logit model, binary logit model, sequential estimation model, multinomial logit model, discrete choice model, probit model, nested model, fuzzy logic model, ordered logit model are present. Out of which first five models are explained in detail along with validation technique.
[1]RP survey was done to collect commuter’s data. A binomial logistic regression model was developed to calculate the modal shift. It was also used to investigate the consequences of personal & travel characteristics on travel choice of Transit Oriented Development commuters. For analysis purpose five variables were considered out of which three were quantitative and two were categorical.
Categorical Variables
1) Gender (Male/Female) X1
2) PMV Owned (Yes/No) X2
Quantitative Variables
1) Ingress distance to the Metro (Km) X3
2) Age (Years) X4
3) Income (in thousands per month) X5
Binary logistic regression model coefficients are developed from following equation
L= B0 + B1*Gender + B2*Vehicle Ownership + B3*Ingress Distance + B4*Age + B5*Income
where Bi (i=0,1,2,3,4,5) are binary logistic regression model coefficients.
The Logit equation for finding probability is
L= ln (odds) = ln (p/1-p) = B0 + B1X1 + B2X2 + B3X3 + B4X4 + B5X5
where p is probability that mode used before metro was bus.
SPSS software was used in model analysis.
Logistic regression equation for various stations are
Hauz Khas station L = ln (p/1-p) = 1.150 + 0.617X1 + 1.405X2 +0 .008X3 - 0.008X4 - 0.023X5
Kashmere Gate station L = ln (p/1-p) = - 0.477 - 0.211X1 + 1.043X2 + 0.175X3 - 0.012X4 - 0.002X5
© 2018, IRJET | Impact Factor value: 6.171 | ISO 9001:2008 Certified Journal | Page 335 New Delhi station L = ln (p/1-p) = 1.408 + 2.997X1 + 1.778X2
- 0.030X3 - 0.026X4 - 0.019X5
Rajeev Chowk station L = ln (p/1-p) = 0.820 + 1.782X1 + 1.948X2 + 0.024X3 - 0.013X4 - 0.027X5
Central Secretariat station L = ln (p/1-p) = 2.027 + 0.432X1 + 0.600X2 + 0.024X3 - 0.016X4 - 0.043X5
For model validation methods adopted were cross-validation, receiver operating characteristic and classification table.
[2]The shift probability to metro form different mode commuters was affected by travel characteristics. For finding out relation between different attributes and assess mode shift behavior of travellers after the inauguration of metro system, logistic regression model was adopted. To determine choice probabilities basic binary logistic model equations are
( ) (∑ ) [ (∑ )]
(
( ) ) ∑
where Pn (i) = probability of individual n choosing alternative i, Xkin = contributing factor for mode shift and
β’ = coefficient for calibrated model.
[image:4.595.46.554.214.726.2]In questionnaire survey respondent n was questioned whether to shift to a new metro mode i, and the answers were distributed into five group
Table -1:Shift Probability
Rank Shift Probability %
1 5
2 25
3 50
4 75
5 95
Chart -1: Shift Probability vs Rank
To inspect model potential, 50% of data was employed for model estimation and another 50% for model prediction. The calibration of variable coefficients was done using least-squares regression method and NLogit 4.0 software.
[3]Through RP survey actual behavior of commuters was accessed while through SP survey commuters were asked to choose among various hypothetical situations.
[image:4.595.57.268.315.387.2]The RP & SP survey data is represented as follows
Table -2:Responses of SP & RP Data
Responses of RP Data
RP Data
(%)
Responses of SP Data
SP Data
(%) PT
Users 123 80.39 67 39.65 PV
Users 30 19.61 102 60.35 Total 153 100 169 100
Chart -2: Response of RP Data
Chart -3: Response of SP Data 0
20 40 60 80 100
1 2 3 4 5
Sh
if
t P
ro
b
ab
il
it
y
%
Rank
Shift Probability %
123 80% 30
20%
PT Users PV Users
67 40%
102 60%
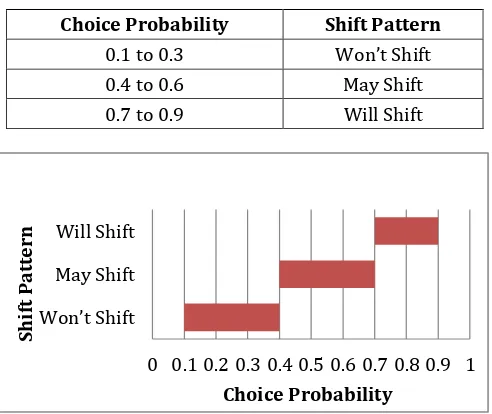
© 2018, IRJET | Impact Factor value: 6.171 | ISO 9001:2008 Certified Journal | Page 336 Following table of choice probabilities of respondents was
[image:5.595.39.285.129.336.2]used to assess mode shift behavior of commuters.
Table -3:Choice Probability & Shift Pattern
Choice Probability Shift Pattern
0.1 to 0.3 Won’t Shift
0.4 to 0.6 May Shift
0.7 to 0.9 Will Shift
Chart -4: Shift Pattern vs Choice Probability
Combined RP & SP Modeling was used to decrease drawbacks. Sequential estimation method was adopted to develop metro utility equation coefficients, employing econometric software NLogit 4.0.
The utility equation developed is as follows.
VMetro = - 0.0512WT - 0.0461TT - 0.0127TC - 1.9926DC + 0.7035
where WT = Waiting Time, TT = Travel Time, TC = Travel Cost, DC = Discomfort Level
[4]RP survey performed for determination of travel patterns of all present modes in city. Multinomial logistic regression was useful in determination of effect of various attributes on shifting behavior of users from bus to two-wheeler and car because of its capability to assess modal share when travel choices available for commuters are greater than two. The variables like gender, age group, vehicle ownership, monthly income, travel distance, time & cost were considered independent for analysis. Above analysis would aid policymakers to revamp government owned city bus service and attract more commuters from private vehicles.
[5]Discrete choice analysis was used in this research. The utility theory was utilized to analyze behavior, where commuters pick a specific travel mode between substitute travel modes to maximize their net advantages. In discrete choice modeling, utility of each option has a deterministic term.
Utility function utilized is as follows.
where Uin = utility of travel mode i for individual n,
Vin = deterministic term assumed to be given by a linear-in-parameters specification, εin = random term.
Binary logistic regression model from survey data was calibrated using NLogit 4.0 software. The socio-economic & travel characteristics attributes were used in finding out probability.
[6]The analysis was done to predict shift from cars to transit under multi-strategies. Logit model was considered because of its good interpretation & simple specifications. The commuter was assumed to pick the choice with greatest utility from various travel modes.
For J travel modes, a utility of traveler can be obtained as
Unj , j = 1 to J and utility equation is
where Vnj = function of measured attributes (Representative Utility), = unobserved attribute
Utility function considering travel and socio-economic characteristics variables is
( ) ∑
where Xj = vector of attributes for alternative j, βj = vector of coefficients.
Multinomial logit model can assess the probability of an individual's choice from different transit modes available considering the utility function.
The probability that alternative j would be considered is calculated as follows.
∑
where J = alternatives available.
4. RESULT AND CONCLUSION
[1]Analysis revealed that 28.8% of metro users switched from PMV and 57% from buses. The shift was less among males than females. Users without PMV shifted into metro from buses more than users with PMV.
Top three possible reasons for shift are as follows
For commuters shifted from PMV:
1) Excessive congestion and traffic on roads. 2) Lesser travel time required in Metro. 0 0.1 0.2 0.3 0.4 0.5 0.6 0.7 0.8 0.9 1
Won’t Shift May Shift Will Shift
Choice Probability
Sh
if
t P
at
te
© 2018, IRJET | Impact Factor value: 6.171 | ISO 9001:2008 Certified Journal | Page 337 3) Travel in metro is cheaper in comparison to own
vehicle.
For commuters shifted from Buses:
1) Travel time in buses is more. 2) Direct bus service is not present. 3) Over crowded buses.
Hence PTS quality matters. In hunt of better quality the travellers shift from one mode of PTS to other (bus to metro). There is also the possibility of mode shift from PMV to better quality PTS (metro). Therefore PTS modes should improve their quality. The females consider metro safer, hence shift more compared to males. Possible reasons for this are security staff on stations, availability of CCTV camera, distinct coaches for females and spacious coaches in comparison to buses.
[2]From RP survey present metro users were earlier 66.6% of bus, 11.4% of taxi, 7.8% of auto, 0.7% of e-bicycle and 0.7% of e-bicycle users while the predicted proportions by SP survey were 56.3% of bus, 11.2% of taxi, 13.3% of auto, 12.1% of e-bicycle and 7.1% of bicycle commuters. Comparing the RP & SP model evaluation results, the modal shift in SP model for commuters from auto, e-bicycle and bicycle were overestimated and form bus was underestimated. It revealed that SP data would overestimate mode shift for private modes & underestimate for public modes. As SP model forecasted modal shift value was less than RP model estimated value. Reason for this might be that the metro commuters not only shifted from adjacent corridor, but also from outer corridor. Additional RP survey on metro line resulted that metro commuters that shifted from auto mode might lower by 8 to 19% due to of insufficient transfer provisions. This output is beneficial for developing cities with insufficient modal joint and incorporation. It was concluded that traffic congestion impact can’t be countered by one metro line and other policies are required. The results indicated that the auto commuters in suburban regions were more minded to migrate to metro for work trips. Female commuters from auto and taxi preferred metro than male commuters. Commuters commuting longer trips also preferred metro.
[3]The RP survey disclosed that 80% of commuters used other PTS before switching to metro. The SP survey disclosed that 60% of private vehicle commuters showed their desire to shift to proposed metro rail alignment. After implementation of Metro Line I, journey period from Versova-Ghatkopar decreased considerably from 90-120 minutes to 21 minutes. Metro has given option of transit mode which is fully air-conditioned, with more capacity & high frequency in comparison to other PTS modes. Hence combined RP-SP survey analysis can give realistic perception of users from realistic travel information from RP respondents and pseudo information from SP respondents.
[4]Analysis revealed that travel time & cost effected travel mode choice. As travel cost and time/distance increases, commuters shift to two-wheelers and cars from PTS. Age had an influence on travel mode choice. Among the PTS, higher age groups favored bus mode. Among the PMV, higher age groups favored car, whereas lower age groups favored two-wheelers as their travel mode. Gender influenced travel mode choice. Car & two-wheeler were mostly preferred as travel mode by males than females. PTS was mostly preferred as travel mode by females than males. Monthly income influenced travel mode choice. PTS was favored by middle and lower income groups. As income increased, percentage of people favoring bus lowered. Car was mostly preferred as main travel mode by high income groups. Two-wheeler was mostly preferred as main travel mode by middle income groups. Vehicle ownership influenced travel mode choice. Two-wheeler owners favored PTS compared to car owners, whereas commuters who owned both two-wheeler and car gave lowest preference to bus and highest preference to car as travel mode. Hence assessment of these factors and its variations would aid city planners to develop efficient transport strategies to enhance transit system. Multinomial logit modeling would aid policymakers to launch various policies to enhance government owned city bus service. This would ensure that much more users shift from private transport mode to public transport mode. Such modal shift is necessary for a developing country. This modal shift would cause significant decrement in traffic volume along already congested city corridors, vehicular emission, fuel consumption & delay.
[5]The analysis revealed that 30 to 50 year old commuters majorly traveled by auto and were less minded to shift to BRTS. Probability of modal shift into BRTS could extend to 15% for 10 min saving in travel time & later gradually increase for a substantial increase in travel time saving. Approximately 67-83% of BRTS commuters were rerouted from normal buses & 68-89% from subways and buses combined. Only 3-8% of auto commuters shifted to BRTS. Shifting to BRTS from e-bikes, bicycles and walking extent from 2 to 12%. The shifting from modes other than subway (normal bus, auto, e-bike, bike and walking) extended from 0 to 17%. The reduction in travel cost could substantially attract more commuters to use BRTS. Hence the attributes like age group, trip cost, travel time saving, travel frequency and trip distance are statistically important in influencing travellers to shift to BRTS. Transportation planners must consider the commuter characteristics and blueprint BRTS with view of attracting commuters and enhancing transit performance.
© 2018, IRJET | Impact Factor value: 6.171 | ISO 9001:2008 Certified Journal | Page 338 traffic. The increment in parking fees and MBL had
substantial effect on modal shift of car commuters. Discount in travel fare was unable to push car users to shift to MRTS.
REFERENCES
[1] Vineet Chauhan, Hemant K. Suman and Nomesh B. Bolia (2016). Binary Logit Model for Estimation of Mode Shift into Delhi Metro. Bentham Open The Open Transportation Journal.
[2] Yuanqing Wang, Lei Li, Zhicheng Wang, Ting Lv and Li Wang (2013). Mode Shift Behavior Impacts from the Introduction of Metro Service: Case Study of Xi’an, China. ASCE Journal of Urban Planning and Development.
[3] Aditya V Sohoni, Mariam Thomas, K V Krishna Rao (2017). Mode shift behavior of commuters due to the introduction of new rail transit mode. Elsevier.
[4] R. Ashalatha, V. S. Manju, and Arun Baby Zacharia (2013). Mode Choice Behavior of Commuters in Thiruvananthapuram City. ASCE Journal of Urban Planning and Development.
[5] Yuanqing Wang, Zhicheng Wang, Zongzhi Li, A.M.ASCE, Samuel R. Staley, Adrian T. Moore and Yanan Gao (2013). Study of Modal Shifts to Bus Rapid Transit in Chinese Cities. ASCE Journal of Urban Planning and Development.