© 2018, IRJET | Impact Factor value: 6.171 | ISO 9001:2008 Certified Journal
| Page 4310
Optimization of welding process parameter to minimize defect in
welding of sheet
Arshad A. Sheikh
1, Prashant D. Kamble
21,2
Department of mechanical engineering, Yeshwantrao chavan college of engineering and technology, Nagpur,
India
---***---Abstract -
The Shielded Metal Arc Welding (SMAW) is the
most widely used welding process in the small scale industries, as well as domestic house hold purpose because of its low cost, portability, versatility, and flexibility. The SMAW welding parameters are the most important factors affecting the quality of product, appearance of product, productivity, cost of welding and repairing cost .In the present work, a design of experiment (DOE) technique of the Taguchi method, has been used to optimize the shielded metal arc welding (SMAW) process parameters for the improvement of weld quality by minimizing defect in welding such as pores, hoe and incomplete fusion in weld bead. A L9 (34) orthogonal array (OA) of Taguchi design which involves nine experiments for four parameters (welding current, welding speed, electrode position, arc voltage) with three levels was used. Under these condition effect of noise such as operator skill are nullified by using three level of it and the contribution of each parameter towards minimizing defect is also estimated by ANOVA. Liquid penetration (LP) testing is one of the NDT methods to identify the surface defect in welding.
Key Words: SMAW, Optimization, Taguchi, Weld parameters, NDT method
1. INTRODUCTION
Shielded metal arc welding is one of the mostly used metal joining process. Most of the work is done by this process because It is more economical and is a much faster process compared to other process of joining. Welding is preferred over other joining process like riveting, casting and nut bolting because it is faster, quieter and many more advantageous over other joining techniques. Now a day, welding is extensively used in fabrications of automobiles, aircrafts, ships, electronic equipment, machinery, and home applications. SMAW is having many advantages over other welding method such as having low cost because of its cheap equipment, portable from one place to other, versatile in nature and flexible to do any type of work. Almost 50% of total joining of metal is done by SMAW process because of its advantages. The quality of welding is decided by inspecting the weld bead and finding the defect in weld bead. There are various method of inspecting the weld bead mostly weld inspection is done by non-destructive method, in NDT methods number of testing technique are available. Liquid penetration (LP) testing is one of the NDT methods to identify the surface defect . Liquid penetrant inspection (LP) reveals surface flaws by the “bleed-out” of a penetrating medium against a contrasting background. This is done by
applying penetrant to the pre-cleaned surface and flaw of the item being inspected. The penetrant is applied to the surface and allowed to remain on the surface for a prescribed time (dwell time); the penetrant liquid will be drawn into any surface opening by capillary action. Following removal of excess penetrant an application of a developer reverses the capillary action and draws penetrant from the flaw. The resultant indications reveal the presence of the flaw so that it can be visually inspected and evaluated by using venire calliper. The quality of weld is depending on the various parameter values of welding and their setting with respect to the work piece to be welded. To predict the effect of welding process variables on weld bead geometry and hence quality researchers have employed different techniques. There are number of various parameter affecting the quality of weld. In the present work welding current, welding speed, electrode position and arc voltage are used to minimizing the defect in weld bead. Taguchi method is a systematic approach to design and analyse experiments for improving the quality characteristics. This method gives us number of run in the form of orthogonal array to conduct experiment to find the optimal setting when the number of factor and their level are decided. This method is very useful to minimize the number of experiment from minimum experiment finding the best result. Taguchi’s comprehensive system of quality engineering is one of the great engineering achievements of the 20th century. His methods focus on the effective application of engineering strategies rather than advanced statistical techniques. It includes both upstream and shop-floor quality engineering.
2. EXPERIMENTATION
© 2018, IRJET | Impact Factor value: 6.171 | ISO 9001:2008 Certified Journal
| Page 4311
of the places for manufacture of any product in industry aswell as in a domestic workshops.
Fig -1: Sample work piece
Table-1: Mechanical property of ASTM A36
[image:2.595.339.522.116.268.2]The input parameter mostly affecting the welding process are Welding current, Welding speed, Electrode position and Arc voltage are selected to optimize the process of welding. The range with respect to given sample piece are selected from ‘Fundamentals of manual metal arc welding Pg. no. 309’ and ‘KOBELCO welding handbook Pg. no. 32’ . The electrode with filler material used in welding is selected as E6013. To optimize the welding process the input variable are divided in three levels and Taguchi DOE is used. The range and their level are shown in table 2.
Table-2 : level of parameter
Input
parameter Level 1 Level 2 Level 3 Welding
current (A) 50 70 90 Welding
speed (cm/min)
24 32 40
Position of electrode
(deg)
30 60 90
Arc voltage
(V) 20 22 24
The number of experiment and the setting of input variable is design by using orthogonal array (matrix) discuss in Taguchi method. In that method for the four independent variable and having three levels the L9 OA is much more suitable. So in present work the L9 orthogonal array is selected to define input variable setting and number of experiment it is show in
table 1.3. the experiments was completed at Metalfab Hifhtech Pvt. Ltd. MIDC, Nagpur.
[image:2.595.37.247.117.275.2]
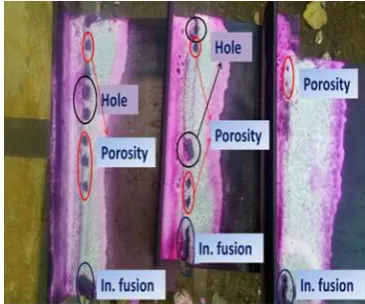
Fig-2 : Liquid penetration testing
3. TESTING
Liquid penetration testing is one of the widely used NDT testing methods. It is used for the surface in continuity which highlighted the defects by contrasting colure of penetrant. In this method first the sample part is clean by using cleaner so that any impurity on part get wash out. Then the penetrant in this study using florescent penetrant is used. Penetrant is spray on welded joint. After 5 min which is called dwell time the excess penetrant get clean out by using clenar. After this procedure the developer is spray in one direction on welded joint. The developer expel out the inside penetrant in defects by the anti-capillary action. This action changing the colure of defects such that the defects are highlighted. And after that this are measured by using vernier caliper. The highlighted defects on sample is shown in fig 2
YTS(MPa) UTS(MPa) elasticity(GPa) Shear (GPa)
[image:2.595.55.269.522.671.2]© 2018, IRJET | Impact Factor value: 6.171 | ISO 9001:2008 Certified Journal
| Page 4312
4. ANALYSIS
The experiments are conducted as per the setting discuss in orthogonal array. Each experiment are conducted thrice to nullify the effect of error. The first experiment is done like the welding current is set at 50 amp, welding speed is 24 cm/min, electrode angle is at 30 deg is maintain, and arc voltage is at 20 volt is adjusted. Similarly each experiment is conducted. After completion of each experiment the defects
are to be measured to find the optimal solution. The Liquid penetration testing method is employeed to measure the defects.in this technique the defects are highlighted then highlighted defects are measured by vernier calliper . the vernier calliper used in experiment having least cunt of 0.02mm. the noise factor consider during optimization is operator skill as SMAW is manually operated method. The level as well their ranges are shown below.
1. First Noise Factor – Less Experience (0-6 Months) 2. Second Noise Factor – Medium Experience (7 Months-3 Years)
3. Third Noise Factor – Highly Experience (Above 3 Years) To nullify the effect of noise on optimization each experiment are done on each of the the noise factor and then taking the average of each of the three readings. The average reading after completion of experiments are shown in table 4
Table-4: Average observation reading
After completion of testing by liquid penetration and
measurement of defects the analysis is done by using taguchi method. In this method the signal to noise ratio are to be calculated for every observation. The nature of defect is gives us which S/N ratio is to be calculated. The output factor holes, porosity and incomplete fusion are to be minimum that’s why smaller the better S/N ratio is used for analysis. the formula for smaller the better S/N ratio is.
(S )/N=-10〖log〗_10 (MSD ) MSD= y^2
Number of Experiments
Welding Current (Amp)
Welding Speed (cm/min)
Electrode Position
(deg)
Arc voltage
(Volt)
1 50 24 30 20
2 50 32 60 22
3 50 40 90 24
4 70 24 60 24
5 70 32 90 20
6 70 40 30 22
7 90 24 90 22
8 90 32 30 24
9 90 40 60 20
Run Input Factor
Porosity (mm)
Incomplete Fusion (cm)
Hole (mm)
C
S
P
V
R1
R2
R3
Avg
R1
R2
R3
Avg
R1
R2
R3
Avg
1
50
24
30
20
3.05
2.8
2.4
2.76
1.5
1.5
0.9
1.31
6.5
5
6
5.83
2
50
32
60
22
2.6
2.1
1.9
2.22
2.8
2.2
1.8
2.3
5.5
1.9
2.6
3.34
3
50
40
90
24
1.9
1.34
1.8
1.68
3.8
2.6
1.4
2.67
10
6.4
3.2
6.53
4
70
24
60
24
1.15
1.2
0.2
0.85
0.8
0.4
0
0.62
3
2
0
2.5
5
70
32
90
20
1.26
1.13
1.2
1.2
3
3.4
2.0
1.82
7
7.1
4
6.05
6
70
40
30
22
1.03
0.99
1.2
1.07
4.5
5.0
3.4
4.32
5.8
5.1
3.5
4.85
7
90
24
90
22
1
0.96
0.9
0.97
5.5
7.1
4.6
5.74
6.6
3.9
4.5
5.03
8
90
32
30
24
0.97
0.92
0.9
0.93
8.5
8.6
4.9
7.37
9.4
9.2
5.5
8.04
© 2018, IRJET | Impact Factor value: 6.171 | ISO 9001:2008 Certified Journal
| Page 4313
Chart-1 S/N of porosity
Chart-2: S/N of incomplete fusion
Chart-3 : S/N of hole
The analysis of project is completed by using minitab software and y using taguchi method. Above graph are the S/N ratio graphs. The graph are generated separately for each of the output parameter such as porosity in fig 1.2, incomplete fusion in fig 1.3 and hole in fig 1.4. The graph shows the optimal setting for each of the output. The point at which the S/N is more is the optimal setting. The optimal settings for different parameter are shown in table 5.
Table-5: Optimal setting
variable
porosity
Incomplete
fusion
hole
Welding
current
90
70
70
Arc voltage
24
24
22
Welding
speed
40
24
24
Electrode
angle
60
60
60
5. RESULT AND DISCUSSION
The experimentations was carried out to eliminate the welding defects and to increase the welding quality. During study it is found that welding defects affect the welding appearance of product. If there is welding defects in the sheet, the selling cost product is become less. The extra repairing cost is required to remove defects from product. The experimentations are carried out with the help of Taguchi DOE analysis. It is done for getting better result i.e. minimization of defects occur welding of sheet. All the experimental project work is completed at Metalfab Hightech Pvt. Ltd, Hingna MIDC, Nagpur. After completion of analysis the percentage reduction of defect at optimal setting is Porosity is minimized by 63.19%, Incomplete fusion is minimized by 73.72% Pin holes is minimized by 30.31%. This percentage of defect reduction is very much beneficial for industry and reduces repairing cost much more
REFERENCES
[1] Raghavendra N and Dileep Kumar “An Experimental
Study and Optimization of Shielded Metal Arc Welding Parameters for Welding of Pipes by Using Taguchi Approach”, European Journal of Advances in Engineering and Technology, (2015) vol 2, issue 1, pp.42-45.
[2] Gang Wang, T. Warren Liao, “Automatic identification of
different types of welding defects in radiographic images” NDT&E International Elsvier publication, (2002), vol 2
[3] Deming, W. E., “Out of the Crisis”, Unlimited Learning
Resource, LLC, Winston-Salem, North Carolina, (1982), vol 1.
[4] S.M.Ravikumar, Dr.P.Vijian, “Optimization of weld bead
geometry in Shielded Metal Arc Welding using Taguchi Based Grey Relational Analysis” International Journal of Mechanical & Mechatronics Engineering (2014).
[5] R.P. Singh, R.C. Gupta and S.C. Sarkar “The Effect of
© 2018, IRJET | Impact Factor value: 6.171 | ISO 9001:2008 Certified Journal
| Page 4314
Innovation in Engineering & Management. (2012),Volume 1, Issue 4, ISSN 2319 – 4847.
[6] Casalino, G., Curcio, F. and Minutolo, F.M.C.,
“Investigation on Ti6Al4V laser welding using statistical and Taguchi approaches.” Journal of Materials Processing Technology, (2005) Volume 167, Issues 2–3, pages 422-428
[7] S.M. Tabatabaeipour, F. Honarvar “A comparative
evaluation of ultrasonic testing of AISI 316L welds made by shielded metal arc welding and gas tungsten arc welding processes” Journal of Materials Processing Technology ELSEVIER (2010).
[8] Changyin Dang, “Stainless Steel Weld Defect Detection
using Pulse Inductive Thermography”, IEEE, Transaction of Applied Super Conductivity, (2016) vol 26, October.
[9] P. F. Mendez and t. W. Eagar, “Penetration and Defect
Formation in High-Current Arc Welding”, welding research, New Delhi (2003) pg. no. 13 to 20.
[10] A.Sivashankar S.Shaghulhameeth , “Welding process
parameters & optimization & analysis OF SS410 with mild steel by using taguchi”, International Journal of Advanced Research Methodology in Engineering & Technology, Volume 1, Issue 2, March 2017, ISBN 978-1-63535-889-6.
[11] S. V. Sapakal, M. T. Telsang, “parametric optimization of
mig welding using taguchi design method”, International Journal of Advanced Engineering Research and Studies (2012)
[12] Jiju Antony, “Design of Experiments for Engineers and
Scientists”, Elsevier Science & Technology Books Publication (2003) pg. no.3 to 7.
[13] Edwin Raja Dhasa,, S. Kumananb,, “Optimization of
parameters of submerged arc weld using non conventional techniques”, Applied Soft Computing 11 (2011) 5198–5204 Elsevier (2010) .
[14] S.M.Ravikumar, Dr.P.Vijian, “Optimization of weld bead
geometry in Shielded Metal Arc Welding using Taguchi Based Grey Relational Analysis”, International Journal of Mechanical Mechatronics Engineering (2011) IJMME-IJENS Vol:14 No:04