http://dx.doi.org/10.4236/ajps.2015.64054
How to cite this paper: El Mokh, F., Nagaz, K., Masmoudi, M.M. and Mechlia, N.B. (2015) Yield and Water Productivity of Drip-Irrigated Potato under Different Nitrogen Levels and Irrigation Regime with Saline Water in Arid Tunisia. American Journal of Plant Sciences, 6, 501-510. http://dx.doi.org/10.4236/ajps.2015.64054
Yield and Water Productivity of
Drip-Irrigated Potato under Different
Nitrogen Levels and Irrigation Regime
with Saline Water in Arid Tunisia
Fathia El Mokh
1, Kamel Nagaz
1*, Mohamed Moncef Masmoudi
2, Netij Ben Mechlia
2 1Institut des Régions Arides, Médenine, Tunisia2INAT, Tunis, Tunisia
Email: fathiamokh@yahoo.fr, *Nagaz.Kameleddine@ira.rnrt.tn, masmoudi.med@inat.agrinet.tn,
Netij.Benmechlia@iresa.agrinet.tn
Received 13 January 2015; accepted 28 February 2015; published 3 March 2015
Copyright © 2015 by authors and Scientific Research Publishing Inc.
This work is licensed under the Creative Commons Attribution International License (CC BY).
http://creativecommons.org/licenses/by/4.0/
Abstract
Field studies were conducted on a sandy soil during autumn of 2010 and 2011 in an arid region of Tunisia to investigate the effects of nitrogen and irrigation regimes with saline water on yield and water productivity (WP) of potato (Solanum tuberosum L. cv. Spunta) and soil salinity. For the two years, irrigation treatments consisted in water replacements of cumulated crop evapotranspira-tion (ETc) at levels of 100% (I100, full irrigaevapotranspira-tion), 60% (I60) and 30% (I30), when the readily available water in I100 treatment was depleted, while the nitrogen treatments (N) were 0, 100, 200, and 300 kg/ha (No, N100, N200, and N300). Results showed that soil salinity values remained lower than those of electrical conductivity of irrigation water (ECiw) and were the lowest under treatment I100 and the highest with I30 treatment. Relatively low ECe values were also observed under I60 treatment. The highest potato yields for the two years were obtained with I100 treat-ment. Compared to I100, significant reductions in potato yields were observed under I60 and I30 deficit irrigation treatments resulting from a reduction in tubers number/m² and tuber weight. The water productivity (WP) was found to significantly vary among treatments, where the highest and the lowest values were observed for I30 and I100 treatments, respectively. Potato yield and WP increased with an increase in nitrogen rates. The rate of 300 kg N/ha was seen to give good yield and higher WP of potato under full (I100) and deficit (I60) irrigation treatments. However, application of N adversely affected potato yield and WP, when N level applied above 200 kg N/ha at I30. The WP was improved by N supply, but its effect decreased as the irrigation level increased. The IWP at I100, which produced the highest potato yield, was 8.5 and 9.9 kg/m3 with N300 but
sults suggested that potato in arid region could be cultivated with acceptable yields while saving irrigation water and reducing nitrogen supply but it was essential to exploit the interaction effect between these two parameters to maximize resource use efficiency.
Keywords
Potato, Salinity, Irrigation Scheduling, Deficit Irrigation, Nitrogen, Yield, Water Productivity, Arid
1. Introduction
When crops, sensitive to salinity, are introduced in areas with prevailing arid conditions and saline waters, there is always a challenge for best irrigation management and the associated salinity problems. This is the case of southern-east of Tunisia where water resources are limited and not land. In this area, irrigation of potato crop is expanding around shallow wells (Total dissolved Salt, TDS > 2 g/l) in private farms. Drip irrigation is widely used in potato production in this region, because cost of installation has relatively decreased with the easy access to subsidized drip irrigation equipment made possible recently. With the drip irrigation systems, water and nu-trients can be applied directly to the crop at the root level, having positive effects on yield and water savings [1].
[2] [3] showed that saline water could be efficiently used through drip irrigation even on saline soils. Moreover, it results in considerable saving in irrigation water [4] [5] thus reducing the risks of salinization and also nutrient leaching [6].
Many studies and reports have been documented regarding the effects of water deficit and irrigation regimes on potato crop in many parts of the world [7]-[9]. The yield is greatly influenced by timing and duration of water stress during the different growth stages of potato crop [10]. Scheduling water application is very important to make the most efficient use of drip irrigation method, since excessive irrigation reduces yield, while inadequate irrigation causes water stress and reduces production [11]. Therefore, optimal irrigation scheduling requires ac-curate estimates of crop evapotranspiration (ETc) [12]. However, determination of ETc during the initial stage without full ground cover requires considering soil evaporation and crop transpiration separately [13]. In our case, it is very important to know with high degree of accuracy the irrigation water requirements and the appro-priate supply regimes for the considered crop, i.e., potato.
This crop has critical periods of growth when irrigation is a necessity for optimal yield and quality [7] and, as in other horticultural crops, nitrogen (N) is a dominant nutrient in the growth, development, yield and quality
[14]. Though information about irrigation and N management of this crop is often conflicting in the literature, it is accepted generally that production and quality are highly influenced by both N and irrigation amounts and these requirements are related to the cropping technique. Improvements in cropping techniques, such as fertiga-tion, have been responsible for an increase in potato yields, but inappropriate amounts of both water and N fer-tiliser are commonly used by potato growers. Thus, careful N and water supply is required to ensure high crop yields. Modern production practices involve optimisation of both N and water use in order to optimise crop production and minimise the risk of N leaching towards underground water.
Previous studies have shown that adequate water supply before and during tubers initiation increases the number of tubers per plant [15] [16]; whereas, after tubers initiation, it increases their individual sizes [17] [18]. Water deficit produces smaller tuber size and lower yields [7] [8]. According to [19], reduction of water supply more than 33% of the crop irrigation requirement could not be suggested under the Turkish conditions, whereas
[20] advised on avoiding regimes that led to deficit in the ripening stage as well as at growth or tuber bulking in the semi arid environments of Albacete, Spain. Thus, irrigation is an important component of potato production areas in arid regions and it is crucial to maximize water use due to the energy requirement of the drip irrigation method and limited water supplies. The only way to accomplish this is to use water efficiently [21]. The effect of both water and N on potato crop has been reported in the literature frequently with different conclusions; likely because optimal rates vary according to different crop varieties, plant density, soil types and climate con-ditions.
salin-ity on plant growth and yield [22] [23]. Thus, careful N and water management is required for potato to ensure regular growth, high dry matter content and marketable tubers [24]. Several experiments have been carried out on the irrigation and fertilization of potatoes in the various regions of the world. The nitrogen requirement which is the most limiting essential nutrient for potato growth, especially in sandy soil, depends greatly from the cli-mate, soil, variety, irrigation and cultural practices. However, in the arid regions of Tunisia, the potato is widely grown. Experiments on irrigation and nitrogen requirements of potato crops and new irrigation techniques that use irrigation water effectively are limited. Therefore, a two-year experiment was initiated in 2010 with the ob-jective to study the interaction effect between water and N applied at different levels on yield and water use effi-ciency of potato under arid conditions of southern Tunisia.
2. Materials and Methods
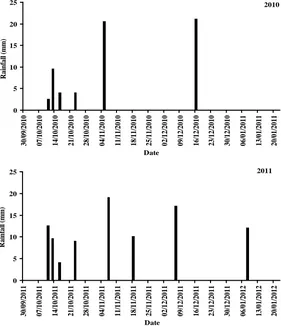
[image:3.595.174.455.368.694.2]The field experiment was carried out during autumn season of 2010 and 2011 in a commercial farm situated in the southern east of Tunisia (33˚50'N, 10˚64'E; altitude 30 m) in the region of Médenine. The climate is typical of arid areas and the rainfall recorded in 2010 and 2011, from October to January during the cropping period of potato is reported in Figure 1. The soil of the experimental area is sandy soil with low organic matter content (<7 g/kg). Average values in the 60 cm topsoil of field capacity (0.33 bar, pF 2.5) and permanent wilting point (15 bar, pF 4.2), determined by the membrane method, are respectively 12.69% and 4.3%. The bulk density of soil was 1.47 g/cm3. The total soil available water calculated between field capacity and wilting point for an as-sumed potato root extracting depth of 0.60 m, was 74 mm. The electrical conductivity (ECe) values measured before planting of fall potato are, respectively, 4.9 and 3.7 dS/m for the first and second year. The level of available nitrogen in the soil was very low (less than 0.008%) and thus was not taken into consideration while calculating the fertilizer for different treatments.
Figure 1. Values of rainfall received during the potato cropping periods for 2010 and 2011.
A split-plot design with four replications was used. Irrigation level was assigned to the main plot and nitrogen levels to the subplots applied through drip irrigation system. The considered irrigation regimes were: full irriga-tion (I100) treatment irrigated when readily available water in the root zone had been depleted and plants in that treatment received 100% of accumulated crop evapotranspiration (ETc), two additional treatments were irrigated at the same frequency as treatment I100, but with quantities equal to 60% and 30% of accumulated ETc (40% deficit (I60) and 70% deficit (I30)). The levels of nitrogen (N) were 0 (No), 100 (N100), 200 (N200) and 300 kg N/ha (N300).
Tubers of the late maturity potato (Solanum tuberosum L.) cultivar “Spunta” was hand planted in 1 October each year in 0.70 m rows with plants spaced 0.40 m apart. Each subplot consisted of six rows. All plots were drip irrigated with water from a shallow well having an electrical conductivity of irrigation water (ECi) of 7 dS/m. Each dripper had a 4 l/h flow rate. Water for each block passed through a water meter, gate valve, before passing through laterals placed in every potato row. A control mini-valve in the lateral permits use or non-use of the dripper line. Fertilizers were supplied for the cropping periods in the same amounts; before planting, soil was spread with 17 t/ha of organic manure. The P2O5 and K2O fertilizers were applied as basal dose before planting
at rates of 300 and 200 kg/ha, respectively. The total amount of N at variable levels was applied as ammonium nitrate, which was divided and delivered with the irrigation water in all treatments during early vegetative growth. After tubers initiation stage, 120 kg/ha of potassium nitrate was applied for all treatments.
The crop evapotranspiration (ETc) was estimated for daily time step by using reference evapotranspiration (ETo) combined with a potato crop coefficient (Kc). ETo is estimated using daily climatic data collected from the meteorological station, located at Médenine, Tunisia and the FAO-56 Penman-Monteith method (ETo-PM) given in [25]. The potato crop coefficient (Kc) was computed following the recently developed FAO-56 dual crop coefficient approach, the sum soil evaporation (Ke) and basal crop coefficient (Kcb) reduced by any occur-rence of soil water stress (Ks), that provides for separate calculations for transpiration and soil evaporation (Kc = KsKcb + Ke).
For irrigation scheduling, the method used was the water balance, by means of a spreadsheet program for Ex-cel, developed according to the methodology formulated by [25]. The spreadsheet program estimates the day when the target soil water depletion (readily available water, RAW) for the treatment I100 would be reached and the amount of irrigation water needed to replenish the soil profile to field capacity. The program calculates the soil water depletion on daily basis using the soil water balance and projects the next irrigation event based on the target depletion (35% of total available water in the root zone, 35% of TAW). The soil depth of the effective root zone is increased with the program from a minimum depth of 0.15 m at planting to a maximum of 0.60 m in direct proportion to the increase in the potato crop coefficient.
At physiological maturity stage, potato yield is determined for each treatment. Twenty plants per row within each plot are harvested by hand in the third week of January to determine potato yield, tuber number/m and tu-ber weight.
Soil samples were collected after harvest. The soil was sampled with a 4 cm auger every 15 cm to a depth of 60 cm, at four sites perpendicular to the drip line at distances of 0, 10, 20 and 30 cm from the line, and at four sites between the emitters (0, 7, 15 and 20 cm from the emitter). Conceptually, these should be areas represent- ing the range of salt accumulations [26] [27]. Samples were air-dried and ground to pass a mesh of 2 mm size and were analyzed for ECe.
Water productivity (WP) is defined as the yield obtained per unit of water consumed, whether from irrigation or total received, therefore including the precipitation. The WP was calculated as follow: WP (kg/m3) = Yield (kg/ha)/total water received (m3/ha) from planting to harvest; an irrigation of 74 mm applied before planting is not included in the total.
All data were subjected to the analysis of variance (ANOVA) appropriate to the experimental design to evaluate the effects of treatments on the yield, yield components of potato, soil salinity and water use efficiency. STATGRAPHICS Plus 5.1 (www.statgraphics.com) was used to conduct the analysis of variance. Comparison of treatment means was carried out using the least significant difference (LSD) at 5% probability level.
3. Results and Discussion
3.1. Soil Salinity
planting, development, mid-season and harvest period of the autumn potato are presented in Figure 2. Initial soil salinity values determined at planting were, respectively, 4.9 and 3.7 dS/m in the first and second year. The re-sults show that during the two years, a decrease in ECe values measured at development, mid-season and harvest is observed under all irrigation treatments compared to initial soil salinity. The decrease of ECe values is attri-buted to the leaching of soluble salts by fall and winter rains (61.5 and 93 mm) (Figure 1) and the decrease in evaporative demand in autumn. The capacity of fall-winter rainfall to leach salts in the region is variable and depends on the total amount and distribution of rainfall events. This is illustrated by the lowest ECe values ob-served in the second year which corresponds to the highest amount of total rainfall during potato growing season (Figure 1) that seemed to be effective in removing salts accumulated in the root zone.
For both years, I100 resulted in a significantly lower ECe values than with deficit irrigation treatments (Figure 2). Higher soil salinity levels were observed for I60 and I30 deficit irrigation regimes. ECe values were in order I100 < I60 < I30. The reason for the higher soil salinity obtained for deficit irrigation treatments is at-tributed to absence of substantial leaching under deficit irrigation conditions. [28]-[30] reported that one conse-quence of reducing irrigation water use by deficit irrigation is the greater risk of increased soil salinity due to reduced leaching.
[image:5.595.172.458.358.705.2]ECe values under the different irrigation treatments were lower than the EC of irrigation water used. [31] ob-served that the extent of salt accumulation depends on soil texture and reported that in soils containing less than 10% clay the ECe values remains lower than ECiw. Low values of ECe under the prevailing climatic conditions were due to the natural leaching of soluble salts by rainfall that occurred during fall and/or winter periods (Figure 1). Thus, under actual farming conditions, the use of saline waters for irrigation of short-cycle crops during the rainy season seems to have low impact on soil salinization as salts added by irrigation are removed from the root zone by natural leaching.
Figure 2. Soil salinity (ECe, dS/m) under different irrigation regimes. 0
1 2 3 4 5 6 7
Planting Development Mid-season Harvest
Period
E
C
e
(
dS/
m
)
I30
I60 I100 2010
0 1 2 3 4 5 6 7
Planting Development Mid-season Harvest
Period
E
C
e
(
dS/
m
)
3.2. Yield and Yield Components
For both experiments, potato tuber yield varied widely under different amounts of water applied through drip ir-rigation at different levels of nitrogen (Table 1). Full irrigation regime resulted in the highest tuber yield under all N levels and there were significant reductions on total yield when applying a smaller amount of irrigation water. The reduction in yield with 40% (I60) reduction in irrigation water averaged 22.4% and 20.2%, respec-tively, in first and second year, suggesting that the crop is not very sensitive to moderate water deficit. Whereas by applying 70% (I30) less amount of irrigation water, potato yield decreased by 50.1% and 43.4%, respectively, for 2010 and 2011. Similar results were found by [6] [32]. The reduction in potato yield was attributed to reduc-tion in tubers number and weight (Table 2). Previous studies have also reported significant tuber yield and size reductions with the reduction of applied water [7] [8]. Note that the deficit irrigation regimes results in higher salinity in the rooting zone than the full irrigation regime (I100) (Figure 2). A higher salinity associated with deficit irrigation caused important reductions in tuber yield and its components.
The crop was found to be responsive to increasing nitrogen fertilizer level (Table 1). Mean tubers yield in-creased up to 300 kg/ha. The difference in tubers yield was significant between different fertilizer rates except No - N100 (0 - 100 kg N/ha) and N200 - N300 (200 - 300 kg N/ha) where it was not significant. The increase in tubers yield may be attributed to improved growth and yield components due to nitrogen application (Table 2). There were differences between two experiments in potato yields. Yields were highest in the second year be-cause of the low soil salinity and the higher amount of rainfall (93 mm).
[image:6.595.85.538.438.711.2]The interaction effect between irrigation and nitrogen for potato yield was significant, indicating that both factors did not act separately (Table 1). Tuber yield increased up to the highest level of N (N300) at I100 and I60 however the response to applied N was observed only up to N200 at I30 irrigation regime. This finding im-plies that increasing N rate under severe water deficit will be relatively inefficient, may be because of an adverse effect of excessive N on yields. These results are in agreement with the findings of [6], who reported that pro-ductivity of applied nitrogen under severe water stress conditions decreased with applied excess nitrogen. Under the conditions of water deficit, N application levels would not be the limiting factor for increasing potato tuber yields whenever the amount of water applied would probably be the important factor. This may indicate that under deficient water conditions the efficiency of N fertilizer is reduced due to inhibition of growth rate [33].
Table 1. Effect of irrigation regimes (I) and nitrogen (N) interaction on potato yield (t/ha).
Irrigation regimes Nitrogen levels (kg/ha)
No N100 N200 N300 Mean
2010
I30 7.42 ± 1.80* 8.53 ± 0.91 9.68 ± 0.39 9.24 ± 1.93 8.72
I60 11.39 ± 1.04 12.05 ± 2.04 14.78 ± 2.60 15.94 ± 0.43 13.54
I100 13.15 ± 0.46 15.07 ± 1.01 18.89 ± 1.76 22.72 ± 0.60 17.46
Mean 10.65 11.88 14.45 15.97
2011
I30 9.48 ± 1.55 11.53 ± 1.05 12.01 ± 0.71 11.91 ± 1.14 11.23
I60 12.45 ± 1.66 14.15 ± 1.87 16.95 ± 2.10 19.7 ± 0.97 15.81
I100 14.99 ± 0.90 17.83 ± 1.34 21.4 ± 2.04 25.12 ± 1.17 19.84
Mean 12.31 14.50 16.79 18.91
LSD (5%)
Factor 2010 2011
Irrigation (I) 2.114 2.009
Nitrogen (N) 2.315 2.104
I × N 1.752 1.604
*
Table 2. Yield components under different irrigation regimes and nitrogen levels.
Irrigation regimes
*Tubers number/m2 *Tuber weight (g)
2010 2011 2010 2011
I30 17.50 ± 1.14 20.70 ± 1.77 61.47 ± 3.70 66.5 ± 3.44
I60 22.00 ± 2.01 24.50 ± 1.93 75.79 ± 2.91 81.22 ± 3.10
I100 24.50 ± 2.12 27.75 ± 2.40 93.32 ± 3.04 99.77 ± 3.12
LSD (5%) 1.677 1.911 3.993 4.001
Nitrogen levels (kg/ha)
No 18.00 ± 0.70 19.75 ± 1.32 68.72 ± 4.72 72.61 ± 2.66
N100 19.50 ± 2.20 21.62 ± 1.57 77.09 ± 2.95 80.80 ± 2.81
N200 21.50 ± 3.17 23.96 ± 2.11 87.21 ± 4.1 93.50 ± 3.26
N300 23.70 ± 1.51 25.95 ± 1.33 93.31 ± 3.61 96.33 ± 3.75
LSD (5%) 1.447 1.733 4.621 5.211
*
Mean ± standard deviation (SD).
3.3. Water Productivity
The amounts of water applied for the potato from planting to harvest over the two-year period are given in
Table 3. Irrigation water applied before planting of potato (74 mm) each year is not included in the total. Total rainfall amounts for the two growing seasons were 61.5 and 93 mm in 2010 and 2011, respectively. Cumulative ETo over the growing season for the two year study were 384 and 376 mm, respectively. For I100 treatment, giving 100% ETc, irrigation amounts of the two years were 269 mm in 2010 and 254 mm in 2011. These amounts are comparable to those reported by to those reported by [8] [14] [20]. The total amount of irrigation water applied ranged from 330.5 mm in I100 to 142.5 in I30 and from 348 mm in I100 to 170 mm in I30, re-spectively, for 2010 and 2011.
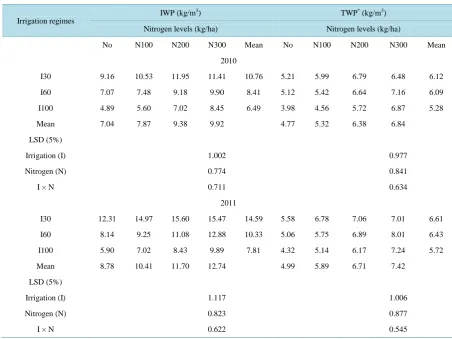
Water productivity (WP) based on fresh tuber production was expressed as the ratio of tuber yield at harvest to the water supply (Table 3). The WP values obtained in this study were similar to those reported for potato by others [8] [34] and were affected by irrigation regimes and N levels. There is also a variation in WPvalues be-tween years. For all irrigation and N treatments, yield was higher in the second year compared to the fist one. Values of irrigation water productivity (IWP) reflect this difference, they varied typically around 4.9 - 12, and 5.9 - 15.6 kg/m3, respectively, in the first and second year.
The water was used more efficiently in the deficit irrigation treatments where lower amounts of water gener-ally have higher WP values. The higher mean WP of potato as a result of N fertilization was due to an increase in potato yields. These results are in close agreement with those of [35].
Table 3. IWP and TWP for fresh tubers yield under different irrigation regimes and nitrogen levels.
Irrigation regimes
IWP (kg/m3) TWP* (kg/m3)
Nitrogen levels (kg/ha) Nitrogen levels (kg/ha)
No N100 N200 N300 Mean No N100 N200 N300 Mean
2010
I30 9.16 10.53 11.95 11.41 10.76 5.21 5.99 6.79 6.48 6.12
I60 7.07 7.48 9.18 9.90 8.41 5.12 5.42 6.64 7.16 6.09
I100 4.89 5.60 7.02 8.45 6.49 3.98 4.56 5.72 6.87 5.28
Mean 7.04 7.87 9.38 9.92 4.77 5.32 6.38 6.84
LSD (5%)
Irrigation (I) 1.002 0.977
Nitrogen (N) 0.774 0.841
I × N 0.711 0.634
2011
I30 12.31 14.97 15.60 15.47 14.59 5.58 6.78 7.06 7.01 6.61
I60 8.14 9.25 11.08 12.88 10.33 5.06 5.75 6.89 8.01 6.43
I100 5.90 7.02 8.43 9.89 7.81 4.32 5.14 6.17 7.24 5.72
Mean 8.78 10.41 11.70 12.74 4.99 5.89 6.71 7.42
LSD (5%)
Irrigation (I) 1.117 1.006
Nitrogen (N) 0.823 0.877
I × N 0.622 0.545
*
Total water productivity.
4. Conclusion
Our results showed full irrigation (I100) and deficit irrigation treatment (I60) maintained low level of soil salin-ity while higher soil salinsalin-ity levels in the root zone were observed with I30 deficit irrigation strategy. Yield and yield components of potato were generally more responsive to irrigation than to nitrogen level (N) under the conditions of the experiment. Potato yield, yield components and water productivity were significantly affected by irrigation regime, N rate, and irrigation × N interaction. The decrease in tuber yield in the deficit irrigation treatments was mainly due to a decrease in tuber number and weight. A higher salinity associated with deficit ir-rigation caused important reductions in tuber yield and its components. The increase of nitrogen level produces an increase in the tuber yield at full (I100) and deficit (I60) irrigation regimes, while under severe deficit regime (I30) increased N level more than 200 kg N/ha negatively affects tuber yield. The response to nitrogen was re-lated to the amount of irrigation water applied where N level required for maximum yield decreased under se-vere water restriction (I30). The water was used more efficiently with deficit irrigation treatments (I30 and I60) where WP increased with lower amounts of irrigation water. The highest WP values were obtained at I30 with N200 level while the lowest values were obtained at I100 with No. Higher WP was observed with nitrogen rate of 300 kg/ha under I100 and I60 irrigation regimes, but with I30 irrigation regime the highest WP was observed with N200. These results underline the importance of determining the interaction effect between water and ni-trogen under different levels on potato yield to formulate proper management practices for sustainable produc-tion.
References
392-396. http://dx.doi.org/10.13031/2013.32798
[2] Ayers, J.E., Hutmacher, R.B., Schoneman, R.A., Vail, S.S. and Felleke, D. (1986) Drip Irrigation of Cotton with Saline Drainage Water. Transactions of the American Society of Agricultural Engineers, 29, 1668-1673.
http://dx.doi.org/10.13031/2013.30371
[3] Saggu, S.S. and Kaushal, M.P. (1991) Fresh and Saline Water Irrigation through Drip and Furrow Method. Interna-tional Journal of Tropical Agricultural, 9, 194-202.
[4] Phene, C.J., Davis, K.R., Mead, R.M., Yue, R., Wu, I.P. and Hutmacher, R.B. (1994) Evaluation of a Subsurface Drip Irrigation System after Ten Cropping Seasons. ASAE Pap. 932560 (Winter Meeting, Chicago). ASAE, St. Joseph.
[5] Yohannes, S. and Tadesse, T. (1998) Effect of Drip and Furrow Irrigation and Plant Spacing on Yield of Tomato at Dire Dawa, Ethiopia. Agricultural Water Management, 35, 201-207. http://dx.doi.org/10.1016/S0378-3774(97)00039-5
[6] Darwish, T., Atallah, T., Hajhasan, S. and Chranek, A. (2003) Management of Nitrogen by Fertigation of Potato in Lebanon. Nutrient Cycling in Agroecosystems, 67, 1-11. http://dx.doi.org/10.1023/A:1025107202143
[7] Yuan, B.Z., Nishiyama, S. and Kang, Y. (2003) Effects of Different Irrigation Regimes on Growth and Yield of Drip- Irrigated Potato. Agricultural Water Management, 63, 153-167. http://dx.doi.org/10.1016/S0378-3774(03)00174-4
[8] Onder, S., Caliskan, M.E., Onder, D. and Caliskan, S. (2005) Different Irrigation Methods and Water Stress Effects on Potato Yield and Yield Components. Agricultural Water Management, 73, 73-86.
http://dx.doi.org/10.1016/j.agwat.2004.09.023
[9] Kaur, M., Narda, N.K. and Chawla, J.K. (2005) Irrigation and Potassium Management in Trickle Fertigated Potato (Solanum tuberosum L.). Indian Journal of Agricultural Science, 75, 290-291.
[10] Opena, G.B. and Porter, G.A. (1999) Soil Management and Supplemental Irrigation Effects on Potato. II. Root Growth.
Agronomy Journal, 91, 426-431. http://dx.doi.org/10.2134/agronj1999.00021962009100030011x
[11] Wang, F., Kang, Y. and Liu, S. (2006) Effects of Drip Irrigation Frequency on Soil Wetting Pattern and Potato Growth in North China Plain. Agricultural Water Management, 79, 248-264. http://dx.doi.org/10.1016/j.agwat.2005.02.016
[12] Doorenbos, J. and Pruitt, W.O. (1977) Crop Water Requirements. Irrigation and Drainage Paper No. 24, 144 p.
[13] Ritchie, J.T. (1972) Model for Predicting Evaporation from a Row Crop with Incomplete Cover. Water Resources Re-search, 8, 1204-1213. http://dx.doi.org/10.1029/WR008i005p01204
[14] Waddell, J.T., Gupta, S.C., Moncrief, J.F., Rosen, C.J. and Steele, D.D. (1999) Irrigation and Nitrogen Management Effects on Potato Yield Tuber Quality, and Nitrogen Uptake. Agronomy Journal, 91, 991-997.
http://dx.doi.org/10.2134/agronj1999.916991x
[15] Cappaert, M.R., Powelson, M.L., Christensen, N.W., Stevenson, W.R. and Crowe, F.J. (1992) Influence of Irrigation Severity on Potato Early Dying Tuber Yield. Phytopathology, 82, 1448-1453. http://dx.doi.org/10.1094/Phyto-82-1448
[16] Shock, C.C., Zalewski, J.C., Stieber, T.D. and Burnett, D.S. (1992) Impact of Early-Season Water Deficits on Russet Burbank Plant Development, Tuber Yield and Quality. American Potato Journal, 69, 793-803.
http://dx.doi.org/10.1007/BF02854186
[17] Stark, J.C. and McCann, I.R. (1992) Optimal Allocation of Limited Water Supplies for Russet Burbank Potatoes.
American Potato Journal, 69, 413-421. http://dx.doi.org/10.1007/BF02852292
[18] Shock, C.C., Feibert, E.B.G. and Saunders, L.D. (1998) Potato Yield and Quality Response to Deficit Irrigation.
HortScience, 33, 655-659.
[19] Sermet, O., Caliskan, M.E., Onder, D. and Caliskan, S. (2005) Different Irrigation Methods and Water Stress Effects on Potato Yield Components. Agricultural Water Management, 73, 73-86.
http://dx.doi.org/10.1016/j.agwat.2004.09.023
[20] Fabeiro, C., De Santa Ollala, F.M. and De Juan, J.A. (2001) Yield and Size of Deficit Irrigated Potatoes. Agricultural Water Management, 48, 255-266. http://dx.doi.org/10.1016/S0378-3774(00)00129-3
[21] Ferreira, T.C. and Goncalves, D.A. (2007) Crop-Yield/Water-Use Production Functions of Potatoes (Solanum tubero- sum L.) Grown under Differential Nitrogen and Irrigation Treatments in a Hot Dry Climate. Agricultural Water Man-agement, 90, 45-55. http://dx.doi.org/10.1016/j.agwat.2007.02.012
[22] Albassam, B.A. (2001) Effect of Nitrate Nutrition on Growth and Nitrogen Assimilation of Pearl Millet Exposed to Sodium Chloride Stress. Journal of Plant Nutrition, 24, 1325-1335. http://dx.doi.org/10.1081/PLN-100106984
[23] Flores, P., Carvajal, M., Cerda, A. and Martinez, V. (2001) Salinity and Ammonium/Nitrate Interactions on Tomato Plant Development, Nutrition, and Metabolites. Journal of Plant Nutrition, 24, 1561-1573.
http://dx.doi.org/10.1081/PLN-100106021
[25] Allen, R.G., Perreira, L.S., Raes, D. and Smith, M. (1998) Crop Evapotranspiration: Guidelines for Computing Crop Water Requirements. Irrigation and Drainage Paper No. 56, FAO, Rome, 300 p.
[26] Bresler, E. (1975) Two-Dimensional Transport of Solutes during Nonsteady Infiltration from Trickle Source. Soil Sci- ence Society of America Journal, 39, 604-613. http://dx.doi.org/10.2136/sssaj1975.03615995003900040014x
[27] Singh, S.D., Gupta, J.P. and Singh, P. (1977) Water Economy and Saline Water Use by Drip Irrigation. Agronomy Journal, 70, 948-951. http://dx.doi.org/10.2134/agronj1978.00021962007000060014x
[28] Schoups, G., Hopmans, J.W., Young, C.A., Vrugt, J.A., Wallender, W.W., Tanji, K.K. and Panday, S. (2005) Sustai-nability of Irrigated Agriculture in the San Joaquin Valley, California. Proceedings of the National Academy of Sci- ences of the United States of America, 102, 15352-15356. http://dx.doi.org/10.1073/pnas.0507723102
[29] Kaman, H., Kirda, C., Cetin, M. and Topcu, S. (2006) Salt Accumulation in the Root Zones of Tomato and Cotton Ir-rigated with Partial Root-Drying Technique. Irrigation and Drainage, 55, 533-544. http://dx.doi.org/10.1002/ird.276
[30] Geerts, S., Raes, D., Garcia, M., Condori, O., Mamani, J., Miranda, R., Cusicanqui, J., Taboada, C. and Vacher, J. (2008) Could Deficit Irrigation Be a Sustainable Practice for Quinoa (Chenopodium quinoa Willd.) in the Southern Bolivian Altiplano? Agricultural Water Management, 95, 909-917. http://dx.doi.org/10.1016/j.agwat.2008.02.012
[31] Singh, B. and Bhumbla, D.R. (1968) Effect of Quality of Irrigation Water on Soil Properties. Journal of Research Punjab Agricultural University, 5, 166-172.
[32] Patel, N. and Rajput, T.B.S. (2007) Effect of Drip Tape Placement Depth and Irrigation Level on Yield of Potato.
Agricultural Water Management, 88, 209-223. http://dx.doi.org/10.1016/j.agwat.2006.10.017
[33] Schjoerring, J.K. (1995) Nitrogen Incorporation and Remobilization in Different Shoot Components of Field-Grown Winter Oilseed Rape (Brassica napus L.) as Affected by Rate of Nitrogen Application and Irrigation. Plant and Soil, 177, 255-264. http://dx.doi.org/10.1007/BF00010132
[34] Kang, Y., Wang, F.X., Liu, H.J. and Yuan, B.Z. (2004) Potato Evapotranspiration and Yield under Different Drip Irri-gation Regimes. Irrigation Science, 23, 133-143. http://dx.doi.org/10.1007/s00271-004-0101-2
[35] Hamdy, A. and Samti, H. (1995) Interaction salinité-fertilisation et son effet sur la production de la pomme de terre.
Proceedings of Workshop on Farm Sustainable Use of Saline Water in Irrigation: Mediterranean Experiences, Ham-mamet, 5-8 October 1995, a9.1-a9.24.
[36] Kashyap, P.S. and Panda, R.K. (2003) Effect of Irrigation Scheduling on Potato Crop Parameters under Water Stressed Conditions. Agricultural Water Management, 59, 49-66. http://dx.doi.org/10.1016/S0378-3774(02)00110-5
[37] Kirnak, H., Higgs, D., Kaya, C. and Tas, I. (2005) Effects of Irrigation and Nitrogen Rates on Growth, Yield, and Quality of Muskmelon in Semiarid Regions. Journal of Plant Nutrition, 28, 621-638.
http://dx.doi.org/10.1081/PLN-200052635
[38] Aujla, M.S., Thind, H.S. and Buttar, G.S. (2007) Fruit Yield and Water Use Efficiency of Egg-Plant (Solanum melon-gema L.) as Influenced by Different Quantities of Nitrogen and Water Applied through Drip and Furrow Irrigation.