© 2017, IRJET | Impact Factor value: 5.181 | ISO 9001:2008 Certified Journal
| Page 808
Study of elastic properties of RC beam under Static Load
Khushaboo
1Imran Alam
21
Student of department of structural Engineering of Integral University
2
Assistant professor dept. of Civil Engineering of integral University
---***---ABSTRACT-
In structure analysis, especially in indeterminate structures, it becomes essential to know material and geometrical properties of members. The codal provisions recommend elastic properties of concrete and steel and are fairly accurate enough. As per the current I.S 456-2000 codal provisions, modulus of elasticity of concrete is expressed as a function of grade of concrete. Also while performing analysis by any software for high rise building; cross area of plain concrete is taken into consideration whereas effects of reinforcement bars and concrete confined by stirrups are neglected. But, modulus of elasticity of concrete depends upon the percentage of reinforcement, and the spacing of stirrups, Depth of beam, Deflection at end of beam. The aim of this study is to determine Modulus of Elasticity of Reinforced Concrete by non-linear Finite Element Analysis (model size 300 x 500 x 6000 mm) with different grades of concrete (M20, M25, M30) with change percent of compression reinforced using ANSYS.Keywords-Reinforced Concrete Beam, Modulus of Elasticity, Finite Element analysis, ANSYS 14.0.
1. INTRODUCTION
Reinforced concrete is one of the most important building materials and is widely used in many types of structures. The economy, the efficiency, the strength and the
stiffness of reinforced concrete make it an attractive material for a wide range of
structural applications. The ultimate objective of the designer is to create a structure that is safe and economical. The safety and serviceability assessment of the structures necessitate the development of accurate and reliable methods and models for their analysis. The rise in cost of materials used in structures and labour costs encourage engineers to seek more economical alternative designs often resorting to innovative construction methods but without lowering the safety of the structure. In addition, the extent and impact of disaster in terms of
human and economical loss in the event of structural failure promote designers to check the
design thoroughly. The development of numerical models for the analysis of the response of RC structures is complicated due to following reasons.
a) Reinforced concrete is a composite material made up of concrete and steel, two materials with very different physical and mechanical behavior;
b) Concrete exhibits nonlinear behavior even under low level loading due to nonlinear material behavior, environmental effects, cracking, biaxial stiffening and strain softening;
c) Reinforcing steel and concrete interact in a complex way through bond-slip and aggregate interlock
These complex phenomena have led engineers in the past to really heavily on empirical formulas for the design of concrete structures, which were derived from numerous experiments. With the advent of digital computers and powerful methods of analysis, much effort to develop analytical solutions which would obviate the need for experiments have been under taken by investigators.
2. METHODOLOGY
For the purpose of study the following specification is made for Doubly Reinforced section.
(A) Beam Size –the width and depth of the beam is 300mm and 500mmrespectively.
(B) Span Length –6000mm
(C) Grade of Concrete –M20, M25, M30.
(D) Grade of Steel –Fe 415 for all group specimen (E) Percentage of Steel– 0.34%, 0.47%, 0.54%, 0.60%
and 0.743% are taken.
(F) Shear Reinforcement –2 legged 8mm dia. Bar
(G) Spacing of strriups–
© 2017, IRJET | Impact Factor value: 5.181 | ISO 9001:2008 Certified Journal
| Page 809
2.1 Finite Element Modelling of ReinforcedConcrete Beam:
Finite Element Analysis (FEA) represents a numerical method, which provides solution to problems that would otherwise be difficult to obtain. It is an effective method of determining the static performance of structures for three reasons which are saving in design time, cost effective in construction and increase the safety of the structure. The analysis of a structure with ANSYS is performed in three stages.
a) Pre-processing P –defining the finite element model and environmental factors to be applied to it.
b) Analysis solver –solution of finite element model. c) Post-processing of results like deformations contours for displacement, etc., using visualization tools.
2.2 Element type used in Finite Element Model
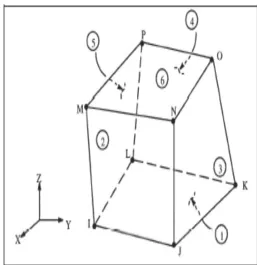
(a) Reinforced concrete -The solid 65 element was used to model the concrete. This element has 8 nodes with 3degree of freedom at each node –translations in the nodal x, y, and z-directions. This element is capable of plastic deformation, cracking in three orthogonal direction, and crushing.
[image:2.612.323.580.97.362.2](b) Steel reinforcement –To model concrete reinforcing, one of two methods is following followed. In the first method, the reinforcing is simulated as spar element with geometric properties similar to the original reinforcing. These elements can directly be generated from the nodes in the model. This method of discretization is useful in simple concrete models. The second method of steel reinforcing is the smeared concrete element method. Cracks can also be analysed into either the discrete type or smeared type. Link 180 element is used to model steel reinforcement in this paper. This element is a 3D spar element. It has three nodes with two degrees of freedom – translations in the nodal x, y, and z-directions being also capable of plastic deformation.
Fig 2.1 Solid 65 - 3D reinforced concrete solid element
Fig 2.2 Link 180 element
[image:2.612.323.577.403.586.2]© 2017, IRJET | Impact Factor value: 5.181 | ISO 9001:2008 Certified Journal
| Page 810
2.4 Modelling of the Beam–The beam can be modelledusing solid 65 and link 180.
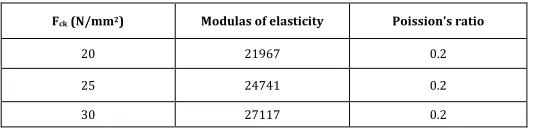
(a) Material Properties–Two material models are given: material 1 for concrete and material 2 for steel. Solid65 element requires linear and multi-linear isotropic material properties to properly model concrete.
[image:3.612.30.297.227.291.2]For material model 1
Table 1 Linear Isotropic Properties
Fck (N/mm2) Modulas of elasticity Poission’s ratio
20 21967 0.2
25 24741 0.2
30 27117 0.2
[image:3.612.323.586.242.633.2]Multi-linear isotropic properties-In the present numerical analysis, the uniaxial behaviour of concrete was modelled by the numerical expression proposed by Desayi and Krishnan [1965] incorporating the modification proposed by Gere and Timoshenko [1997].
Table 2 Stress-strain input data for different grade of concrete
Points M 20 M 25 M 30
Strain Stress Strain Stress Strain Stress
1. .000183 4.02 .0002031 5.025 0.000222 6.02
2. .000275 6.01 .00035 8.489 .000275 7.414
3. .0005 10.37 .0005 11.765 .0005 13.015
4. .001 17.04 .001 20 .001 22.661
5. .0012 18.51 .0012 22.059 .0012 25.275
6. .0014 19.42 .0014 23.489 .0014 27.217
7. .0016 19.89 .0016 24.39 .0016 28.569
8. .0018 20 .0018 24.86 .0018 29.42
9. .002 20 .002 25 .002 29.865
10. .0035 20 .0035 25 .0035 30
Open shear transfer co-efficient = 0.3 Closed shear transfer co-efficient = 1 Uniaxial cracking strength = 3.13 N/mm2
Uniaxial crushing strength = 20 N/mm2
For material model 2 Linear isotropic properties
Modulus of elasticity EX –200000 N/mm2
Poisson”s ratio PRXY –0.3 Bilinear isotropic
Yield stress –415 N/mm2
Tangent modulus-20 N/mm2
Fig 2.3 element connectivity in FE model
Fig 2.4 FE model of beam specimen
[image:3.612.36.318.409.740.2]© 2017, IRJET | Impact Factor value: 5.181 | ISO 9001:2008 Certified Journal
| Page 811
2.6 Finite Element Discretization- The model is dividedinto a no. of small elements, and after loading stress and strain is calculated at integration points of these small elements.
2.7 Nonlinear Solution- In nonlinear solution, the total load applied to a finite element model is divided into a series of load increment called load steps. The ANSYS program uses Newton-Raphson equilibrium iterations for updating the model stiffness. In this study, for the reinforced concrete solid elements, convergence criteria is based on force and displacement, and the convergence tolerance limits is initially selected by the ANSYS program. It is found that convergence of solutions for the models is difficult to achieve due to the nonlinear behaviour of reinforced concrete. Therefore, the convergence tolerance limits is increased to a maximum of 5 times the default tolerance limits(0.5 % for force checking and 5% for displacement checking) in order to obtain convergence of the solutions.
2.8 Load Stepping and Failure Definition for FE Models- For the nonlinear analysis, automatic time stepping in the ANSYS program predicts and controls load step sizes. Based on the previous solution history and the physics of the models, if the convergence behaviour is smooth, automatic time stepping will increase the load increment up to a selected maximum load step size. If the convergence behaviour is abrupt, automatic time stepping bisect the load increment until it is equal to a selected minimum load step size. The maximum and minimum load step sizes are required for the automatic time stepping.
III. FINITE ELEMENT ANALYSIS
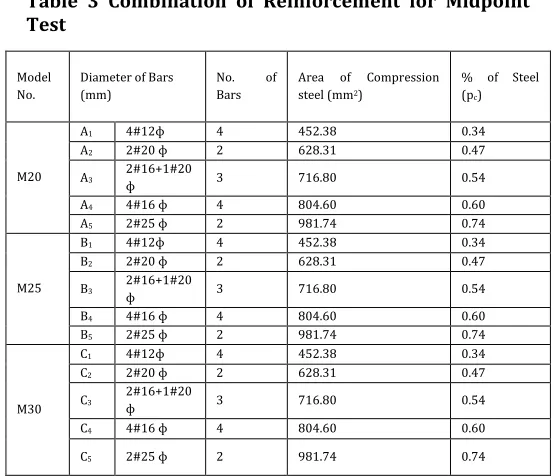
For the analysis of the RC beam, six combinations of different diameter of bars and 4 different spacing in shear strrips are used in compression reinforcement. The five models of M20, M25 and M30 grade of concrete with percentage of reinforcement varying from 0.34 to 0.74% are presented.
Table 3 Combination of Reinforcement for Midpoint Test
Model No.
Diameter of Bars (mm)
No. of Bars
Area of Compression steel (mm2)
% of Steel (pc)
M20
A1 4#12ɸ 4 452.38 0.34
A2 2#20 ɸ 2 628.31 0.47
A3 2#16+1#20 ɸ 3 716.80 0.54
A4 4#16 ɸ 4 804.60 0.60
A5 2#25 ɸ 2 981.74 0.74
M25
B1 4#12ɸ 4 452.38 0.34
B2 2#20 ɸ 2 628.31 0.47
B3 2#16+1#20
ɸ 3 716.80 0.54 B4 4#16 ɸ 4 804.60 0.60
B5 2#25 ɸ 2 981.74 0.74
M30
C1 4#12ɸ 4 452.38 0.34
C2 2#20 ɸ 2 628.31 0.47
C3 2#16+1#20 ɸ 3 716.80 0.54
C4 4#16 ɸ 4 804.60 0.60
C5 2#25 ɸ 2 981.74 0.74
Table 5 Combination of Reinforcement for two point test
Model No.
Diameter of Bars
(mm) No. of Bars
Area of Compression steel (mm2)
% of Steel (pc)
M20
D1 4#12ɸ 4 452.38 0.34
D2 2#20 ɸ 2 628.31 0.47
D3 2#16+1#20 ɸ 3 716.80 0.54
D4 4#16 ɸ 4 804.60 0.60
D5 2#25 ɸ 2 981.74 0.74
M25
E1 4#12ɸ 4 452.38 0.34
E2 2#20 ɸ 2 628.31 0.47
E3 2#16+1#20 ɸ 3 716.80 0.54
E4 4#16 ɸ 4 804.60 0.60
E5 2#25 ɸ 2 981.74 0.74
M30
F1 4#12ɸ 4 452.38 0.34
F2 2#20 ɸ 2 628.31 0.47
F3 2#16+1#20 ɸ 3 716.80 0.54
F4 4#16 ɸ 4 804.60 0.60
[image:4.612.311.588.105.343.2] [image:4.612.327.565.400.623.2]© 2017, IRJET | Impact Factor value: 5.181 | ISO 9001:2008 Certified Journal
| Page 812
Table 4.Combination of spacingSpacing M20 M25 M30
250 G1 H1 I1
200 G2 H2 I2
150 G3 H3 I3
100 G4 H4 I4
V. ANALYSIS OF THE MODELS
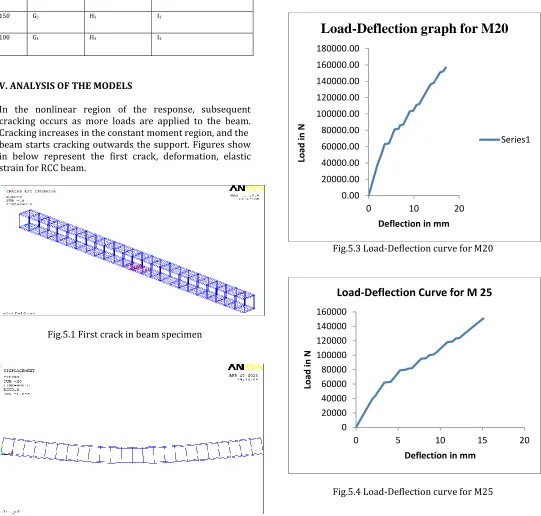
In the nonlinear region of the response, subsequent cracking occurs as more loads are applied to the beam. Cracking increases in the constant moment region, and the beam starts cracking outwards the support. Figures show in below represent the first crack, deformation, elastic strain for RCC beam.
Fig.5.1 First crack in beam specimen
Fig.5.2 deflection in beam specimen
[image:5.612.37.578.176.692.2]Figures represent load deflection curve for RCC beam specimen of different grade of concrete. In these specimens, because of reinforcement, the load at elastic limit as well as the failure load was observed higher. The deflections measured for all the specimens.
Fig.5.3 Load-Deflection curve for M20
Fig.5.4 Load-Deflection curve for M25
0.00 20000.00 40000.00 60000.00 80000.00 100000.00 120000.00 140000.00 160000.00 180000.00
0 10 20
Load
in
N
Deflection in mm
Load-Deflection graph for M20
Series1
0 20000 40000 60000 80000 100000 120000 140000 160000
0 5 10 15 20
Load
in
N
[image:5.612.330.578.195.418.2]© 2017, IRJET | Impact Factor value: 5.181 | ISO 9001:2008 Certified Journal
| Page 813
Fig.5.5 Load-Deflection curve for M304.1 EVALUATION OF ‘E’ OF RC BEAM FOR DIFFERENT GRADE OF CONCRETE
1.For a beam subjected to mid-point loading the deflection formula is as follows:
2. For a beam subjected to two- point loading the deflection formula is as follows:
Where w is self-weight of beam in N/mm and W is the load at failure in N. The value of deflection is substituted in the above equations for each case. By substituting proper values of w, W, l, and I, the remaining unknown value i.e., E is evaluated.
The value of W substituted in this expression is corresponding to first crack.
Table 5.1 Percentage of steel and corresponding E value of reinforced concrete for RCC (M20)
Model no. Load (N) Deflectio n (mm)
% of
pc
Modulus of Elasticity(N/m m2) A1 5.92*104 3.30622 79092.0 0.340 79092.0
A2 5.94*104 3.22758 81202.6 0.475 81202.6
A3 5.96*104 2.97069 82033.2 0.542 82033.2
A4 6.01*104 2.87563 83844.3 0.609 83844.3
A5 6.06*104 2.51026 84078.2 0.743 84078.2
Table 5.2 Percentage of steel and corresponding E value of reinforced concrete for RCC (M25)
Model no. Load (N) Deflecti on (mm)
% of pc
Modulus of Elasticity(N/m m2)
B1 5.54*104 2.65435 91506.8
0.340 91506.8
B2 5.55*104 2.72547 92841.3
0.475 92841.3
B3 5.60*104 2.77352 94069.6
0.542 94069.6
B4 5.70*104 2.81619 94229.8
0.609 94229.8
B5 5.80*104 2.86656 95018.3
0.743 95018.3
Table 5.3 Percentage of steel and corresponding E value of reinforced concrete for RCC (M30)
Model no. Load (N) Deflecti on (mm)
% of pc
Modulus of Elasticity(N/m m2)
C1
5.20*1
04 2.50645 102047.6 0.340 102047.6
C2
5.40*1
04 2.51913 102805.8 0.475 102805.8
C3
5.40*1
04 2.54009 102948.4 0.542 102948.4
C4
5.50*1
04 2.56861 103807.6 0.609 103807.6
C5
5.70*1
04 2.58780 104038.2 0.743 104038.2
0 20000 40000 60000 80000 100000 120000 140000
0 5 10 15
Load
in
N
© 2017, IRJET | Impact Factor value: 5.181 | ISO 9001:2008 Certified Journal
| Page 814
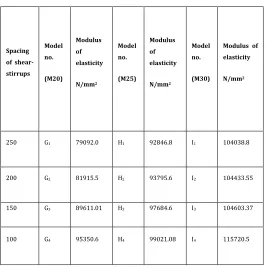
Table 5.4 Corresponding E value of beam for differentspacing of confinement
Spacing of shear-stirrups Model no. (M20) Modulus of elasticity N/mm2 Model no. (M25) Modulus of elasticity N/mm2 Model no. (M30)
Modulus of elasticity
N/mm2
250 G1 79092.0 H1 92846.8 I1 104038.8
200 G2 81915.5 H2 93795.6 I2 104433.55
150 G3 89611.01 H3 97684.6 I3 104603.37
100 G4 95350.6 H4 99021.08 I4 115720.5
Beam subjected to two- point loading the deflection formula is as follows:
Table 5.5 Percentage of steel and corresponding E value of reinforced concrete for RC(M20)
Model no. Load (N) Deflecti on mm
% of pc
Modulus of Elasticity
(N/mm2)
D1 8.80*104 3.5329 70964.7
0.340 70964.7
D2 8.80*104 3.6009 71007.5
0.475 71007.5
D3 8.50*104 3.4320 71193.4
0.542 71193.4
D4 8.40*104 3.5286 72619.4
0.609 72619.4
D5 9.20*104 3.6336 74017.3
0.743 74017.3
Table 5.6Percentage of steel and corresponding E value of reinforced concrete for RCC (M25)
Model no. Load (N) Deflecti on (mm)
% of pc
Modulus of Elasticity(N/m m2)
E1 8.1*104 2.8844 81617.7
0.340 81617.7
E2 8.1*104 2.8885 82947.1
0.475 82947.1
E3 8.1*104 2.8017 83165.4
0.542 83165.4
E4 7.90*104 2.8136 85302.3
0.609 85302.3
E5 8.20*104 2.8710 85562.2
0.743 85562.2
Table 5.7 Percentage of steel and corresponding E value of reinforced concrete for RCC (M30)
Model no. Load (N) Deflecti on (mm)
% of pc
Modulus of Elasticity(N/m m2)
F1 8.1*104 2.8844 90671.1
0.340 90671.1
F2 8.1*104 2.8848 92001.6
0.475 92001.6
F3 8.1*104 2.8917 93333.4
0.542 93333.4
F4 8.1*104 2.9136 96362.7
0.609 96362.7
F5 8.20*104 2.9710 97080.4
[image:7.612.30.589.487.743.2]© 2017, IRJET | Impact Factor value: 5.181 | ISO 9001:2008 Certified Journal
| Page 815
V. CONCLUSION1. It has been observed from the above result that the Modulus of Elasticity for RCC is more than the Modulus of Elasticity of PCC and hence deformations are expected to be on lower side.
2. It has been found from the result that Modulus of Elasticity of RCC beam in increase with the increase in percent of compression reinforcement for all grade of concrete (M20, M25, M30) under midpoint loading test.
3. It has been found that the Modulus of Elasticity of beam specimens increase with the increase in percentage of compression reinforcement for all grade of concrete (M20, M25, M30) under two-point loading test.
4. Further, It has been found that the increase in percentage of steel reinforcement increases the the modulus of elasticity of beam specimen increase with the spacing of shear stirrups increase for all grade (M20, M25 & M30) for mid-point loading of simply supported beams.
6.2 SCOPE FOR FUTURE WORK
Additional work may be undertaken in the determination of modulus of elasticity:
1. Analysis can be carried out for higher grades of concrete (i.e. M35, M40 and M45) in order to obtain the Modulus of Elasticity on wider scale.
2. Analysis can also be extended for different depth of beam specimens.
3. Further the boundary conditions of the beam can also be varied.
References
1.S. K. Kulkarni, M. R. Shiyekar, B. Wagh, Elastic Properties of RCC under Flexural Loading.International Journal of Modern Engineering Research (IJMER) www.ijmer.com Vol.2, Issue.6, Nov-Dec. 2012 pp-4022-4025 ISSN: 2249-6645
2.Kulkarnis.k., shiyekarm.r. and wagh b, elastic properties of rcc under flexural loading-fe approach, World Research Journal of Civil Engineering ISSN: 2277-5986 & E-ISSN: 2277-5994, Volume 2, Issue 1, 2012
3.Mohammad Al Amin Siddique, effect of material properties on ductility of reinforced concrete beams. Journal - The Institution of Engineers, Malaysia (Vol. 67, No. 3, September 2006)
4.M. Al Amin Siddique and Md. AbdurRouf. Effect of material properties on behavior of over-reinforced concrete beams Asian journal of civil engineering (building and housing) vol. 7, no. 2 (2006) pages 195-204.
5.Mithaq A. Louis. Non-Linear Analysis of Beams on Elastic Foundation by Finite Element Method. Journal of Engineering and Development, Vol. 10, No.1, March (2006) ISSN 1813-7822.
6.SatyaPrakash, Mohd. Kashif Khan, Imran Alam, Rajiv Banerjee, Study of Modulus of Elasticity of RC Beam under Flexural Loading using ANSYS. International Journal of Scientific & Engineering Research, Volume 7, Issue 3, March-2016 ISSN 2229-5518
7.L. Dahmani, A. Khennane, and S. Kaci, Crack Identification in Reinforced Concrete Beams Using ANSYS Software. L. Dahmani, a. Khennane, s. Kaci, 2010 issn 0556-171x