Classification of Mass in Breast Ultrasound Images
using Image Processing Techniques
Minavathi
Mysore University PET Research centre, MandyaKarnataka, India
Murali. S
Mysore UniversityMIT, Mysore Karnataka, India
M.S. Dinesh
Mysore University PET Research centre, MandyaKarnataka, India
ABSTRACT
This work presents a new approach for classifying masses in breast ultrasound images. Detection and classification of masses in ultrasound images still remains a challenge because most of the ultrasound images contain speckle noise and fuzzy boundaries. Ultrasound (US) is an important adjunct to mammography in breast cancer detection as it increases the rate of detection in dense breasts. Ultrasound also does dynamic analysis of moving structures in breast thus it is used to analyze the functional behavior of breast. In the proposed method, ultrasound images are preprocessed using Gaussian smoothing to remove additive noise and anisotropic diffusion filters to remove multiplicative noise (speckle noise). Active contour method has been used to extract a closed contour of filtered image which is the boundary of the spiculated mass. Spiculations which make breast mass unstructured or irregular are marked by measuring the angle of curvature of each pixel at the boundary of mass. To classify the breast mass as malignant or benign we have used: the structure of mass in accordance with spiculations, elliptical shape of the mass and acoustic shadowing feature which is an important functional feature. We have used receiver operating characteristic curve (ROC) to evaluate the performance. We have validated the proposed algorithm on 100 sub images(40 spiculated and 60 non spiculated) and results shows 92.7% of sensitivity with 0.88 Area Under Curve. Proposed techniques were compared and contrasted with the existing methods and result demonstrates that proposed algorithm has successfully detected and classified mass ROI candidates in breast ultrasound images.
Keywords
Ultrasound, Mass, Gaussian filter, Mean and median filter, Angle of curvature, SVM.
1.
INTRODUCTION
Breast cancer is a most common and a life-threatening cancer. This has highest mortality rates of any women‟s cancer. It is the second leading cause of cancer deaths among women in United States and it is the leading cause of cancer deaths among women in the 40 – 55 age groups. Approximately 182,000 new cases of breast cancer are diagnosed and 46,000 women die of breast cancer each year in the United States. In 2009, about 40,610 women died from breast cancer in the United States. According to the recent statistics, one out of nine women will develop breast cancer during her lifetime [1, 2]. There is no effective way to prevent the occurrence of breast cancer. Therefore, early detection is the first crucial
step towards treating breast cancer. Mammography and ultrasonography are currently the most sensitive noninvasive modalities for detecting breast cancer. A panel report issued from Institute of Medicine and National research council of National Academics concurred that Mammography though useful wasn‟t always enough and health practitioners needed to investigate other complementary screening methods like ultrasound. It also says that mammography depicts about three to four cancers per 1000 women. But in women with dense breasts ultrasound depicts another three cancers per 1000 women [3]. In addition, mammography produces a high false positive rate, and only about 525 of 1800 lesions that were sent to biopsy are malignant. Mammography has limitations in cancer detection in the dense breast tissue of young patients. Most cancers arise in dense tissue, so lesion detection for women in this higher risk category is particularly challenging. The breast tissue of younger women tends to be dense and full of milk glands, making cancer detection with mammography problematic. In mammograms, glandular tissues look dense and white, much like cancerous tumor. The reasons for the high miss rate and low specificity in mammography are, low conspicuity of mammographic lesions, noisy nature of the images, overlying and underlying structures that obscure features of the mammographic images [4, 5]. The cancers found on ultrasound are almost all small invasive cancers that have not yet spread to the lymph nodes and therefore have good prognoses. Reports generated by screening process be interpreted and diagnosed by relatively few radiologists. In order to improve the accuracy of interpretation, a variety of computer systems have been proposed.
diagnosis is heavily dependent on a doctor's personal experience.
Some of the important signs of breast cancer radiologists normally look for are: spiculated masses, micro calcifications, architectural distortions and bilateral asymmetry. Spiculated masses are characterized by radiating lines or spicules from a central mass of tissue. Spiculated masses carry a much higher risk of malignancy than calcifications or other types of masses. The performance figures for the leading mass detection algorithms are not as good as those for microcalcification detection algorithms [7]. Masses appear as ill-defined local increases in brightness, are highly variable in appearance, and share many characteristics with normal background tissue. Almost 50% of malignant masses are, however, characterized by a radial pattern of linear structures known as spicules [7,8]. In this paper, we present a computational technique that detects the spiculations in masses in ultrasound images.
2.
LITERATURE
The literature directly relevant to the proposed research, are highlighted here. Abdul Kadir[9] presented the application of Snake for the segmentation of masses on breast ultrasound images. The boundaries of the masses identified may be used in classification of cancers or non-cancerous masses. They have attempted to segment masses on the breast ultrasound images using Balloon Snake by combining the mathematical optimization conception together with the computer technology. The accuracy of segmentation results was 95.53%. Yan and Toshihiro [10] proposed segmentation scheme using fuzzy c-means (FCM) clustering incorporating both intensity and texture information of images is proposed to extract breast lesions in ultrasound images. The proposed spatial FCM is more tolerant to noise than the conventional one. Based on the speckle texture and image intensity, it copes with the speckle noise and fuzziness of boundaries in ultrasound images. The low-level segmentation techniques are known to be fast and simple, but these methods simply analyze an image by reducing the amount of data to be processed. This problem can result in loss of important information. Moreover, the low-level segmentation techniques may incorrectly identify region or boundary of an object due to the distraction of noise in an image. The boundary of the abnormality should be identified accurately so that all of the important information required by the radiologist from the object such as shape, margin, and area can be determined. In order for the image to be interpreted accurately, the image must be segmented accurately into regions that correspond to objects or parts of an object. The iterative algorithm namely active contours were proven to be the effective high level techniques in line and edge detection, image segmentation,
shape modeling, and motion tracking as claimed through research carried out by Kass [11].
Cheng and Itoh [12] proposed a novel method for the automated detection of breast tumors in three dimensional ultrasonic images using fuzzy reasoning. 10 cases of malignant and 10 cases benign tumors are successfully extracted by the proposed method. Horsch [13] presented a method which involved thresholding a preprocessed image that has enhanced mass structures. Madabhushi and Metaxas [14] combined intensity, texture information, and empirical domain knowledge used by radiologists with a deformable shape model in an attempt to limit the effects of shadowing and false positives. Their method requires training but in the small database. They showed that their method is independent of the number of training samples, shows good reproducibility
74.7%. Yuji Ikedo and Daisuke [15] proposed a scheme for mass detection in whole breast ultrasound images using bilateral subtraction technique based on a comparison of the average gray values of a mass candidate region and a region with the same position and same size as the candidate region in the contra lateral breast. The sensitivity was 83% (5/6) with 13.8 (165/12) false positives per breast before applying the proposed reduction method. By applying the method, false positives were reduced to 4.5 (54/12) per breast without removing a true positive region.
Dar and Chang [16] in their research used morphology operation, histogram equalization, and fractal analysis for classifying ultrasound images. The fractal analysis is applied to obtain the fractal texture features to classify the test cases of masses into benign and malignant. The accuracy rate was up to 88.80%.
Yuji and Takako [18] proposed a computerized classification scheme to recognize breast parenchyma patterns in whole breast ultrasound (US) images. They employed Canonical discriminant analysis with stepwise feature selection for the classification of parenchymal patterns. The classification scheme resulted in the accuracy of 83.3% (10/12cases) in mottled pattern cases. Ruey-Feng and Wen-Jie [19] worked on segmenting the tumors in ultrasound images using the newly developed level set method at first and then six morphologic features are used to distinguish the benign and malignant cases. In the experiment, the accuracy of SVM with shape information for classifying malignancies was 90.95% (191/210) and the sensitivity was seen to be 88.89% (80/90). It is clearly understood from the literature that the works in medical image processing are not trying to substitute the appreciation of the physicians or radiologist, but they are trying to introduce the approaches in order to improve the diagnosis by giving second opinion to the radiologist. This will hopefully reduce the rate of biopsy. In a way to overcome the shortcomings of existing works and to improve the sensitivity we are proposing a method to classify spiculated masses in ultrasound images by retrieving distinctive and discriminative features.
3.
MATERIAL AND METHODS
[image:2.595.342.483.584.721.2]In this paper, we have used 100 US images (40 Spiculated mass and 60 non spiculated). For each image, a rectangular ROI including the tumor and the area around it were determined by an experienced radiologist. The radiologist also depicted tumor contours and has classified them as regular or irregular. We aim at early detection of breast cancer by detecting the sites of spiculations in ROI of ultrasound images.
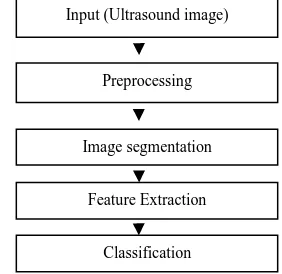
Fig. 1: Flow diagram showing the overall methodology Input (Ultrasound image)
Preprocessing
Image segmentation
Feature Extraction
The organization of this paper is as follows: Preprocessing, Image segmentation, Feature extraction, Classification, Results and finally the Concluding remarks and future work.
3.1
Preprocessing
Biomedical images are normally affected by various types of noise. Removal of these noises without destroying the desired information is often a significant challenge. Ultrasound medical imaging uses low-power, high frequency sound waves to visualize the body‟s internal structures and they are regarded as a noninvasive, practically harmless, portable, accurate, and cost effective method for diagnosis. Image data are generally contaminated by noise. Noise occurs in images for many reasons including imperfect instruments, problems with the data acquisition process, and interfering natural phenomena. It is necessary to apply an efficient denoising technique to compensate for such data corruption. Unfortunately, the quality (resolution and contrast) of ultrasound image is generally degraded due to the existence of Gaussian noise and speckle noise. In our preprocessing steps we have removed additive (Gaussian) noise using Gaussian smoothing. Anisotropic diffusion method is used to reduce multiplicative (speckle) noise. Anisotropic diffusion filter can get rid of major drawback of conventional special filters and improve the image quality significantly and can preserve important boundary information.
Gaussian smoothing is widely used to reduce image noise
.
Blurring an image is same as convolving the image with a Gaussian function. Since the Fourier transform of a Gaussian is another Gaussian, applying a Gaussian blur has the effect of reducing the high-frequency components of image. A Gaussian blur is thus a low pass filter. Breast ultrasound images have low contrast and some degree of fuzziness such as indistinct cyst borders, ill-defined mass shapes, and different tumor densities. Anisotropic diffusion reduces the speckle noise and also blurs the image without compromising with the image quality. The main idea in anisotropic diffusion is to smooth the homogenous areas of the image while enhancing the edges. This creates a piecewise constant image from which the segmentation boundaries can be easily obtained. Perona and Malik [10] first proposed anisotropic diffusion. They apply an inhomogeneous process that reduces the diffusivity at those locations which have a larger likelihood to be edges. Following is the nonlinear partial differential equation used for smoothing image on a continuous domain:𝜕𝐼
𝜕𝑡= 𝑑𝑖𝑣[𝑐( 𝛻𝐼 ) − ∇𝐼]
I(t=0)=I0 (1)
Where is the gradient operator, div the divergence operator, denotes the magnitude, c(x) the diffusion coefficient, and I0
the initial image. Two diffusion coefficients are:
𝑐 𝑥 =1+(𝑥 𝑘)1 2 (2)
and
𝑐 𝑥 = 𝑒[−(𝑥 𝑘)2] (3)
Where k is an edge magnitude parameter (acts as an edge strength threshold). Gradient magnitude is used to detect an image edge or boundary as a step discontinuity in intensity. If 𝛻𝐼 > k, 𝑐( 𝛻𝐼 ) 0 we have an all-pass
filter If 𝛻𝐼 < k, 𝑐( 𝛻𝐼 ) 1 we achieve isotropic
diffusion (Gaussian filtering).
Diffusion model provides different degrees of smoothing for intra-regions. It also provides different degrees of sharpening for edges in inter-regions. The resulting images will preserve linear structures of the image. Anisotropic diffusion is an iterative process where a relatively simple set of computation are used to compute each successive image in the family and this process is continued until a sufficient degree of smoothing is obtained. In our work we have considered 15 iterations to obtain the enhanced image. Later the preprocessed image is used for segmentation process. Segmentation remains a necessary step in medical imaging to obtain qualitative measurements such as the location of objects of interest as well as for quantitative measurements such as area, volume or the analysis of dynamic behavior of anatomical structures over time.
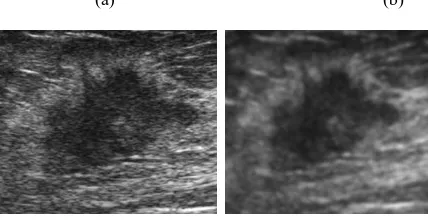
(a) (b)
Fig. 2: (a) Original ROI of ultrasound with spiculated Mass, (b) Image after Preprocessing
3.2
Image Segmentation
Segmentation is a necessary step in medical imaging to obtain qualitative measurements such as the location of objects of interest as well as for quantitative measurements such as area, volume or the analysis of dynamic behavior of anatomical structures over time. There are four layers in US image: skin, subcutaneous tissue, mammary gland and muscle as shown in “Fig. (3)”. The boundaries between these layers are quite blurry. The mammary gland region is located between the subcutaneous tissues and muscle layers, which are characterized as a line-like area with high gray levels. The regions with high gray levels are known as layers of subcutaneous tissues and the chest muscle.
Active contours were proven to be the effective high level techniques in edge detection and image segmentation. In this method, a curve is evolved towards the object boundary under a force, until it stops at the boundary. In the classical active contour methods, the curve moves to minimize the energy,
𝜀 𝑙 =
(12𝛼 𝑙′ 𝑠 +1
2𝛽 𝑙" 𝑠 − 𝜆 ∇𝐼(𝑥, 𝑦)(𝑙(𝑠)) 2)
𝑙 𝑑𝑠 (4)
[image:3.595.322.537.338.448.2]Fig. 3: Breast structure in Ultrasound images
I(x, y) is the image gray-level function, and constants α, β, λ > 0. The first two terms in the energy functional smooth the curve. The third term attracts the curve to the object boundary, where the value of image gradient is large. The dynamics of the curve is given by the Euler-Lagrange equation,
𝑙𝑡 𝑠 = 𝛼𝑙" 𝑠 − 𝛽𝑙"" 𝑠 + 𝜆∇ ∇𝐼(𝑥, 𝑦)(𝑙(𝑠)) 2 (5)
Later, a constant force normally called as balloon force was added in the normal direction of the curve to accelerate the motion of the curve and to increase the capture range. The level set framework was used to handle the topological changes such as merging or splitting of the moving curve. The dynamic equation can be summarized as,
∅𝑡= 𝑔 ∇𝐼(𝑥, 𝑦) (∇ ∙ ∇∇∅
∅ + 𝑣) ∇∅ (6)
Where ∅ 𝑥, 𝑦 is the level set function whose zero level set represents the curve. The terms before ∇∅ form the velocity of the curve in its normal direction. The first term in the bracket is the effect of the curvature of the curve, which smoothes and shortens the curve. The second term in the bracket is a constant ν, which corresponds to the balloon force mentioned above, making the curve expand or shrink depending on its sign. The function g (∇I(x, y)) is chosen such that it is very small at the boundary, where the value of image gradient is large, so that the velocity of the curve is small and the curve will stop there. One choice of g (∇I(x, y)) is :
𝑔 ∇𝐼 𝑥, 𝑦 = 1+ ∇𝐺𝜎 𝑥,𝑦 ∗𝐼 𝑥,𝑦 𝑝 1 (7)
where p ≥ 1
[image:4.595.98.237.72.210.2]There are some modifications to the level set formulation which is stated in the Eq. (6). Rewriting the right-hand-side as the minimization of an energy which gives some additional terms to attract the curve to the boundary from its both sides. However, for these methods, without the balloon force, the capture range is short and the curve cannot reach the narrow concave parts of the boundary. This is because the effect of the term (x, y), in the Eq. (5) or the effect of term g(∇I(x, y)) in Eq. (6), is localized near the boundary. By applying active contour on ROI of ultrasound which contains mass or spiculated mass we get the boundary of mass as shown in “Fig. (4)”. Once the boundary is segmented out our next step is to retrieve features from the segmented region.
Fig. 4: ROI after segmentation
3.1
Feature Extraction
A key stage of mass detection and classification is feature analysis and extraction. Several features might be derived from an image. But not all of the features are suitable for classification. Too many irrelevant features not only make the classifier complicated, but also will reduce the accuracy of the classification. The most important issue is to select features that are able to represent the characteristics of spiculated masses in the breast ultrasound images. Spiculations are the small needlelike structures found in malignant mass which shows uncontrollable multiplication of breast cells. These spiculations will make the breast masses unstructured and irregular.
3.1.1
Spiculation Feature
First and most distinctive feature that we have retrieved from ultrasound images are spiculation feature of mass by finding angle of curvature at each pixel of contour. As a second feature we consider shape of the mass because it is clear from the literature that most of the benign masses tend to be wider and roughly ellipse. Based on these features the spiculated malignant mass can be significantly discriminated from the benign masses by the classifier. In breast ultrasound images, spiculations and angular margins are the significant characteristics. Spiculations produce the higher positive predictive value of malignancy. Also, the hyperechogenicity, well-circumscribed lobulation, ellipsoid shape and a thin capsule are the significant characteristics of benign masses in breast ultrasound images [27].
Based on the characteristics of the breast ultrasound image, we first detect the presence of spiculations in the segmented image. We start by clearing the unwanted structures in the segmented image. The angle of curvature of every pixel at that boundary of the ROI is considered. At every pixel the angle of curvature is found by projecting lines from that pixel to some appropriate pixels and the angle between the lines are found and is as shown in “Fig. (5)”.
Where ϕ=𝑡𝑎𝑛−1 1+𝑚𝑚2−𝑚1
1∗𝑚2
(8)
and 𝑚1= 𝑏−𝑦 𝑎−𝑥 , 𝑚2= 𝑑−𝑦 𝑐−𝑥
(9)
Fig. 5: Angle of curvature at pixel (x,y) found by projecting lines from that pixel
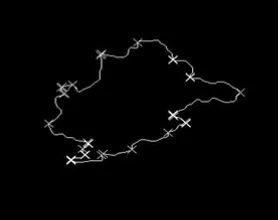
Fig. 6: ROI to which spiculations are marked with “x”
3.1.2
Shape Feature
Shape of the mass is one of the important feature that can be considered in ultrasound images. Because the proportion of width and height of the mass and also its ellipsoid shape are considered to classify the mass as benign or malignant. A mass with ellipsoidal shape which is shown in “Fig 7(a)” will increases the probability of mass being benign. Most of the malignant masses will normally produce projections from the surface of the mass which extend towards nipple, thus they will be taller than wider as shown in “Fig. 7(b)”.
(a) (b)
Fig. 7: (a) Mass with elliptical shape (benign), (b) Mass which is taller than wider (malignant)
Consider the contour of mass which is already retrieved in previous section. Let (c1,c1) be the centroid of mass contour with the maximum path passing the point (c1,c1) is considered to be the major axis „a‟ and the minimum path through (c1,c1) is considered as a minor axis „b‟. Angle between X-axis and major axis is considered to be „θ‟. Mathematically an ellipse may be specified as:
𝑥 𝑡 = 𝑐1 + 𝑎 cos 𝑡 cos 𝜃 − 𝑏 sin 𝑡 sin 𝜃 (10)
𝑦 𝑡 = 𝑐2 + 𝑏 sin 𝑡 cos 𝜃 + 𝑎 cos 𝑡 sin 𝜃 (11)
Where t is interval angle (0 < t < 2π)
The standard deviation of the shortest distance is the best fit of mass contour by an ellipse. Shortest distance can be defined as
𝑆(𝑖) = 𝐸𝑖𝐻𝑖 i=1,2,3,………N (12)
[image:5.595.98.238.225.335.2]Where N is number of pixels on mass contour
Fig. 8: Shows the shortest distance in the best fit ellipse. Point „‟X‟ in the centre is centroid of mass contour
Standard deviation of shortest distance is given by
𝑆𝐷 = 𝑁−11 𝑆 𝑖 −𝑁1 𝑁 𝑆(𝑖)
𝑖=1 2 𝑁
𝑖=1 (13)
3.1.3
Acoustic Shadow Feature
A mass is said to produce acoustic shadow if the ultrasound is attenuated when crossing through it. If a mass generates acoustic shadow it is considered as malignant. Images in Fig. 9 shows how a mass with and without acoustic shadow looks like.
(a) (b)
Fig. 9: (a) Mass without Acoustic shadow, (b) Mass with acoustic shadow.
By observing the images in “Fig.9”, it is clear that acoustic shadow can be determined by considering intensity as a main factor. To find whether mass has generated shadow or not, we first calculated the mean intensity of the region under the mass and compare it with the mean intensity of the region at the same level which is not covered by the mass.
4.
CLASSIFICATION
Out of various typical non-linear classifiers a popular representative neural architecture is considered for classifying mass as malignant or benign. The main task of the classifier is to categorize the ROI by considering the shape, shadow and spiculated features which are discussed in the previous section. The process of classification has two phases: training phase and testing phase. In training phase data set which is labeled as benign and malignant mass are given to classifier and the classifier is trained. Where as in testing phase, unknown data are given to classifier for actual classification. Support Vector Machine (SVM) is a learning tool based on modern statistical learning method that classifies binary classes. SVM finds and uses class boundary hyper plane by maximizing the margin in training data. The training data
(x,y)
(a,b)
(c,d)
[image:5.595.323.534.382.493.2] [image:5.595.62.272.486.591.2]samples along the hyper planes near the class boundary are called support vectors. Using support vectors SVM finds adequate hyper plane to separate the groups. After separation cases belonging to one category remains in one side of the plane and other cases on the other side of the plane [24, 17]. The reason why SVM is selected for classification in our work is: SVM has good capacity of generalization, it is highly robust and work well with images, the theory of SVM is well defined and has a very good base of mathematics and statistics. Finally in SVM over training problem is less compared to other neural network classifiers.
There will be tradeoff between the sensitivity and specificity if we use a single feature as parameter to discriminate benign and malignant cases. The tradeoff is because each feature parameter is mainly related to its nature. So we have considered three main features: spiculated feature, acoustic shadow and elliptical shape feature for discrimination. SVM classifiers were evaluated using linear kernel, Polynomial kernel and Gaussian RBF kernels. We evaluated the performance of these features in classifying benign and malignant tumors by plotting the ROC and calculating the area under the ROC curve. The performance of SVM for 3 kernel functions is given in table 1.
In breast ultrasound images, the spiculation and the angular margins are the significant characteristics of the spiculation and produce higher positive predictive value of malignancy. Ellipsoid shape is also significant characteristic of benign masses in breast ultrasound images. These features have high sensitivities and negative predicted values. We have effectively used SVM classifiers with the help of Angle of curvature, shadow and ellipsoidal features to classify the ROI‟s as malignant or benign.
5.
EXPERIMENTAL RESULTS
The proposed methods are applied on 100 ROI‟s of ultrasound images. First set of features related to spiculations were retrieved using angle of curvature method. Second set of features related to shape were retrieved by fitting an ellipse to mass contour to find the elliptical shape of mass. Finally we have seen whether acoustic shadow is generated by mass or not. Classification is done using SVM toolbox by considering 70% of dataset for training and 30% for testing. We have evaluated the method of classification to classify the breast mass in ultrasound images as malignant or benign. For cross validation we used leave-one-out scheme. Performance analysis is done by plotting Receiver Operating Curve (ROC). ROC graphically represents the true positive rate as a function
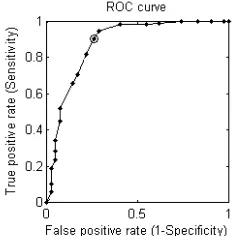
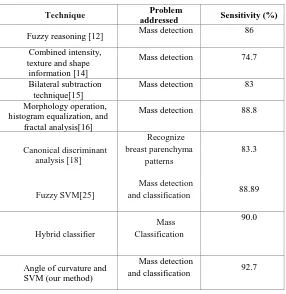
[image:6.595.373.490.214.332.2]of false positive rate. The performance of the classifier is assessed in terms of sensitivity and specificity as shown in “Fig. (10)”. Where sensitivity is the proportion of actual positives which are correctly identified and specificity is the proportion of negatives which are correctly classified. ROC curve shows the performance of SVM classifier for classification of masses as malignant or benign in ultrasound images with sensitivity 92.7%, area under curve (AUC) is 0.88. Table 2 gives the comparison of our method with other existing methods which have addressed similar type of problems. The performance of SVM for 3 kernel functions is given in table 1.
Fig. 10: ROC Curve depicting the performance of SVM classifier with sensitivity of 92.7% and AUC=0.88.
6.
CONCLUSION AND FUTURE WORK
In this work, we have proposed a new approach for retrieving a most distinctive feature which is a spiculated feature of mass by measuring angle of curvature at each pixel on contour. We have considered this to be an important and distinctive feature because most of the malignant masses are discriminated from benign masses from this feature. Acoustic shadow and elliptical shape features are also used here as they most significant features to classify the masses as benign or malignant. Increased sensitivity and improves methods for early detection of breast cancer is expected to reduce mortality due to the disease. This will also improve the prognosis of patients with breast cancer. As the features retrieved from one modality are not sufficient to classify masses and to detect the breast cancer in earlier stage, future research will concentrate on designing image processing algorithms to extract features from different modalities and combining these features to improve the performance of detection.
Table-1 – Results of SVM classifier
Kernel Function Sensitivity (%) Specificity (%)
Gaussian RBF 92.7 90.3
Polynomial 89.4 90.1
[image:6.595.155.440.633.717.2]Table-2 - Comparison of our method with other existing methods:
Technique Problem
addressed Sensitivity (%)
Fuzzy reasoning [12] Mass detection 86 Combined intensity,
texture and shape information [14]
Mass detection 74.7
Bilateral subtraction technique[15]
Mass detection 83
Morphology operation, histogram equalization, and
fractal analysis[16]
Mass detection 88.8
Canonical discriminant analysis [18]
Recognize breast parenchyma
patterns
83.3
Fuzzy SVM[25]
Mass detection
and classification 88.89
Hybrid classifier
Mass Classification
90.0
Angle of curvature and SVM (our method)
Mass detection
and classification 92.7
7.
REFERENCES
[1] Minavathi, Dr. S. Murali, Dr. M. S. Dinesh, Segmentation scheme for mammograms, Proceedings of ICETE 2011 , Nitte.
[2] Minavathi, Murali. S, M. S. Dinesh, Detection of Architectural Distortions with Spiculations in Mammograms by analyzing the structure of Showsmammary glands , Accepted in Fifth Indian International Conference on Artificial Intelligence(IICAI) , Tumkur, to be held in Dec-2011.
[3] M. A, Wirth, Nonrigid Approach to Medical Image Registration: Matching Images of the Breast, Ph.D. Thesis, RMIT University, Melbourne, Australia, 2000.
[4] Marnell Jameson, Ultrasound as a breast cancer test is becoming more accepted, Los Angeles Times , 000037057 June 14 , 2004.
[5] K. Thangavel , R. Manavalan, I. Laurence Aroquiaraj, Removal of Speckle Noise from Ultrasound Medical Image based on Special Filters: Comparative Study, ICGST-GVIP Journal, ISSN 1687-398X, Volume (9), Issue (III), June 2009.
[6] E.A Sickles, R.A. Filly, P.W. Callen, Breast detection with sonography and mammography, AJR, 140:843-845, 1983.
[7] C. J. Vyborny, T. Doi, K. F. O‟Shaughnessy, H. M. Romsdahl, A. C. Schneider, and A. A. Stein, Breast
[8] cancer: Importance of spiculation in computer-aided detection, Radiology, vol. 215, no. 3, pp. 703–707, 2000.
[9] Kalpana Saini, M.L.Dewal, Manojkumar Rohit, Ultrasound Imaging and Image Segmentation in the area of Ultrasound: A Review , International Journal of Advanced Science and Technology Vol. 24, November, 2010.
[10]Abdul Kadir Jumaata, Wan Eny Zarina Wan Abdul Rahmanb, Arsmah Ibrahimc, Rozi Mahmud, Segmentation of Masses from Breast Ultrasound Images using Parametric Active Contour Algorithm, International Conference on Mathematics Education Research 2010 (ICMER 2010), 1877-0428, 2010
Published by Elsevier Ltd.
doi:10.1016/j.sbspro.2010.12.089
[11]Yan Xu and Toshihiro Nishimura, Segmentation of Breast Lesions in Ultrasound Images Using Spatial Fuzzy Clustering and Structure Tensors, World Academy of Science, Engineering and Technology 53 , 2009.
[12]Kass M, Witkin A & Terzopoulos D (1986): Snakes: Active Contour Models, International Journal of Computer Vision, 3, 321-331.
[14]K. Horsch, M. L. Giger, L. A. Venta, and C. J. Vyborny, Automatic segmentation of breast lesions on ultrasound, Med. Phys., vol. 28, no. 8, pp. 1652– 1659, Aug. 2001.
[15]A. Madabhushi and D. N. Metaxas, Combining low, high-level and empirical domain knowledge for automated segmentation of ultrasonic breast lesions, IEEE Trans. Med. Imag., vol. 22, no. 2, pp. 155– 169, Feb. 2003.
[16]Yuji Ikedoa, Daisuke Fukuokab, Takeshi Haraa, Hiroshi Fujitaa, Etsuo Takadac, Tokiko Endod, and Takako Moritae, Computerized mass detection in whole breast ultrasound images: Reduction of false positives using bilateral subtraction technique, Medical Imaging 2007, Proc. of SPIE Vol. 6514, 65141T, (2007) · 1605-7422/07
[17] Dar-Ren Chena,T, Ruey-Feng Changb, Chii-Jen Chenb, Ming-Feng Hob, Jen Kuoa, Shou-Tung Chena, Shin-Jer Hungc, Woo Kyung Moon, Classification of breast ultrasound images using fractal feature, Journal of Clinical Imaging 29 (2005) 235–245.
[18]Steve R. Gunn, Support Vector Machines for Classification and Regression, Technical Report, University of Southampton, 1998.
[19] Yuji Ikedo , Takako Morita , Daisuke Fukuoka , Takeshi Hara , Bert Lee , Hiroshi Fujita , Etsuo Takada , Tokiko Endo, Automated analysis of breast parenchymal patterns in whole breast ultrasound images: preliminary experience ,Int J CARS (2009) 4:299–306, Springer.
[20]Ruey-Feng Chang, Wen-Jie Wu, Woo Kyung Moon, and Dar-Ren, Automatic ultrasound segmentation and morphology based diagnosis of solid breast Tumors, Breast Cancer Research and Treatment (2005) 89: 179–185, Springer.
[21]Jae H. Song, Santosh S. Venkatesh, Emily. F. Conant, Ted W. Cary, Peter H. Arger, Chandra M. Sehgal, Artificial Neural Network to aid differentiation of malignant and benign breast masses by ultrasound imaging, ANN_final_web, 2005.
[22] Y. Huang, S.J. Kuo, C.S. Chang, Y.K. Liu, w. K. Moon and D.R. Chen, Image retrieval with principal component analysis for breast cancer diagnosis on various ultrasonic systems, Ultrasound Obstet Gynecol 2005; 26: 558–566.
[23]J. Alison Noble, Senior Member, IEEE, and Djamal Boukerroui, Ultrasound Image Segmentation: A Survey ,IEEE transactions on medical imaging, Vol. 25, No. 8,Aug 2006.
[24]Etienne von Lavante, J. Alison Noble, Segmentation of breast cancer masses in ultrasound using Radio-frequency signal derived parameters and strain estimates ,978-1-4244-2003-2/08/, ©2008 IEEE [25]Vapnik V 1998 Statistical learning theory (NY:
Wiley).
[26]Xiangjun Shi, H.D. Cheng, and Liming Hu, Mass Detection and Classification in Breast Ultrasound Images Using Fuzzy SVM, 2006.
[27]Alvarenga, A.V.; Pereira, W.C.A.; Infantosi, A.F.C.; Azevedo, C.M.; Nat. Inst. of Metrol., Rio de Janeiro , Classifying Breast Tumours on Ultrasound Images Using a Hybrid Classifier and Texture Features , Intelligent Signal Processing, 2007. WISP 2007. IEEE International Symposium [28]Minavathi, Dr. S. Murali, Dr. M. S. Dinesh,