http://dx.doi.org/10.4236/tel.2015.53051
Dividend Payout Ratio and Firm’s
Profitability. Evidence from Pakistan
Mudassar Hasan1, Muhammad Ishfaq Ahmad2, Muhammad Yasir Rafiq3,
Ramiz Ur Rehman4
1Lahore Business School, The University of Lahore, Lahore, Pakistan
2Public Administration and Law School, Liaoning Technical University, Fuxin, China 3Government Islamia College of Commerce, Lahore, Pakistan
4Lahore Business School, The University of Lahore, Lahore, Pakistan
Email: mudassarhasan84@yahoo.com, m_ishfaq452@yahoo.com, yasir.stats@gmail.com,
ramiz_rehman@hotmail.com
Received 5 April 2015; accepted 26 June 2015; published 29 June 2015 Copyright © 2015 by authors and Scientific Research Publishing Inc.
This work is licensed under the Creative Commons Attribution International License (CC BY).
http://creativecommons.org/licenses/by/4.0/
Abstract
This paper investigates the relationship between dividend payout ratio and profitability of a firm. For this, two main sectors of Pakistan are selected, energy and textile. The study covers a time span of 1996-2008. Firm performance is measured by earning per share (EPS) and return on as-sets (ROA). The results of logarithmic regression show that no matter what industry is, there is a negative impact of dividend payout ratio on next year earnings of a firm.
Keywords
Dividend Payout, Earning Per Share, Return on Assets
1. Introduction
value of the firm. There could be several answers to this fundamental question but the final picture is still blurred. Dividend policy is itself affected by a number of factors. These factors may be categorized as general and specific. Several studies have shown that dividends follow earnings. We are interested in investigating the other way around: do dividend payout ratios drive profitability?
In perfect markets, finance literature greatly promotes that the dividend policy is irrelevant. Though this ar-gument is often supported by some, most still opine the arar-gument as controversial. Assuming the presence of transactions and taxes, the dividend payout ratio is considered to be a dilemma. Although this argument seems appealing, most companies still tend to pay dividends. Most influential authors of corporate finance theory like Brealey and Myers, Brigham and Gapenski, Van Horne explain the dividend policy in their own way. Where one regards it as one of the “10 unresolved problems in finance”, the other puts it as “one of the most judgmen-tal decisions that a manager must make”, and the third believes that the “lack of firm footing for predicting the long-run effect of a specific dividend policy on valuation makes the dividend decision more difficult in many ways than either the investment or financing decisions”, respectively.
2. Review of Literature
Several researchers have tried shed light on dividend policy. Building on the assumption of perfect markets, [1] took the stand that basic determinants of the firm value happen to be the basic earning power and its business risk. This implies that firm value is unaffected by the decision regarding dividend payout policy so it is irrele-vant. [2] argued that increase in dividend payout ratio decreases required return on equity because investors are less certain about capital gains. As capital gains are considered to arise as result of retaining profits and where as dividends are not. So this makes dividends as being less risky than capital gains. In effect, they argued that in-vestors value more to an expected dividend to an expected capital gain as they are less risky. Tax preference theory argued that due to tax benefits are associated with capital gains; capital gains are more valuable to inves-tor than dividends.
Ownership structure and agency problem can also influence dividend policy. After studying sharehold-er-manager conflict and the proportion of equity held by insiders, [3] illustrated that these two factors should af-fect dividend payout policy. [4] found different investor groups (clientele) have their own choices about divi-dends and capital gains which lead a firm to set a dividend payout policy according to the clienteles.
[5] took their stance on signaling hypothesis that dividends contain information asymmetry. This implies shareholders and management have their own set of information which could be quite different from another. Inside information element helps create the difference in a big way. [6] [7] investigated the life cycle effect and market imperfections regarding dividend policy. The studies exhibited that firms should consider their life cycles, significance of market imperfections and how managers assess them primarily in setting up their payout ratios. Additionally, the research also considered several other factors related to the decision of dividend payout ratio including transaction costs, floatation costs, asymmetric information, agency costs and taxes. [8] in their catering theory, suggested that managers tend to cater the needs of the investors. They argued that managers tap the tendency of the investors to set up premiums for stock prices. When investors tend to set stock price high enough to establish a premium, managers tend to pay stable dividends. Alternatively, when investors prefer companies who do not pay dividends, managers are more reluctant to pay dividends.
[9] explored the factors affecting dividend policy. These factors include periodic variation of investment op-portunities, profitability, and the prospects for growth for industry and for the firm. Another explanation pro-vided by [10] showed a relationship between dividend payout policy, profitability volatility, and investment needs. This relationship was explored while studying the capital structure decisions. Meanwhile, [11]-[13] con-ducted studies over American companies which also added value to their stance. Studies have shown that, un-doubtedly, dividend payout policy depends upon company specific factors. It was [14] who claimed that the de-cision is also affected by industry-wide variable. As [15] [16] established every industry has its own distinct dividend payout policy. However, whether paying out dividends have a feedback effect on earnings or not, are the question which still needs to answer? Our study aims to investigate the very fact.
3. Methodology
sectors of Pakistani industry in this respect, one with high dividend payout ratio (DPRES) i.e., Fuel and Energy Sector and other with low (mostly zero) dividend payout ratio (DPRTS) i.e., Textile Sector. The other variables are earning per shares (ESPES, EPSTS), return on assets (ROAES, ROATS) and t represents years. The analysis covers a period of twelve years i.e. 1996-2008. All variables cover a period of eleven years but differing in terms of starting and ending points i.e. DPR (1996-2007) and both ROA and EPS (1997-2008). The reason of choosing this particular era is the variation of economic indicators in Pakistan. We have experienced a high economic growth in that decade and afterward a sharp decline too. No previous study is available on this partic-ular aspect, especially in Pakistan. This can be done by applying the following econometric models.
( ) 1 1 ( ) 1
ES t 1 ES t
LogEPS + =α β+ LogDPR + (1)
( ) 2 2 ( ) 2
ES t 1 ES t
Log ROA + =α +β Log DPR + (2)
( ) 2 2 ( ) 3
TS t 1 TS t
Log EPS + =α +β Log DPR + (3)
( ) 2 2 ( ) 4
TS t 1 TS t
Log ROA + =α +β LogDPR + (4)
Expected Signs
The expected signs are as follows: β1 < 0, β2 < 0, β3 < 0, and β4< 0, i is the error term, where i=1, 2,3,.
i-N(0, б2). There is no multi-co-linearity problem in model 3. All the models follow the assumptions of classical
linear regression model. The significance of these models will be further analyzed by applying ANOVA (Analy-sis of Variance). The coefficients of independent variables (Dividend Payout Ratios) for model 1 and 2 will also be compared for energy and textile sector.
4. Result and Discussion
The analysis is conducted in two steps, firstly, descriptive statistics of all the variables are evaluated, and se-condly, the logarithmic regression is applied on four models. The results show that there is a mixed trend in set-ting up the dividend policy of both sectors. There is inconsistency in the dividend payout ratio during the last eleven years. Same trend is observed for the profitability of both sectors. But Energy sector is quite consistent with its profitability as compared to textile sector.
In energy sector, the mean return on asset is 28.52% where as its standard deviation is 96.28%. These statis-tics are clear evidence of inconsistency in profitability, but when we compare this with textile sector standard deviation of return on asset is 200.53%, then it seems to be low. The mean dividend payout ratio in energy sec-tor is 37% whereas in textile secsec-tor it is only 12%. In both secsec-tor the standard deviation of dividend payout ratio is quite high, which shows the inconsistency in dividend policy (see Table 1).
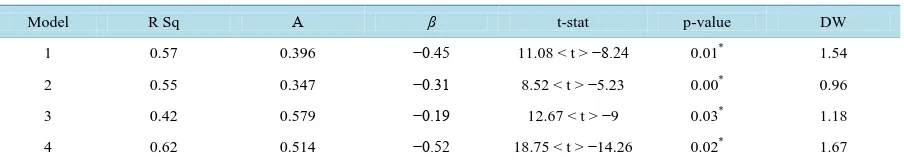
The study aims at exploring the affect of dividend policy on profitability of a firm, specifically considering industry characteristics. For this, four different models are set up and log regression is applied to determine the lag impact of dividend policy on the return on asset and earnings per share of energy and textile sectors. In mod-el 1, R square is 57% which shows strength of the modmod-el. The negative beta coefficient shows the negative im-pact of dividend payout ratio on the earning per share. The p value shows that, at 5 percent level of significant, the model is significant. The Durban Watson value shows that there is no auto correlation between independent and dependent variable. In model 2, beta coefficient is −0.31, which shows a negative impact of dividend payout ratio on return on asset, whereas, p-value is 0.00 which highly significant at 5% level of significance. In model 3, R square is comparatively low at 42% but still it is on a higher node. This model has also a negative beta coeffi-cient and a very high significant p-value. Similarly, in model 4, beta coefficoeffi-cient is also negative with significant p-value (see Table2).
5. Conclusion
Table 1. (a) Descriptive statistics (energy sector); (b) Descriptive statistics (textile sector).
(a)
No of Observations Mean Std. Dev Std. Error
ROA 283 38.15% 83.34 7.01
EPS 283 17.12 21.17 1.32
DPR 283 32.19% 0.70 0.04
Note: EPS is in Pak rupees.
(b)
No of Observations Mean Std. Dev Std. Error
ROA 1932 38.76% 167.13 5.74
EPS 1932 4.76 14.97 0.33
DPR 1932 16.00% 0.56 0.02
Note: EPS is in Pak rupees.
Table 2. Regression results of the studied model.
Model R Sq Α β t-stat p-value DW
1 0.57 0.396 −0.45 11.08 < t > −8.24 0.01* 1.54
2 0.55 0.347 −0.31 8.52 < t > −5.23 0.00* 0.96
3 0.42 0.579 −0.19 12.67 < t > −9 0.03* 1.18
4 0.62 0.514 −0.52 18.75 < t > −14.26 0.02* 1.67
*
Significance at alpha 5%.
are very surprising and giving new dimensions to the finance researchers to further study in this area and find out the insights.
References
[1] Miller, M. and Modigliani, F. (1961) Dividend Policy, Growth and the Valuation of Shares. Journal of Business, 34, 411-433. http://dx.doi.org/10.1086/294442
[2] Gordon, M.J. (1963) Optimal Investment and Financing Policy. Journal of Finance, 18, 264–272.
[3] Jensen, M.C. and Meckling, W.H. (1976) Theory of the Firms: Managerial Behavior, Agency Costs and Ownership Structure. Journal of Financial Economics, 3, 305-360. http://dx.doi.org/10.1016/0304-405X(76)90026-X
[4] Miller, M. and Scholes, M. (1978) Dividends and Taxes. Journal of Financial Economics, 6, 333-364.
http://dx.doi.org/10.1016/0304-405X(78)90009-0
[5] Bhattacharya, S. (1979) Imperfect Information, Dividend Policy and the Bird in the Hand Fallacy. Bell Journal of Economics, 10, 259-270. http://dx.doi.org/10.2307/3003330
[6] Lease, R.C., John, K., Kalay, A., Loewenstein, U. and Sarig, O.D. (2000) Dividend Policy: Its Impact on Firm Value. Harvard Business School Press, Boston.
[7] Fama, E.F. and French, K.R. (2001) Disappearing Dividends: Changing Firm Characteristics or Lower Propensity to Pay? Journal of Financial Economics, 60, 3-43. http://dx.doi.org/10.1016/S0304-405X(01)00038-1
[8] Baker, M. and Wurgler, J. (2004) A Catering Theory of Dividends. Journal of Finance, 59, 1125-1165.
http://dx.doi.org/10.1111/j.1540-6261.2004.00658.x
[9] Lintner, J. (1956) Distribution of Incomes of Corporations among Dividends, Retained Earnings, and Taxes. American Economic Review, 46, 97-113.
[10] Myers, S.C. (1984) The Capital Structure Puzzle. Journal of Finance, 39, 575-592. http://dx.doi.org/10.2307/2327916
[11] Jensen, G., Solberg, D. and Zorn, T. (1992) Simultaneous Determination of Insider Ownership, Debt, and Dividend Policies. Journal of Financial and Quantitative Analysis, 27, 247-263. http://dx.doi.org/10.2307/2331370
Fi-nancial and Quantitative Analysis, 14, 119-135. http://dx.doi.org/10.2307/2330658
[13] Rozeff, M. (1982) Growth, Beta and Agency Costs as Determinants of Dividend Payout Ratios. Journal of Financial Research, 5, 249-259. http://dx.doi.org/10.1111/j.1475-6803.1982.tb00299.x
[14] Lintner, J. (1953) The Determinants of Corporate Savings. In: Boddy, F. and Nelson, C., Eds., Savings in the Modern Economy, University of Minnesota Press, Minneapolis.
[15] Baker, H.K. (1988) The Relationship between Industry Classification and Dividend Policy. Southern Business Review,
14, 1-8.
[16] Michel, A. (1979) Industry Influence on Dividend Policy. Financial Management, 8, 22-26.