Design of Host based Intrusion Detection System using
Fuzzy Inference Rule
Hari Om
Department of Computer Science & Engineering Indian School of Mines, Dhanbad
Dhanbad 826004,India
Alok Kumar Gupta
Department of Computer Science & Engineering Indian School of Mines, Dhanbad
Dhanbad 826004,India
ABSTRACT
The security of a system is an important issue due to the latest advancements in information technology. Intrusion Detection Systems are used to identify the attacks and malicious activities in the computer systems. This paper discusses a new host based intrusion detection system for detecting changes in hardware profile using fuzzy inference rule. The proposed system is able to analyze and detect the unauthorized access in a computer system by generating a set of fuzzy IF-THEN rules with the help of frequent item set. These fuzzy inference rules are used to find the misuse of the system. The experiments of the proposed system are carried out on the system performance log.
Keywords
Intrusion Detection System (IDS), Fuzzy logic, System performance log, Fuzzy inference rules
1.
INTRODUCTION
Due to technology emerges day by day, there is a need to have a security mechanism to protect the systems from unauthorised users and malicious activities. For this, the intrusion detection systems (IDS) are used. An intrusion detection system is a device or software application that collects information from a variety of network sources or computer systems for analysis in order to detect the signs of malicious activities. An intrusion is defined as a set of actions that attempts to compromise the integrity, confidentiality, or availability of the system resources [1]. Integrity refers to maintain and assure the accuracy and consistency of data over its entire life cycle. Confidentiality refers to maintain the secrecy of data into system so that unauthorized user cannot access. Availability refers to availability of information resources. There are two common approaches to develop an intrusion detection model: misuse detection model and anomaly detection model [2]. The misuse detection model refers to detection of intrusions that follow well-defined intrusion patterns. Every intrusion has some pattern e.g. number of packets, number of connection, bytes sent, duration etc. It matches the packets with the database of pattern. Whenever there is a match, alarms are raised. It is very useful in detecting known attack, but not suitable for unknown attacks. The anomaly detection model refers to detection performed by detecting changes in the patterns of utilization or behaviour of the system. Whenever there is any deviation from the normal behaviour activity, alarms are raised. Normal behaviour can be developed using different techniques such as statistical analysis, data mining algorithms, genetic algorithms, artificial neural network approach, fuzzy logic and rough set etc. The anomaly detection systems can detect new intrusions unlike the misuse detection systems. The IDSs can be network based or host based as far as the source of data is
concerned. Network based IDS (NIDS) collects raw packets as the data source from the network and analyse for signs of intrusions. The host based IDS (HIDS) operates on information collected from within an individual computer system such as operating system audit trails, C2 audit logs, and System logs.
Fuzzy inference is the process of formulating the mapping from a given input to an output using fuzzy logic. This mapping provides a basis from which decisions can be made, or patterns are discerned. The process of fuzzy inference involves all of the pieces that are described in membership functions, logical operations, and fuzzy IF-THEN rules. The proposed work describes to design a host based intrusion detection system using fuzzy inference rules. The performance log of a computer system acts as input to proposed system. The input is divided into two subsets: one is called as training data and other as testing data. The training dataset is further classified into two subsets: abnormal and normal data. After that, perform data mining technique to select frequent items from each attribute in the abnormal data as well as normal data. These mined frequent items are used to find the important attributes of the input dataset, which in turn are used to develop a set of definite and indefinite rules using a deviation method. Then, indefinite rules must be ignored and definite rules are used to generate fuzzy inference rules by fuzzifying it in such a way that we obtain a set of fuzzy IF-THEN rules with consequent parts that represent as either normal or abnormal data. These rules are given to the fuzzy inference system to effectively learn[16][18]. In testing phase, the testing data is matched with fuzzy inference rules to detect abnormal and normal behaviour of data. In this proposed work, Mamdami fuzzy inference system is used which is implemented in MATLAB 7.5.
The remaining paper is organized as follows: Section 2 reviews the related work. Section 3 discusses our proposed work. The performance log analysis is given in section 4. The experimental methodology and the results are discussed in section 5. Finally, the paper is concluded in section 6.
2.
RELEATED WORK
they use genetic algorithm to make IDS more efficient [6]. The genetic algorithm has been used to prune the best rules from the generated rule set. They use DARPA dataset for training and testing purpose. Siraj et al. discuss an intelligent alert clustering model for network intrusion analysis [7]. They use principal component analysis with expectation maximization technique to aggregate similar alerts and reduce the number of low quality alerts. Shanmugavadivu et al. use KDD Cup99 for their proposed anomaly based network intrusion detection system [8]. They use fuzzy logic for identifying the intrusion activities in a network. This system generates fuzzy IF-THEN rules and with the help of fuzzy decision module the system identifies the appropriate classification of the test data. Dhanalakshmi discusses a system in which the fuzzy logic is integrated with the data mining methods using genetic algorithm for intrusion detection [9]. This system uses data mining to extract rules and Mamdami fuzzy inference system to determine the behaviour of the test data. Om et al. have designed a PCA based anomaly detection system for outlier detection in a computer system [10]. They use principal component analysis (PCA) to reduce the dimensions of data recorded by the
computer system (performance log). Bharti et al. have proposed an intrusion detection model in which they use feature selection algorithm to select the non-redundant attributes [11]. They use fuzzy K-mean clustering algorithm to calculate the membership of every data point and J48 classification techniques for assigning a cluster to a particular class. Han et al. describe an evolutionary neural network based intrusion detection system, which has good detection performance and also reduces the training time [12]. Om et al. discuss a neural network based model, which can detect changes in the hardware profile of a computer system [13]. They use back propagation network (BPN) for detection and reported that the very high and very low values of the learning rate have bad effect on the results.
3.
PROPOSED WORK
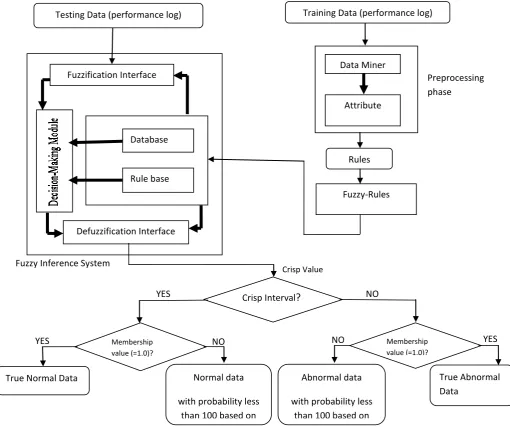
Recently, several researchers have focused on fuzzy logic for developing an effective intrusion detection system. This paper also proposes a fuzzy logic based intrusion detection system for detecting the changes in hardware profile. The model of our system is shown in Fig. 1. The preprocessor generates the rules and provides them to fuzzy rules generator to generate
Testing Data (performance log) Training Data (performance log)
KnowledgeBase Fuzzification Interface
Database
Rule base
Defuzzification Interface
Data Miner
Attribute
Selector
Rules
Fuzzy-Rules
Generator
Crisp Interval
?
Membership value (=1.0)?
Membership value (=1.0)?
True Normal Data
Preprocessing phase
Normal data
with probability less than 100 based on membership
value
Abnormal data
with probability less than 100 based on membership
value
True Abnormal Data
NO
NO NO
YES
YES YES
Crisp Value
[image:2.595.53.564.315.742.2]Fuzzy Inference System
fuzzy IF-THEN rules for the proposed system. A fuzzy inference system is used to generate the output for detection.
In this figure, a bold line denotes the interconnection inside the module and a normal line denotes the data flow in the proposed system. The different steps involved in the proposed system for intrusion detection are described as follows:
i. Preprocessing module a. Data miner b. Attribute selector ii. Fuzzy rules generator iii. Fuzzy inference system iv. Finding behavior for a test input
3.1
Preprocessing Phase
The first component of our proposed system is preprocessing module. This module is responsible for accepting training data as system log and categorizes it into two classes: abnormal and normal data. These data are used to generate rules. The preprocessing module contains two sub-modules: data miner and attribute selector.
a. Data miner
The data miner integrates FP-Growth algorithm property to mine the frequent items in each attribute [3]. By considering the frequency of items in each attribute, the data miner identifies the frequent items by inputting sufficient support. The frequent items are identified for both the classes namely, abnormal and normal classes.
b. Attribute Selector
This module selects the suitable attributes from the input data as all the attributes are not useful for detection. For identifying the suitable attributes, the deviation method is used. Each class (abnormal and normal) is represented as
1, 2, 3,...
i n
Class A A A A , where A1, A2,… An are the attributes in ith class. In our proposed system, the class
1 refers to normal and class2 to abnormal class. Each attribute Aj contains items Ik that have frequency greater than the minimum support.
;1
j k
A I k m and
support(I ) min support
k
Here, support(Ik) is the frequency of kth item in Aj attribute of classi. Then, for each attribute, the deviation range(D) {min, max} of the frequent items is calculated as follows.
min,
max
jA
D
f
f
,where fmin min support(I )
k
and
f
max
max support(I )
k
The attributes containing non-identical {max, min} range for both the classes are chosen as effective attributes, which will give significant detection rate. The chosen attributes are used to generate rules for the proposed system. Compare the deviation range of the effective attributes for both abnormal and normal data to calculate intersection point. After that, intersection points are used to generate IF-THEN rules.
3.2
Fuzzy Rules Generator
The fuzzy rules are generated from the definite rules obtained from above step. The definite rules are the rules that contain only one classification label in THEN part. The fuzzy rules contain linguistic variables only, hence the membership functions are used to fuzzify the numerical values in definite rules. The triangular and trapezoidal membership functions are used in this step. For example, if an attribute1 is N1, the data is abnormal; if an attribute1 is N2, the data is normal.
Here, N1 and N2 are linguistic variables. These fuzzy rules are given to Rulebase of the fuzzy inference system.
3.3
Fuzzy Inference System
This step describes the fuzzy logic system for finding the suitable class label of the input test dataset. In the proposed system, we use Mamdami inference system [14], which is based on Zadeh’s paper on fuzzy algorithms for complex system and decision process [17]. In our proposed system, nine inputs and one output Mamdami fuzzy inference system with the centroid of area defuzzification strategy is used.
3.4
Finding Behaviour for a Test Input
For testing phase, a test data from the testing data is given to the Mamdami fuzzy inference system. It compares the input variable with the membership functions on the premises part to obtain the membership value for each linguistic label. The output of fuzzification interface is fed to the decision making unit which in turn compares that particular input with Rulebase. The output of knowledgebase is fed to defuzzification interface, which converts the fuzzy result into a crisp value. If the crisp value lies in the user defined intervals for respective behavior, the data can be classified as normal and abnormal. In our proposed system, if the crisp value is between 0 to 50, i.e.
(0
crisp
value
50)
, the data is normal; and if the crisp value is between 50 to 100, i.e.(50
crisp
value 100)
, the data is abnormal. If the membership value for a test data is 1.0, the test data is either true normal or true abnormal.ALGORITHM
Input: Performance log recorded by the computer system Output: Abnormal data or Normal data
Assumptions:
a. Training data is divided into two classes: abnormal class and normal class.
b. Testing data contains abnormal data, normal data or both.
step 1: Training data is given as input to preprocessing module that contains data miner and attribute selector:
a) Data Miner extracts frequent itemsets in each attribute from both the classes: abnormal and normal classes.
b) Attribute selector selects effective attributes, which are suitable for rules generation.
c) With the help of effective attributes, IF-THEN rules are generated.
step 2: Rules obtained from preprocessor are given as input to fuzzy rules generator module.
step 3: Fuzzy rules generator generates fuzzy IF-THEN rules corresponding to each rule obtained in step 1, and feeds it into rulebase of fuzzy inference system. step 4: In database of fuzzy inference system, define
membership function of fuzzy sets used in fuzzy rules.
step 5: Testing data is given as input to fuzzy inference system.
step 6: For each test data, fuzzy inference system generates a crisp value as an output.
and, if crisp value is between 50 to 100, the data is abnormal.
step 8: If the membership value for a test data is 1.0, the test data is true normal or true abnormal, otherwise test data has respective behavior with probability less than 1.0 based on the membership value.
4.
PERFORMANCE LOG ANALYSIS
The performance log has been generated of patterns with errors and without errors. The proposed system has been applied to analyse the log and find the result.
(a) Performance log
The performance logs are generated by taking some of the process attributes for normal and abnormal behavior of the system. The performance of the personal computer can be measured by using the performance log. The hardware profile of the system that has been used in experiments as follows:
Intel Core 2 Duo CPU @ 2.33 GHz 1024 MB RAM
Microsoft Windows XP
(b) Attributes used in performance log
The used attributes for Performance Log analysis are as follows.
% committed byte in use: It is the ratio of memory committed bytes to the memory commit limit. The commit limit is determined by the size of the paging file.
Available Mbytes: It is the amount of physical memory in Megabytes immediately available for allocation to a process or for the system use.
System Driver Resident Bytes: It is the size (in bytes) of the pageable physical memory being used by device drivers. System Driver Total Bytes: It is the size in bytes of the
pageable virtual memory currently being used by the device drivers.
I/O Write Operations/sec: The rate at which the process is issuing write I/O operations.
File Control Operations/sec: It is the combined rate of file system operations that neither reads nor writes.
File Data Operations/sec: It is the combined rate of read and write operations on all logical disks on the computer. File Write Operations/sec: It is the combined rate of the
file system write requests to all devices on the computer, including requests to write data in the file system cache.
•
Threads: It is the number of threads in the computer at the time of data collection.5.
EXPERIMENT METHODOLOGY
AND RESULT
For experimental evaluation of the proposed system, the performance log of the computer system needs be generated. The steps for generating the performance logs are as follows:
On the start menu, point to settings, point to Control Panel, double click Administrative Tools, and double click Computer Management.
Explore performance Logs and Alerts, right click Counter Logs, and then click New Log Settings. Type a name for the counter log and then click OK. Click Add Counters.
In the Performance object box, select a performance object that need be monitored.
Counters added for experiment.
On the General tab under Sample data every sampling interval of 15 seconds is configured.
On the Log Files tab log files properties is configured as Comma delimited files that can be viewed later in reporting tools such as Microsoft Excel.
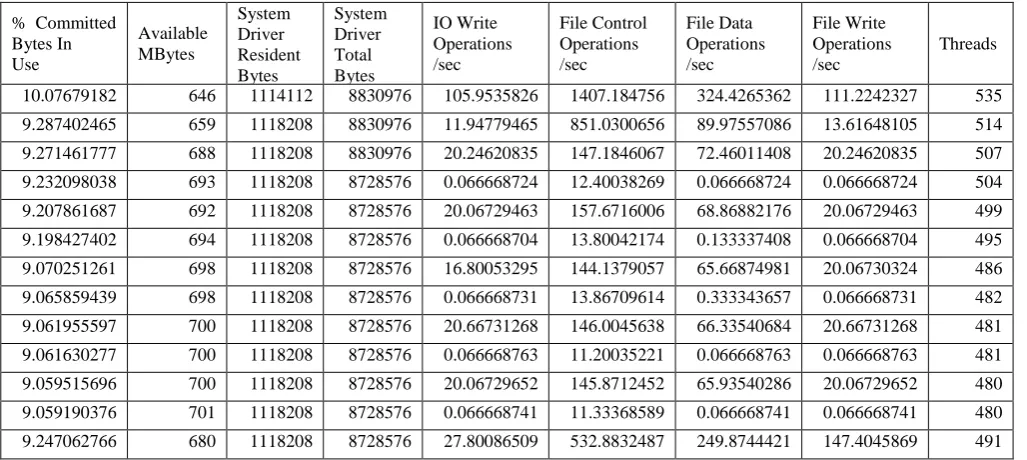
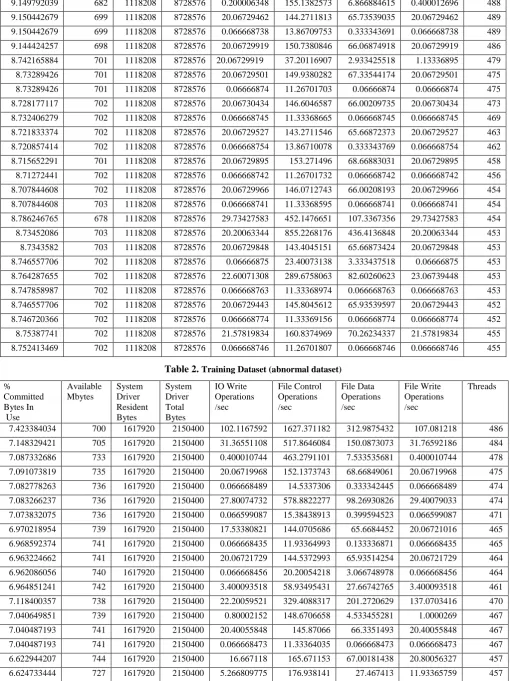
[image:4.595.44.558.530.760.2]The training dataset has been divided into two subdatasets: normal dataset and abnormal dataset. Firstly, the normal dataset have been generated. Samples of normal dataset are shown in Table 1. After that, the abnormal dataset have been generated by disabling graphics driver, audio driver, and Ethernet driver. This generates the logs for the system performance that have been considered as intrusions. Samples of abnormal dataset are shown in Table 2. For testing dataset, we have taken normal data as well as abnormal data, i.e. mixed data. Samples of the testing patterns are shown in Table 3.
Table 1. Training Dataset (Normal dataset)
% Committed Bytes In Use
Available MBytes
System Driver Resident Bytes
System Driver Total Bytes
IO Write Operations /sec
File Control Operations /sec
File Data Operations /sec
File Write Operations /sec
Threads
9.149792039 682 1118208 8728576 0.200006348 155.1382573 6.866884615 0.400012696 488 9.150442679 699 1118208 8728576 20.06729462 144.2711813 65.73539035 20.06729462 489 9.150442679 699 1118208 8728576 0.066668738 13.86709753 0.333343691 0.066668738 489 9.144424257 698 1118208 8728576 20.06729919 150.7380846 66.06874918 20.06729919 486 8.742165884 701 1118208 8728576 20.06729919 37.20116907 2.933425518 1.13336895 479 8.73289426 701 1118208 8728576 20.06729501 149.9380282 67.33544174 20.06729501 475 8.73289426 701 1118208 8728576 0.06666874 11.26701703 0.06666874 0.06666874 475 8.728177117 702 1118208 8728576 20.06730434 146.6046587 66.00209735 20.06730434 473 8.732406279 702 1118208 8728576 0.066668745 11.33368665 0.066668745 0.066668745 469 8.721833374 702 1118208 8728576 20.06729527 143.2711546 65.66872373 20.06729527 463 8.720857414 702 1118208 8728576 0.066668754 13.86710078 0.333343769 0.066668754 462 8.715652291 701 1118208 8728576 20.06729895 153.271496 68.66883031 20.06729895 458 8.71272441 702 1118208 8728576 0.066668742 11.26701732 0.066668742 0.066668742 456 8.707844608 702 1118208 8728576 20.06729966 146.0712743 66.00208193 20.06729966 454 8.707844608 703 1118208 8728576 0.066668741 11.33368595 0.066668741 0.066668741 454 8.786246765 678 1118208 8728576 29.73427583 452.1476651 107.3367356 29.73427583 454 8.73452086 703 1118208 8728576 20.20063344 855.2268176 436.4136848 20.20063344 453 8.7343582 703 1118208 8728576 20.06729848 143.4045151 65.66873424 20.06729848 453 8.746557706 702 1118208 8728576 0.06666875 23.40073138 3.333437518 0.06666875 453 8.764287655 702 1118208 8728576 22.60071308 289.6758063 82.60260623 23.06739448 453 8.747858987 702 1118208 8728576 0.066668763 11.33368974 0.066668763 0.066668763 453 8.746557706 702 1118208 8728576 20.06729443 145.8045612 65.93539597 20.06729443 452 8.746720366 702 1118208 8728576 0.066668774 11.33369156 0.066668774 0.066668774 452 8.75387741 702 1118208 8728576 21.57819834 160.8374969 70.26234337 21.57819834 455 8.752413469 702 1118208 8728576 0.066668746 11.26701807 0.066668746 0.066668746 455
Table 2. Training Dataset (abnormal dataset)
% Committed Bytes In Use
Available Mbytes
System Driver Resident Bytes
System Driver Total Bytes
IO Write Operations /sec
File Control Operations /sec
File Data Operations /sec
File Write Operations /sec
Threads
6.622618891 727 1617920 2150400 20.06721418 143.7372551 65.66845838 20.06721418 456 6.61952839 727 1617920 2150400 0.066668462 11.3336386 0.066668462 0.066668462 455 6.619853705 744 1617920 2150400 20.06721714 145.3373202 66.00181053 20.06721714 455 6.631077105 743 1617920 2150400 0.066668439 20.40054244 3.066748209 0.066668439 452 6.62587205 743 1617920 2150400 20.06721692 144.6706336 65.93514132 20.06721692 450 6.624570786 743 1617920 2150400 0.066668482 11.33364196 0.066668482 0.066668482 449 6.614323335 744 1617920 2150400 20.06721429 143.203908 65.66845872 20.06721429 442 6.605377147 744 1617920 2150400 0.066668464 13.06701891 0.333342319 0.066668464 436 6.599684118 745 1617920 2150400 20.06721678 143.5372682 65.73513538 20.06721678 432 6.599684118 745 1617920 2150400 0.066668473 11.26697186 0.066668473 0.066668473 432 6.896209582 714 1626112 2150400 41.20111634 699.4189507 249.5400946 41.20111634 432 6.634980896 745 1626112 2150400 7.000191124 582.6825754 289.3412331 7.000191124 431 6.634980896 744 1626112 2150400 20.06721757 144.6706383 65.80180645 20.06721757 431 6.644577716 744 1626112 2150400 0.066668477 19.73386925 3.066749951 0.066668477 430 6.641161898 745 1626112 2150400 20.06721537 143.5372581 65.73513074 20.06721537 429 6.641324556 744 1626112 2150400 1.266700927 17.26713369 1.800048686 1.266700927 429 6.640185951 745 1626112 2150400 20.0672155 143.3372535 65.66846267 20.0672155 428 6.639860635 744 1626112 2150400 0.066668472 19.66719923 3.06674971 0.066668472 428 6.644415058 744 1626112 2150400 21.73392725 159.404356 70.66859782 21.73392725 430 6.650433402 743 1626112 2150400 2.466734036 157.004288 16.60045338 2.933413449 430
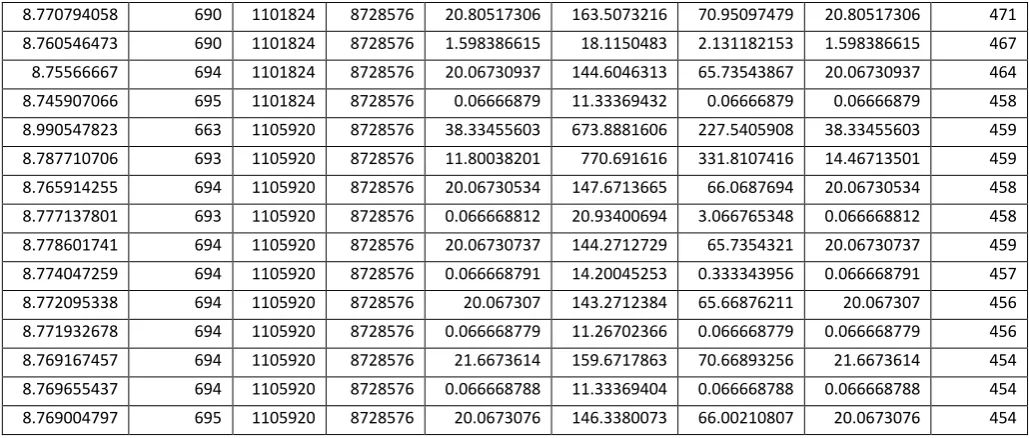
Table 3. Testing Dataset
% Committed Bytes In Use
Available MBytes
System Driver Resident Bytes
System Driver Total Bytes
IO Write Operations /sec
File Control Operations /sec
File Data Operations /sec
File Write Operations /sec
Threads
8.770794058 690 1101824 8728576 20.80517306 163.5073216 70.95097479 20.80517306 471 8.760546473 690 1101824 8728576 1.598386615 18.1150483 2.131182153 1.598386615 467 8.75566667 694 1101824 8728576 20.06730937 144.6046313 65.73543867 20.06730937 464 8.745907066 695 1101824 8728576 0.06666879 11.33369432 0.06666879 0.06666879 458 8.990547823 663 1105920 8728576 38.33455603 673.8881606 227.5405908 38.33455603 459 8.787710706 693 1105920 8728576 11.80038201 770.691616 331.8107416 14.46713501 459 8.765914255 694 1105920 8728576 20.06730534 147.6713665 66.0687694 20.06730534 458 8.777137801 693 1105920 8728576 0.066668812 20.93400694 3.066765348 0.066668812 458 8.778601741 694 1105920 8728576 20.06730737 144.2712729 65.7354321 20.06730737 459 8.774047259 694 1105920 8728576 0.066668791 14.20045253 0.333343956 0.066668791 457 8.772095338 694 1105920 8728576 20.067307 143.2712384 65.66876211 20.067307 456 8.771932678 694 1105920 8728576 0.066668779 11.26702366 0.066668779 0.066668779 456 8.769167457 694 1105920 8728576 21.6673614 159.6717863 70.66893256 21.6673614 454 8.769655437 694 1105920 8728576 0.066668788 11.33369404 0.066668788 0.066668788 454 8.769004797 695 1105920 8728576 20.0673076 146.3380073 66.00210807 20.0673076 454
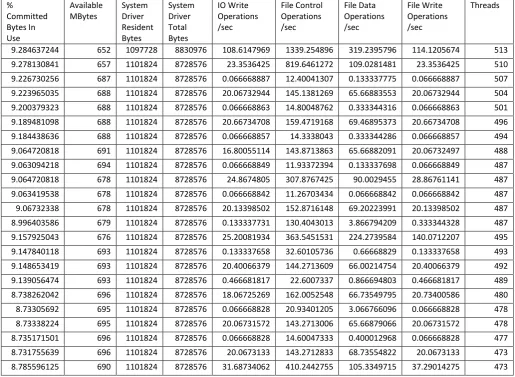
For testing purpose, the testing dataset is given to the proposed system, which finds the behaviour of the input data as normal or abnormal. Results of some tested dataset are given in the form of a table (shown in Table 4). The last two columns denote the results of the tested dataset. The normal
[image:7.595.40.555.71.290.2]data is represented as N and the abnormal data as A. In the last column, the membership value of each dataset is given for the respective behaviour. The membership value 1.0 denotes that it is completely member of normal or abnormal data.
Table 4. Result of test dataset of the proposed system
% committed bytes in use
Available Mbytes
System Driver Resident Bytes
System driver total bytes
IO write operations /sec
File control operations /sec
File data operations /sec
File write operations /sec
Threads
Normal (N) or
abnormal(A)
Member-ship value
8.7690047 695 1105920 8728576 0.0666687 8
11.533699 9
0.0666687 8
0.0666687 8
454 N 1.0
6.5995214 729 1687552 2150400 0.7992243 3
33.167809 9
1.9314588 0.7992243 3
424 A 1.0
8.7556666 694 1101824 8728576 20.067309 3
144.60463 1
65.735438 6
20.067309 3
464 N 1.0
6.5915512 734 1687552 2150400 20.067295 8
143.40449 6
65.668725 20.067295 8
427 A 1.0
9.1390564 693 1101824 8728576 0.4666818 1
22.600733 7
0.8666948 0
0.4666818 1
489 N 1.0
7.1449136 728 1679360 2150400 5.2001596 0
197.13938 4
47.401454 5.2001596 0
469 A 1.0
7.5839623 716 1105920 8728576 0.0666687 8
11.267024 1
0.0666687 8
0.0666687 8
450 A 0.12
7.4222454 699 1675264 2150400 15.871385 0
206.06125 9
98.762694 15.871385 0
476 N 0.2
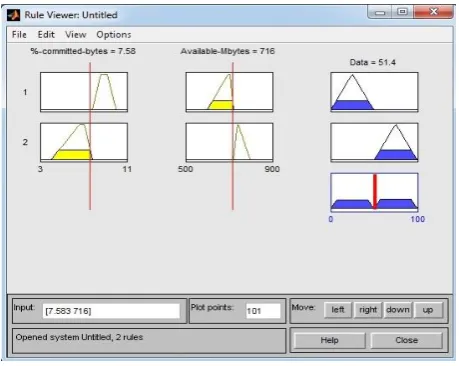
[image:7.595.23.585.361.533.2]Graphical results of the tested dataset of the proposed system are given below (refer Figs. 2 to 5):
[image:7.595.57.278.564.751.2]Fig. 4. Abnormal dataset with membership 0.12
Fig. 5. Normal dataset with membership 0.2
6.
CONCLUSION
Sometimes, a user attempts to change the hardware profile of a computer system without the knowledge of the administrator, this can be a sign of intrusion. This paper discusses an intrusion detection system using fuzzy logic, which can detect the changes in the hardware profile of a computer system. A Mamdami fuzzy inference system has been implemented to identify the accurate behavior of the generated system log. Mamdami fuzzy inference system works on the basis of fuzzy IF-THEN rules; so the fuzzy rules generator module has been used to generate the rules for all combinations of the selected attributes. System performance log of a computer system has been used to evaluate the performance of the proposed system. The experimentation results show that the proposed system can be applicable for detecting changes in hardware profile of a computer system.
7.
REFERENCES
[1] Adetunmbi A. O., Zhiwei S., Zhongzhi S., Adewale O. S., “Network Anomalous Intrusion Detection using Fuzzy-Bayes,” International Federation for Information Processing, Vol. 228, pp. 525-530, 2006.
[2] Biswanath, M., Todd L.H. AND Karl, N. L., “Network Intrusion Detection,” IEEE Network, Vol. 8(3), pp. 26-41, 1994.
[3] Han J., Pei J., Yin Y., Mao R., "Mining Frequent Patterns without Candidate Generation: A Frequent-Pattern Tree Approach," Data Mining and Knowledge Discovery, Vol. 8(1), pp. 53-87, 2004.
[4] Anderson J. P., Computer Security Threat Monitoring and Surveillance. Technical report, Fort Washington, PA, Apr. 1980.
[5] Denning D. E., “An Intrusion Detection Model,” IEEE Trans. on Software Engineering, Vol. 13(2), pp. 222-232, 1987.
[6] Srinivasa K. G., Chandra S., Kajaria S., Mukherjee S., “IGIDS: Intelligent Intrusion Detection System Using Genetic Algorithms,” World Congress on Information and Communication Technologies, pp. 852-857, 2011.
[7] Siraj M. M., Maarof M. A., Hashim S.Z.M., “Intelligent Alert Clustering Model for Network Intrusion Analysis,” Int. J. Advance Soft Comput. Appl. Vol. 1 (1), pp. 33-48, 2009.
[8] Shanmugavadivu R., Nagarajan N. , “An Anomaly Based Netwok Intrusion Detection System Using Fuzzy logic,” IJCSIS, Vol. 8(8), pp. 185-193, 2010.
[9] Dhanalakshmi Y., Babu I. R., “Intrusion Detection Using Data Mining Along Fuzzy Logic and Genetic Algorithms,” IJCSNS, Vol. 8(2), pp. 27-32, 2008.
[10] Om H., Hazra T., “Design of Anomaly Detection System for Outlier Detection in Hardware Profile Using PCA,” IJCSE, Vol. 4(9), pp. 1623-1632, 2012.
[11] Bharti K., Jain S., Shukla S., “Fuzzy K-mean Clustering Via J48 For Intrusion Detection System,” IJCSIT, Vol. 1(4), pp. 315-318, 2010.
[12] Han S. J., Cho S. B., “Evolutionary Neural Network for Anomaly Detection Based on the Behaviour of a Program,” IEEE Trans. on Systems, Man and Cybernetics-Part B, Vol. 36(3), pp. 559-570, 2006.
[13] Om H., Sarkar T. K., “Neural network based intrusion detection system for detecting changes in hardware profile,” Journal of Discrete Mathematics and Cryptography, Vol. 12(4), pp. 451-466, 2009.
[14] Mamdani, E.H. and S. Assilian, “An experiment in linguistic synthesis with a fuzzy logic controller,” Int. Journal of Man-Machine Studies, Vol. 7(1), pp. 1-13, 1975.
[15] Stallings, W. Cryptography and Network Security Principles and Practices: Prentice Hall, 1998.
[16] Lamba,V.K., Neuro Fuzzy System, University Science press: 2008
[17] Zadeh, L.A., “Outline of a new approach to the analysis of complex systems and decision processes,” IEEE Trans. on Systems, Man, and Cybernetics, Vol. 3(1), pp. 28-44, 1973.