© 2018, IRJET | Impact Factor value: 6.171 | ISO 9001:2008 Certified Journal | Page 3109
EXPERIMENTAL STUDY ON UTILIZATION OF GGBS AS PARTIAL
SUBSTITUTE IN FERROCEMENT
Shwetha R A
1, Divya G R
2, Siddeshwar Patil
3, Shravani K A
4, Ulli Gurumurthy5
1
Assistant professor, Department of Civil Engineering, Citech Bangalore, Karnataka, India
2,3,4,5
Students, Department of Civil Engineering, Citech Bangalore, Karnataka, India
---***---
Abstract -
Ferro cement is regarded as highly versatile thin material possessing superior properties which cannot be matched by other conventional infill materials, reduced weight and good thermal insulation characteristics. The Ferro cement panels being light in weight need less strong supporting structures. The study was conducted in two phases. First phase includes the casting of Ferrocement panel each of 25cm X 25cm X 5cm and cubes of 7.06 cm X7.06 cm X7.06cm were tested after7, 28 days of curing for compression and flexural strength. The second phase of the study embarked on development of high workability and high performance Ferrocement by partial replacement of cement by GGBS at 15%,30%,45%,60% and 75%. As the percentage increased the strength is also increased but only up to 60% further the strength is decreased. An estimate of the cost is also shows that using Ferro cement panel is economical.Key Words: Ferrocement, Wire mesh, GGBS, Compressive Strength, flexural strength, Ductility ratio.
1. INTRODUCTION
Ferrocement can be considered a type of thin reinforced concrete construction in which large amounts of small diameter wire meshes are used uniformly throughout the cross-section instead of discretely placed reinforcing bars and in which Portland cement partially replaced with GGBS at different dosages. The performance of concrete with partial replacement of GGBS. It is found that the compressive strength of concrete increases at 28 days age compared to conventional concrete. Super plasticizers are the improved chemical admixtures over plasticizing effects on wet concrete is used in concrete mix. These are mainly used to improve workability, Speed finishing, increase strength and helps in reducing Shrinkage and thermal cracking. The compressive strength and flexural strength of M40 grade concrete with partial replacement of GGBS at 0%,15%,30%,45%, 60% and 75% in ferrocement. Tests were conducted on ferrocement panels to study strength properties. The results are compared with normal conventional concrete.
1.1. Objectives
Determining compressive strength and flexural strength of ferrocement.
Determining the compressive strength and flexural strength of ferrocement with different proportions of GGBS i.e.15%,30%,45%,60% and 75%
2. Materials and Methodology
2.1 Materials
2.1.1Cement
Ordinary Portland cement of grade 53(ultra tech) available in local market was used in the research. The properties of cement are as follows.
Sl.
No
Characteristics Results As per IS 12269-1987
1 Normal
Consistency(%)
32 5-6mm
depth from bottom
2 Initial Setting time(minutes)
40 Not less
than 30
3 Final setting
time(minutes)
480 Not more
than 600
© 2018, IRJET | Impact Factor value: 6.171 | ISO 9001:2008 Certified Journal | Page 3110
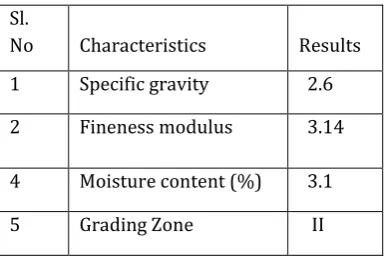
2.1.2 Fine Aggregates
Clean River sand is used for present investigation as fine aggregates. Tests on sand as per IS specification are conducted and results are as follows.
2.1.3 Ground Granulated Blast Furnace Slag
Ground granulated blast furnace slag is a hydraulic binder, Obtained by quenching molten iron slag from a blast furnace in water or steam, to produce a glassy, granular product that is then dried and ground into a fine powder.
.
2.1.4 Wire Mesh
Chicken wire mesh is formed by twisting two adjacent wires at least four times, forming a strong honeycomb mesh structure. Its hexagonal shape prevents the formation of internal stresses. Due to its flexibility structure, chicken wire is convenient for mounting or curved and angled surface.
2.2Ferrocement mixes
Two concrete mixes were prepared. The conventional mix (A) in which 100% OPC. In mixes B the cement was partially replaced with 15%, 30%, 45%, 60% and 75% of GGBS by weight respectively. The fine aggregate content was kept constant for all mixes. The Indian standard method was used for the mix design process. This method of design comprises of tables and charts available at the IS456-2000 and IS10262-2000. The target strength of all mixes was 48.25N/mm2 and the target slump was 100mm. The proportions of materials for each concrete mix are shown in below table.
2.3Mix Proportions
The concrete mix is designed as per IS code for ferrocement panels. For M40grade with the water cement ratio of
0.4.The mix proportions used for ferrocement are 1:5
Grade Cement
Fine
aggregate
w/c ratio
M
401.33kg/m
37.12kg/ m
30.4
2.4Casting and Curing
For each mix of size 70.6×70.6×70.6mm mortar cubes and of size 250×250×50mm panels were casted, after 24hours the specimens were de-moulded and kept for curing.
2.5Testing
2.5.1Axial compressive strength
The axial compressive strength of panels were determined in accordance with IS 516-1959 after 7 and 28 days curing.
2.5.2Flexural strength
The flexural strength of panels were determined in accordance with IS 516-1959 (two point loading method) after 7 and 28 days curing
3. Results and discussion
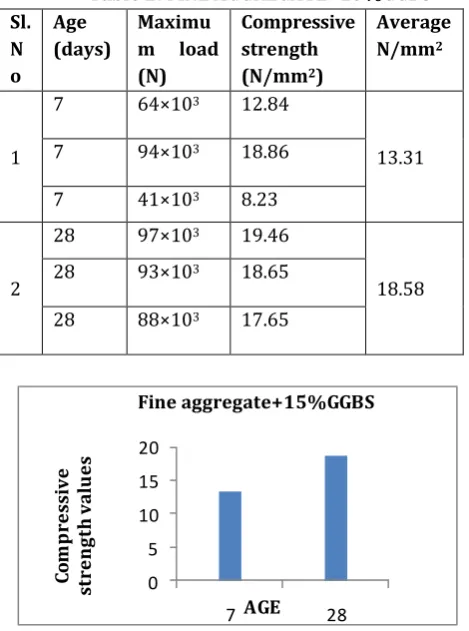
3.1Compressive strength
[image:2.595.38.231.164.292.2]The axial compressive mean strength of the test specimens for mixes A and B at 7 and 28 days are summarized below.
Table 1:FINE AGGREGATE+0%GGBS
Sl.
No Characteristics Results
1 Specific gravity 2.6
2 Fineness modulus 3.14
4 Moisture content (%) 3.1
5 Grading Zone II
Sl. No
Characteristics Values As per IS 12089-1987
1 Normal
Consistency (%)
30 _
2 Initial Setting time(minutes)
58 Not less than 30
3 Final setting
time(minutes)
540 Not more
than 600
4 Specific gravity 2.82 2.92
Sl. No
Age (days)
Maximu m load (N)
Compressive strength (N/mm2)
Average N/mm2
1
7 25×103 5.01
5.336
7 28×103 5.6
7 26×103 5.4
2
28 91×103 18.25
17.25
28 81×103 16.25
© 2018, IRJET | Impact Factor value: 6.171 | ISO 9001:2008 Certified Journal | Page 3111 0
5 10 15 20
7 28
Com
p
ressive
st
rength
val
u
es
AGE
[image:3.595.30.581.25.793.2]Fineaggregate+0%GGBS
Table 2: FINE AGGREGATE+15%GGBS
0 5 10 15 20
7 28
Co
m
p
re
ss
iv
e
st
re
n
gt
h
v
alu
es
AGE
Fine aggregate+15%GGBS
Table 3: FINE AGGREGATE+30%GGBS
17.5 18 18.5 19 19.5 20 20.5 21
7 28
Co
m
p
re
ss
iv
e
st
re
n
gt
h
va
lu
es
AGE
Fine aggregate+30%GGBS
Table 4: FINE AGGREGATE+45%GGBS
25 25.5 26 26.527 27.5 28 28.529 29.530
7 28
C
o
m
pr
es
siv
e
st
re
ng
th
v
a
lue
s
AGE Fine aggregate+45%GGBS Sl.
N o
Age (days)
Maximu m load (N)
Compressive strength (N/mm2)
Average N/mm2
1
7 64×103 12.84
13.31
7 94×103 18.86
7 41×103 8.23
2
28 97×103 19.46
18.58
28 93×103 18.65
28 88×103 17.65
Sl.No
Age
(days
)
Maximum
load (N)
Compressiv
e strength
(N/mm
2)
Aver
age
N/m
m
21
7
97.99×10
319.66
18.56
7
80.94×10
316.24
7
98.89×10
319.84
2
28
100×10
320.06
20.39
28
106×10
321.26
28
99×10
319.86
Sl. No
Age (days)
Maximum load (N)
Compressive strength (N/mm2)
Average N/mm2
1 7 137×103 27.6
26.68
7 125×103 25.23
7 132×103 26.63
2 28 150×103 30.09
29.57
28 149×103 29.89
[image:3.595.31.266.230.546.2]© 2018, IRJET | Impact Factor value: 6.171 | ISO 9001:2008 Certified Journal | Page 3112
Table5: FINE AGGREGATE+60%
30 31 32 33 34 35 36 37
7 28
Co
m
p
re
ss
iv
e
st
re
n
gt
h
va
lu
es
AGE
[image:4.595.31.558.43.753.2]Fine aggregate+60%GGBS
Table 6:FINE AGGRGATE+75%GGBS
0 5 10 15
7 28
Co
m
p
re
ss
iv
e
st
re
n
gt
h
v
alu
es
AGE
Fine aggregate+75%GGBS
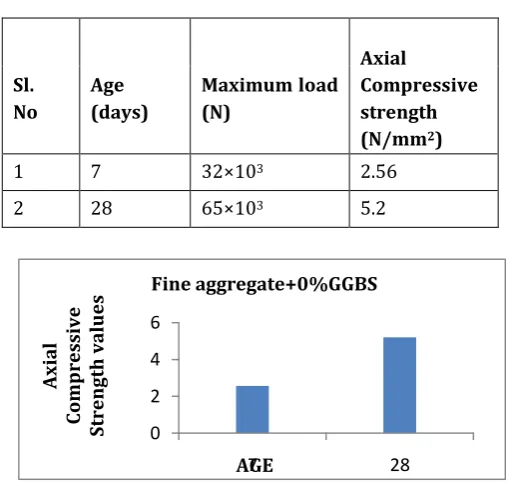
[image:4.595.303.558.292.534.2]AXIAL COMPRESSIVE STRENGTH VARIATIONS AT 7 AND 28 DAYS FOR FERROCEMENT CUBES AT DIFFERENT PROPORTIONS OF GGBS
Table 7:FINE AGGREGATE+0%GGBS
0 2 4 6
7 28
Ax
ia
l
Co
mp
res
si
ve
St
reng
th
va
lu
es
AGE
Fine aggregate+0%GGBS
Table 8: FINE AGGREGATE+15%GGBS Sl.
No Age (days)
Maximum load (N)
Compressive strength (N/mm2)
Average N/mm2
1
7 145×103 29.09
32.57
7 171×103 34.31
7 171×103 34.31
2
28 158×103 31.69
36.17
28 194×103 38.92
28 189×103 37.9
Sl. No
Age (days)
Maximum loadn(N)
Compressi ve strength (N/mm2)
Average N/mm2
1
7 22×103 4.41
5.34
7 26×103 5.21
7 32×103 6.42
2
28 66×103 13.24
11.63
28 57×103 11.43
28 51×103 10.23
Sl. No
Age (days)
Maximum load (N)
Axial
Compressive strength (N/mm2)
1 7 32×103 2.56
2 28 65×103 5.2
Sl. No
Age (days)
Maximum load (N)
Axial
Compressive strength (N/mm2)
1 7 36×103 2.88
© 2018, IRJET | Impact Factor value: 6.171 | ISO 9001:2008 Certified Journal | Page 3113 0
1 2 3 4 5 6
7 28
A
xi
al
co
m
p
re
ss
iv
e
st
re
n
gt
h
v
alu
es
AGE
[image:5.595.28.283.257.505.2]Fine aggregate+15%GGBS
Table 9:FINE AGGREGATE+30%GGBS
0 2 4 6 8
7 28
A
xia
l co
m
p
re
ss
iv
e
st
re
n
gt
h
v
al
u
es
AGE
Fine aggregate+30%GGBS
Table 10:FINE AGGREGATE+45%GGBS
0 2 4 6 8
7 28
A
xi
al
co
m
p
re
ss
iv
e
st
re
n
gt
h
v
alu
es
AGE
[image:5.595.310.565.296.576.2]Fine aggregate+45%GGBS
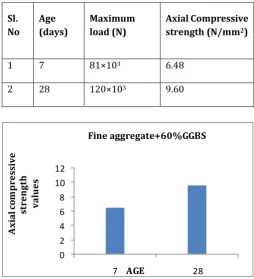
Table 11: FINE AGGREGATE+60%GGBS
0 2 4 6 8 10 12
7 28
A
xi
al
co
m
p
re
ss
iv
e
st
re
n
gt
h
va
lu
es
AGE
Fine aggregate+60%GGBS
Table 12: FINE AGGREGATE+75%GGBS Sl.No Age
(days)
Maximum load (N)
Axial
Compressive strength (N/mm2)
1 7 42×103 3.36
2 28 82×103 6.56
Sl. No
Age (days)
Maximum load (N)
Axial
Compressive strength (N/mm2)
1 7 67×103 5.36
2 28 90×103 7.20
Sl. No
Age (days)
Maximum load (N)
Axial Compressive strength (N/mm2)
1 7 81×103 6.48
2 28 120×103 9.60
Sl. No
Age (days)
Maximum load (N)
Axial Compressive strength (N/mm2)
1 7 12×103 0.96
© 2018, IRJET | Impact Factor value: 6.171 | ISO 9001:2008 Certified Journal | Page 3114 0
1 2 3
7 28
Ax
ial
com
p
ress
iv
e
str
engt
h
va
lu
es
AGE
Fine aggregate+75%GGBS
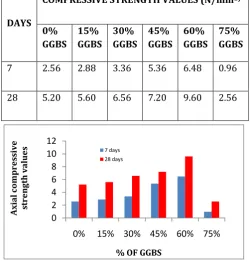
AXIAL COMPRESSIVE STRENGTH VARIATIONS AT 7 AND 28 DAYS FOR FERROCEMENT PANELS AT DIFFERENT PROPORTIONS OF GGBS
DAYS
COMPRESSIVE STRENGTH VALUES (N/mm2)
0% GGBS
15% GGBS
30% GGBS
45% GGBS
60% GGBS
75% GGBS
7 2.56 2.88 3.36 5.36 6.48 0.96
28 5.20 5.60 6.56 7.20 9.60 2.56
0 2 4 6 8 10 12
0% 15% 30% 45% 60% 75%
Ax
ial
com
p
res
si
ve
st
rengt
h
value
s
% OF GGBS
7 days 28 days
3.2Flexural strength
[image:6.595.152.548.53.664.2]The flexural mean strength of the test specimens for mixes A and B at 7 and 28 days are summarized as follows
Table 13: FINE AGGREGATE+ 0% GGBS
0 10 20 30 40 50 60 70
7 28
F
le
x
u
r
a
l
st
r
e
n
g
th
v
a
lu
e
s
AGE
[image:6.595.36.287.264.530.2]Fineaggregate+0%GGBS
Table 14:FINE AGGREGATE+ 15% GGBS
0 20 40 60 80 100 120
7 28
Fle
xu
ra
l s
tre
n
gt
h
va
lu
es
AGE
Fine aggregate+15%GGBS
Table 15:FINE AGGREGATE+ 30% GGBS Sl.
No Age (days)
Maximum Load (N)
Flexural strength (N/mm2)
1 7 26×103 39.00
2 28 37×103 98.67
Sl.N o
Age (days)
Maximum Load (N)
Flexural strength (N/mm2)
1 7 24×103 36.00
2 28 32×103 59.25
Sl.No Age (days)
Maximum Load (N)
Flexural strength (N/mm2)
1 7 50×103 52.08
[image:6.595.315.553.327.553.2]© 2018, IRJET | Impact Factor value: 6.171 | ISO 9001:2008 Certified Journal | Page 3115 0
20 40 60 80 100 120
7 28
Fle
xu
ra
l st
re
n
gt
h
va
lu
es
AGE
[image:7.595.32.277.271.573.2]Fine aggregate+30%GGBS
Table 16:FINE AGGREGATE+45%GGBS
0 20 40 60 80 100 120 140
7 28
Fl
ex
u
ra
l strength
val
u
es
AGE
[image:7.595.304.569.280.546.2]Fine aggregate+45%GGBS
Table 17:FINE AGGREGATE+60%GGBS
0 50 100 150 200 250
7 28
Fl
ex
u
ra
l
str
ength
val
u
es
AGE
Fine aggregate+60%GGBS
Table 18:FINE AGGREGATE+ 75% GGBS
Sl.No Age (days)
Maximum Load (N)
Flexural strength (N/mm2)
1 7 10×103 18.52
2 28 29×103 35.45
0 10 20 30 40
7 28
Fl
ex
u
ra
l
st
reng
th
va
lu
es
AGE
Fine aggregate+75%GGBS
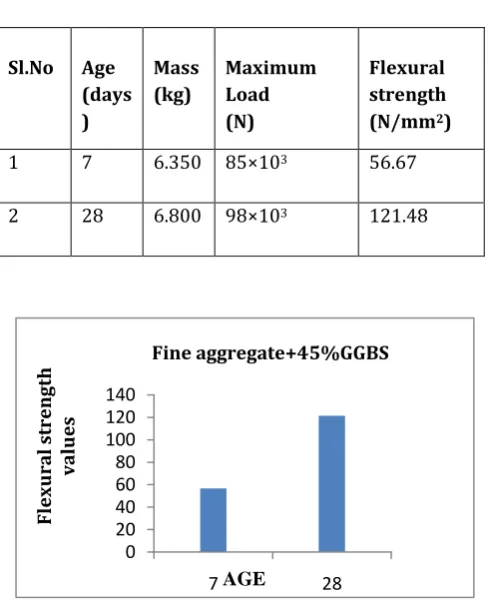
FLEXURAL STRENGHT VARIATIONS AT 7 AND 28 DAYS FOR FERROCEMENT PANELS AT DIFFERENT PROPORTIONS OF GGBS
Sl.No Age (days )
Mass (kg)
Maximum Load (N)
Flexural strength (N/mm2)
1 7 6.350 85×103 56.67
2 28 6.800 98×103 121.48
Sl. No Age (days)
Maximum Load (N)
Flexural strength (N/mm2)
1 7 105×103 86.42
2 28 122×103 202.77
DAYS
FLEXURAL STRENGTH VALUES
0% GGBS
15% GGBS
30% GGBS
45% GGBS
60% GGBS
75% GGBS
7 36.00 39.00 52.08 56.67 86.42 18.52
© 2018, IRJET | Impact Factor value: 6.171 | ISO 9001:2008 Certified Journal | Page 3116
PROPORTIONS OF GGBS
4. Conclusion
The partial replacement of OPC with GGBS improves the workability but causes a decrease in the plastic density of the concrete.
The axial compressive and flexure increases with increasing GGBS content.
As the percentage increased the strength is also increased but only up to 60% further the strength is decreased. An estimate of the cost is also shows that using Ferrocement panel is economical.
Ferrocement elements undergo high deformations before collapse. It has high level of impact and cracking resistances, toughness and ductility.
The ferrocement structures are thin and light weight compared to conventional reinforced concrete, hence there is considerable reduction in self-weight of the structure and saving in foundation cost.
REFERANCES
Journals:
1. Ezzat H. Fahmy, Yousry B. I. Shaheen. Ahmed MahdyAbdelnby and Mohamed N. AbouZeid – “Applying the Ferrocement Concept of Concrete Beams Incrporating Reinforced Mortar Permanent Forrms”. International Journal of Concrete Structures and Materials, Eissn 2234-1315.
2. GursewakDass, MohitTalwar-“Review Paper on Ferrocement in Construction”. International Journal of Advanced Research in Computer Science, ISSN No. 0976-5697.
3. VenuMalgavelli, P. N. Rao-“High Performance Concrete with GGBS and ROBO Sand”.International Journal of Engineering Science and Technology, Vol. 2(10), 2010, 5107-5113, ISSN 0975-5462.
4. ReshmaRughooputh and JaylinaRana-“Partial Replacement of Cement by Ground Granulated Blast
furnace slag in Concrete”. Journal of Engineering Trends in Engineering and Applied Sciences, ISSN 2141-7016.
Books
5. M.S.SHETTY “Concrete Technology” – S. Chand Publication House 2013.
Code of practice:
6. IS10262:1982,recommended guidelines for concrete mix design.
7. IS 456:2000, Plain &Reinforced concrete Code of Practice.
8. IS 12269-2013 “Specification for OPC 53 grade Ordinary Portland Cement”