Volume 50 – No.7, July 2012
Range Optimization Protocol for Efficient Localization
and Data Routing
Sangita V. Kurundkar
Associate Professor, Department of ElectronicsEngineering, Vishwakarma Institute of
Technology,
Pune University, India, 411037.
Atul S. Dhakate
Department of ElectronicsEngineering, Vishwakarma Institute of
Technology,
Pune University, India, 411037.
Animesh S. Kopekar
Department of ElectronicsEngineering, Vishwakarma Institute of
Technology,
Pune University, India, 411037.
ABSTRACT
Over a last few decades there has been a substantial growth in many technical fields, which also cherished the sensors technology, low-power integrated circuits, wireless communications etc. These developments have enabled the design of low-cost, miniature, lightweight and intelligent sensor nodes. We can program these nodes to work according to our requirement and response according to the situation. These nodes are made capable of sensing, processing and communicating. With the rapid advancements in the technologies of software, hardware and communication methods a complete new range of communication network called Mobile Ad-Hoc Network (MANET) is being developed over a last couple of decades. Mobile Ad-Hoc Network holds a tremendous inbound potential, of which a lot has been discovered in the fields of effective bandwidth utilization, link weight awareness (LUNAR, OLSR), multicasting (PUMA), power source awareness, hybrid protocols (HAPR), biology inspired technologies (BISON), table driven and on-demand protocols (AODV), network life time optimization etc. and to these factors the network is made adaptive to the dynamic conditions; yet it is found that a lot of exploration could be done in some areas such as the efficient geometric arrangements of the nodes, method of power efficient routing, localization of the nodes, broadcasting and multicasting techniques, network formation and adaptation abilities and methods. In this paper, a systematic geometric approach to increase the range of a node is discussed. The concept is to temporarily arrange the nodes in specific formations so that the range of any node in the network can be extended virtually, making the data routing efficient in terms of energy consumption, delay, reduce error occurrences and time complexity. Some of the related theoretical results and NS2 simulation results of the geometric approach are discussed.
General Terms
MANETS; Omnidirectional antenna; Localization; Routing.
Keywords
Omnidirectional antenna; Routing; Virtual Grid.
1.
INTRODUCTION
Mobile Ad-Hoc Networks (MANETs) by definition are a
kind of nodes capable of moving in a bounded or unbounded area. These nodes can form ad hoc or decentralised networks without the support of any infrastructure. With the aid of this network (MANET) formation, the nodes of the network can communicate with the other nodes in the network. The nodes equipped with sensors and smart computing processors can sense the ambience for useful information, further aggregate and process the information and transmit the data to other
nodes. The mobility of nodes, collection and aggregation of information, processing of data, localizing the other nodes and communication requires a considerably large amount of energy and thus energy appeals to be one the most crucial parameters in the network formation and prolonged smooth functioning. The nodes of the Mobile Ad-Hoc Networks (MANETs) have a limited supply of energy in the form of batteries they carry and hence it is extremely important to use the energy in very efficient manner to optimise the battery life and hence the life of the Mobile Ad-Hoc Networks (MANETs). From the statistics it could be observed that a large part of the total energy consumed is used in communication as it is one of the primary functions of the MANETS. The nodes are set in mode of random motion hence; the nodes generally do not have a clue of the positions of the other nodes in the network which calls for the function of localization of other nodes by broadcasting, which may further initiate a situation of broadcast storm. This causes the packets to collide and drop and the receiver node calls for the request of retransmission, which causes the reserve of power source to cripple down. To prevent this chaotic situation a systematic geometric approach with range optimization protocol is discussed in this paper and comparative simulation results and theoretical calculations are also provided.
In section II, under the heading of literature survey shows the study of various papers, in Section III the general communication methodology of the omnidirectional antennas is discussed also containing the actual scenario in communication of omnidirectional antennas, and tells about the use of virtual grid navigation system to navigate the nodes while on the move, maintaining a navigation table which will help to locate the nodes instantly in localizing the nodes, section IV proposes a new geometric approach to virtually increase the range of the nodes it also provides the modelling, system architecture and graphical overviewof the protocol, this section also provides a flowchart and algorithm and explains a brief working of the protocol, in section V the simulation of the proposed protocol in NS2 is shown, section VI explain the results and performance analysis of the proposed protocol simulations in NS2. This paper concludes in section VII stating the reduction in conditions of broadcast storming with the use of the proposed algorithm.
2.
LITERATURE SURVEY
nodes in the network, hence there should be an independent system for localization of nodes.
Dinesh Ratan Gautam, Sanjeev Sharma and Santosh Sahu in there paper about “Enhanced Transmission Power Control Mechanism based on RSSI for MANET”, IJCA Aug. 2011 have discussed the issues of power consumption in MANETS. They also proposed a technique to conserve the power of nodes by varying the input power to the transmitting antenna which will vary the range of the node according to the distance of communication.
Jamal N. Al-Karaki and Ahmed E. Kamal in “Efficient virtual-backbone routing in mobile ad hoc networks”, Science Direct, Computer Networks 52 (2008) 327–350, have explained the general unstable topology of MANETS appealing for construction of a stable and robust virtual topology or backbone in the form of virtual grid architecture (VGA) that can be applied to both homogeneous and heterogeneous MANETs.
Shuhui Yang and Jie Wu in there paper of “NEW TECHNOLOGIES OF MULTICASTING IN MANET”, has discussed about the multicasting to be beneficial rather than broadcasting to the nodes. In this case the use of the proposed protocol with multicasting will be more beneficial, as a particular group of nodes in a particular area will be an approach towards the energy efficient multicasting. Further even compared to multicasting less number of nodes will engaged in communication and searching process.
Janusz Kusyk, Elkin Urrea, Cem Safak Sahin, M. Umit Uyar, Giorgio Bertoli and Christian Pizzo, has proposed the use of genetic algorithm and game theory for localization and routing of nodes in “RESILIENT NODE SELF-POSITIONING METHODS FOR MANETS BASED ON GAME THEORY AND GENETIC ALGORITHMS”, The 2010 Military Communications Conference – Unclassified Program – Networking Protocol and Performance Track, IEEE 2010.
In the paper about “Ee-Olsr: Energy Efficient Olsr Routing Protocol For Mobile Ad-Hoc Networks” by Floriano De Rango Marco Fotino and Salvatore Marano, they have enlighten the use of energy efficient proactive and reactive protocols which are helpful in locating the nodes and finding the routing path in short time. They have also used MultiPoint Relays (MPRs) and exchanging Topology Control information further helping in efficient energy utilization.
The study and work carried out implies that a significant amount of energy is utilised in unnecessary broadcasting or rebroadcasting while localizing the nodes. The use of simple search method of a node through broadcasting wastes the precious asset of energy, due to the collision of the packets and triggering the packet drop which make the nodes to call for the Re Route Request (RREQ) and utilise more amount of energy. To overcome these problems a lot of new concepts are discovered such as the use of directional antenna instead of omnidirectional antenna, use of efficient communication techniques as CSMA/CD and CSMA/CA, use of proactive / reactive protocols, table-driven protocols etc. depending on the type of application of the MANETS. In this paper we will mainly focus on a new systematic geometric approach in localizing a node by engaging minimum number of nodes in search process reducing the probability of packet collision and packet drop due to the broadcast storm and thus saving the
energy of the network and enhancing its life time. The beauty of this protocol is that it can also be combined with other protocols to increase the range of the network. In this paper we have considered a combination of the proposed protocol with the well-known AODV protocol and also compared the performances of the two.
3.
COMMUNICATION USING
[image:2.595.328.516.154.349.2]OMNIDIRECTIONAL ANTENNAS
Fig 1: Data routing between two nodes using Omnidirectional.
Figure 1 shows the general graphical radiation pattern of omnidirectional antenna. From figure 1 it is clear that the use of omnidirectional antenna causes interference in the communication of other nodes. This interference further causes the packets to collide and drop creating a broadcast storm situation. To prevent this kind of situation, a systematic geometric approach for broadcasting method of nodes is discussed in this paper.
ACTUAL SCENARIO WHILE COMMUNICATING WITH OMNIDIRECTIONAL ANTENNA
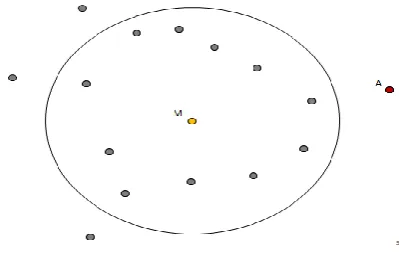
Consider a situation in figure 2 (a), where a master node “M” wishes to communicate with a one of the slave nodes “A” which lies outside the range of the master node. As the nodes are mobile in nature and moreover exhibits a random motion, the master is unlikely to know the position of the slave nodes.
[image:2.595.335.535.576.705.2]Volume 50 – No.7, July 2012
[image:3.595.54.290.67.247.2]Fig 2(b): Other nodes communicating (replying to) with the master node.
Fig 2: A broadcasting storm formed while communication of nodes with each other.
Hence in order to find the location of node A and to communicate with node A, the master broadcasts a message to find the location of node A, to all the nodes in its range. Now, after receiving the message from the master node the slave nodes within the range of the range of the master node will commence the search of node A in their respective areas. All the nodes communicating and broadcasting simultaneously will create a situation of broadcast storming as shown in figure 2 (b). The broadcast storm situation rose due to simultaneous broadcasting of many nodes, results in collision of packets and thus causing the packets to drop. Further when the packets are dropped, there will be re-routing requests and the responses to those again there will be broadcasting. This causes the unnecessary utilization of resources such as the bandwidth and battery power causing the delay in the delivery of the packets and moreover reducing the overall lifetime of the network.
VIRTUAL NAVIGATION GRID
Each node will have map of virtual navigation grid in its memory. At the head start the journey of nodes will be initiated from the same point (called as origin (0, 0)). From the origin the nodes will move randomly. While in the motion each node will count the number of rotation of wheels and the number of turns made (left or right) during their travel. Every node will maintain a table for direction (E, W, N, S), turns (left or right), degrees (+90, -90) and number of wheel rotation between two consecutive turns. This virtual grid could be used as self-guidance system and help the nodes to locate themself.
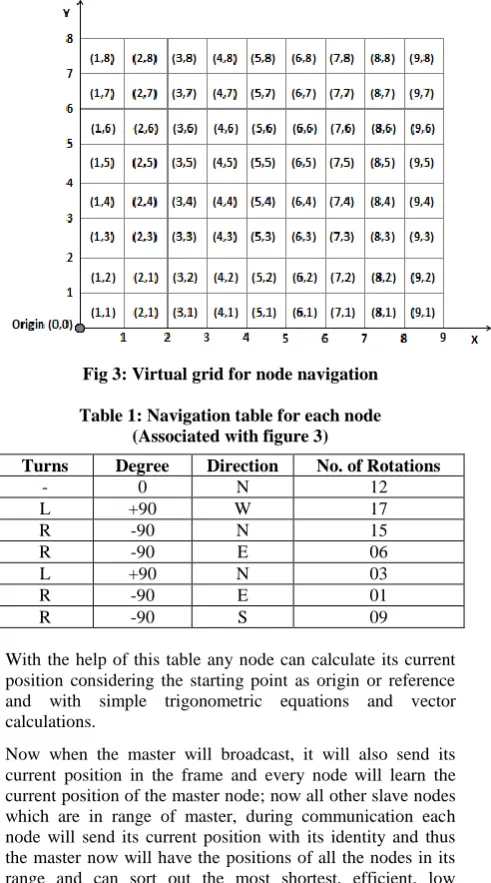
[image:3.595.317.564.85.276.2]Fig 3: Virtual grid for node navigation
Table 1: Navigation table for each node (Associated with figure 3)
Turns Degree Direction No. of Rotations
- 0 N 12
L +90 W 17
R -90 N 15
R -90 E 06
L +90 N 03
R -90 E 01
R -90 S 09
With the help of this table any node can calculate its current position considering the starting point as origin or reference and with simple trigonometric equations and vector calculations.
Now when the master will broadcast, it will also send its current position in the frame and every node will learn the current position of the master node; now all other slave nodes which are in range of master, during communication each node will send its current position with its identity and thus the master now will have the positions of all the nodes in its range and can sort out the most shortest, efficient, low congestion or any other type of path as desired or demanded by the situation. Depending upon the number of nodes available, the master will make a choice of formation and will accordingly order the nodes to take the nearest position from their current position to form a desired formation and optimize the range of the network.
CALCULATIONS INVOLVED IN LOCALIZATION OF NODES
Node (x, y)
r
y
Origin (0, 0) x
A: To calculate the direct distance:
r = √ (x2
+y2) (1)
B: To calculate the angle:
[image:3.595.313.559.88.530.2]θ = tan-1
(y/x) (2)
4.
RANGE OPTIMIZATION
PROTOCOL (R.O.P)
The power radiated by an omnidirectional antenna with a radial range R is given by,
ϕo = PT / (4πR2
) (3)
[2]
Where, PT is the total transmitted power of the signal and ϕo is the power radiated per unit area in the sphere of radius R. This implies if the transmission power of the antenna is increased keeping the gain constant at the receiver end, the range of antenna i.e. the radius R of the sphere will increase.
Modelling, System Architecture and Graphical Overview
Transmission coverage area definition can be directly associated with every transmitter, but the area size and shape is relative to the receiver thresholds. In the proposed model the range of all nodes is assumed to be ideally same, but could be changed by varying the input power supply. A master node “M” is searching for a node “A” in the network which lies outside the communication range of master node. First the master node will search for node A in its own communication range. When the master node is unable to find the slave node A in its range, it will order the nodes in its range to arrange themself in order to form the stage 1 formation of ROP and will tell them to search the node A in the extended range of the network.
When the nodes are arranged in the first stage of the formation as discussed in system architecture, the range of the master node (central node) increases by √2 times R i.e. 41.42% of its actual range in an absolute circular pattern. This increment in range allows the master node to monitor over a larger area on the cost of one hop and four extra nodes. Further only four nodes engaged in search operation, all other nodes in the range R of master node can continue their work without any interruption. This will reduce the condition of packet collision and broadcast storming.
[image:4.595.348.548.108.271.2]The graphical representations of the smart deployment of nodes are shown in following figures.
Figure 4: Graphical formation of 1 + 4 nodes increasing range of the network by 41.42% in stage 1 of ROP
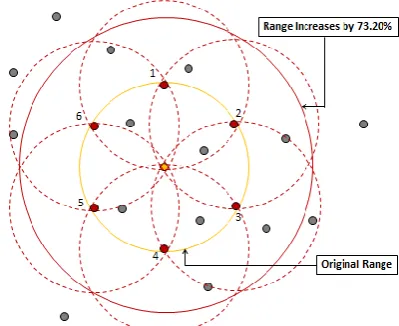
In the second stage, for the second arrangement the total number of nodes used is 1 + 6 = 7. With the second stage arrangement the range of the central node increases by √3
[image:4.595.318.549.458.630.2]times R i.e. 73.20% of its actual range. The second increment in range allows the master node to monitor over a larger area on the cost of one hop and six extra nodes.
Figure 5: Graphical formation of 1 + 6 nodes increasing range of the network by 73.20% in stage 2 of ROP
Again in this stage only the six nodes at the periphery of the range of the central node will be engaged in the search operation and the other nodes will continue their work without participating in the search process dropping the probability of packet collisions and interferences in communication. The third stage arrangement allows the central node to raise its range by 2 times its actual range R i.e. 100.00% increment in the actual range at the cost of 8 extra nodes and two hops, with the formation of 1 + 8 = 9 nodes. Here the third stage is completely based on the first stage; the node deployment in the third stage actually uses the increased range from stage one as its base. Although it’s the virtual range of the central node, the third stage nodes assume it as the actual range of the central node.
[image:4.595.84.286.531.694.2]Volume 50 – No.7, July 2012
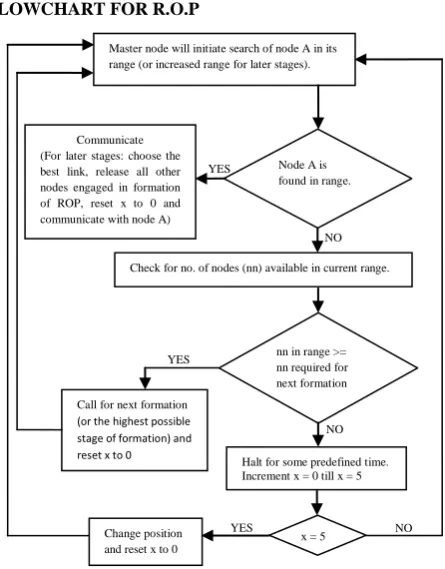
FLOWCHART FOR R.O.P
The flowchart explains the complete logical working of the Range Optimization Protocol (ROP). After initiating the search for node A, master node will search it in its own range, if node A is found master will communicate with it, but if the node A is not found, the master node will search the total number of nodes available in its range. If the number of available nodes in the range is less than the number of nodes required to form the next stage of the formation, the master node will halt for a predefined time interval, increment a variable x by 1 and check the condition whether x is equal to a predefined number (say 5). If the value of x is less than the predefined number, the master node will initiate the complete process from the first step and if the value of x is equal to the value of the predefined number, master node will change its position and reset x to 0 and with the new position, it will commence the search for node A.
If the number of available nodes in the range is greater than or equal to the number of nodes required to form the next stage of the formation, the master node will call for the formation, then it will reset value of x to 0 and begin the search of node a in the increased range of the next stage of ROP.
Now here, the logic can be split in two directions as desire by the master node; it can call for the stages of formation in serial order as stage 1, stage 2, stage 3, stage 4, etc. or depending upon the maximum number of slave nodes available in range it can directly call for the highest possible stage of formation. The later method of forming the highest possible stage of formation directly will engage more number of nodes in the search process but will definitely save the time required searching the node.
After using the sets of formations, when node A is found in the extended range of any stage, the master node will first discover and check all the possible communication links available to the node A and will choose the best one depending on the parameters such as number of hops required, energy of intermediate nodes, priority of other works, link weight, etc. Once a link is chosen, master node will break the
formation and will release all other nodes which were engaged in the formation to resume their work.
ALGORITHM FOR R.O.P
STEP 1: Master node will initiate search of node A in its
range (or increased range for later stages)
STEP 2: IF (node A is found)
{communicate with node A (For later stages: choose the best link, release all other nodes engaged in formation of ROP and communicate with node A)}
STEP 3: ELSE
{check for no. of nodes (nn) available in current range}
STEP 4: IF (nn in range >= nn required for next formation) {call for next formation (or the highest possible stage of formation), reset x to 0 and GOTO STEP 1}
STEP 5: ELSE
{halt for some per defined time and increment x}
STEP 6: IF (x = 5)
{change position, reset x to 0 and GOTO STEP 1}
STEP 7: ELSE {GOTO STEP 1}
5.
SIMULATIONS IN NETWORK
SIMULATOR 2
[image:5.595.61.284.73.358.2]NS2 uses the simple Free Space Propagation Model to simulate MANET protocols. Circular coverage areas can be defined for open-space propagation models, and are a simple common choice for MANET modeling and simulation purposes. In figure 7, the circle radius, cantered on the transmitter position, can be made proportional to the transmission power in an adaptive way. The transmission (coverage) area of a wireless transmitter is the area where the transmitted wireless signal propagates and can be correctly detected and decoded (i.e., transmission is possible with few/no errors due to interference). The interference area of a wireless transmission device is defined as the area where the transmitted wireless signal propagates, without being detected or decoded by any receiver, adding interference and noise to any possible on-going transmission for intended receivers. Transmission areas are included in detection areas, and detection
Figure 7: Communication range of a node
areas are included in interference areas, given the propagation properties of wireless signals in open spaces. The detection area of a wireless transmission device is the area where the signal propagates, and where it can be detected by a carrier sensing mechanism, without being necessarily decoded (i.e., CST ≤ Received Signal Power ≤ RT). Circular coverage areas NO
YES
NO YES
Master node will initiate search of node A in its range (or increased range for later stages).
Node A is found in range. Communicate
(For later stages: choose the best link, release all other nodes engaged in formation of ROP, reset x to 0 and communicate with node A)
Check for no. of nodes (nn) available in current range.
Halt for some predefined time. Increment x = 0 till x = 5 Call for next formation
(or the highest possible stage of formation) and reset x to 0
nn in range >= nn required for next formation
NO YES
Change position and reset x to 0
can be defined for open-space propagation models, and centred on the transmitter position.
The system model can be extended with coverage areas, in order to reduce the transmission-detection overhead and to model much more complex propagation models, depending on the modelling and simulation requirements. Transmission coverage area definition can be directly associated with every transmitter, but the area size and shape is relative to the receiver thresholds. A modelling choice to define if a transmission can be detected by a receiver is to define a receiving threshold (RT) and a carrier-sense threshold (CST) for every node.
THE NS2 SIMULATIONS:
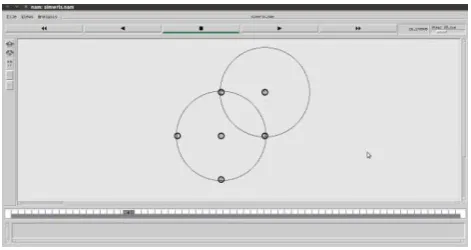
[image:6.595.315.550.71.195.2]The above discussed protocol was simulated in NS 2 for the nine stages shown in the table 2. Following are the screen shots of some of the instances which show the working of the proposed protocol, which works exactly the same as it was proposed to. With these formations, the network behaves in same manner as discussed in section six under the heading “Modelling, System Architecture and Graphical Overview”.
Figure 8: Formation of one + four nodes in NS2 increasing range of the network by 41.42% in stage 1 of ROP
In the above simulation screenshot, the central node has four nodes at its extreme end of transmission range and it directly cannot communicate with the fifth node outside its range. But with this formation central node can extend its range virtually by
[image:6.595.53.289.297.422.2]41.42% and establish a communication link with the node outside its range at a cost of single hop.
Figure 9: Formation of one + six nodes in NS2 increasing range of the network by 73.20% in stage 2 of ROP
In the above simulation screenshot, the central node has six nodes at its extreme end of transmission range. These nodes helps the central node to extend its range by 73.20% and again with a cost of single hop the range of the central node can be virtually increased in a perfectly circular pattern to communicate with the nodes outside its actual range.
Figure 10: Formation of one + eight nodes in NS2 increasing range of the network by 100.00% in stage 3 of
ROP
The above screenshot of NS2 shows the third stage of the range optimizing protocol and with this arrangement the range of the central node can be virtually extended by 100.00% i.e. the range of the central node becomes twice than its actual range at the cost of eight extra nodes and two hops. The third stage is actually an extension of the first stage and is prepared considering the first stage as the base.
6.
RESULTS AND PERFORMANCE
ANALYSIS
On further continuing the same method calculations are made and up to 36 nodes are plotted for different geometric arrangements and the corresponding increment in the effective range of the network is calculated. The table and graph are shown below.
In this graph the red line indicating increment in range of network is plotted against the increment in number of nodes indicated by the blue line.
Graph 1: Increment in number of nodes vs. Increment in range of network
To generalize the two values, an approximation of the calculated values is taken in order to synthesize a generalized equation, using which anyone can calculate the increment in range of their network with the nodes available with them. For the further stages the approximate number of nodes and the increment in the range of the network may be calculated using the generalized equations drawn for them respectively, shown in graph.
A table is shown below for 8 stages of range increment using range optimization protocol.
[image:6.595.53.289.533.657.2]Volume 50 – No.7, July 2012
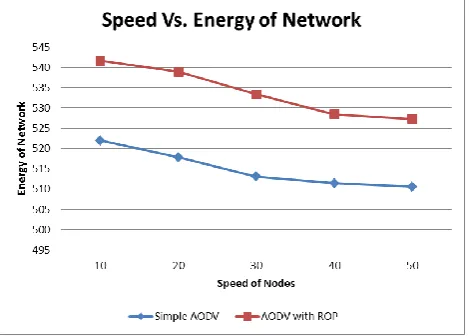
of each node). Graph no.2 is plotted with a formation of 1 + 18= 19 nodes could make and graph no. 3 is plotted with a formation of 1 + 36 = 37 nodes could make; the total numbers of nodes in the networks are 25 and 50 respectively. In the graphs 2 and 3 the red line indicates the average energy of network following the range optimization protocol arrangements while the blue line indicates the average energy of network which does not follow the range optimization protocol arrangements and exhibits complete random motion.
[image:7.595.55.290.588.756.2]At every stage it could be seen that the total energy of network following the range optimization protocol arrangements dominates the total energy of network not following the range optimization protocol arrangements. Further with the increase in number of nodes the drop rate of energy level becomes less even with the increase in speed of nodes. This is because with the higher (but optimum) number of nodes engaged in the formation, more number of links becomes available and the packet collision and broadcast storming is thus reduced, saving the total energy of network.
Table 2: Range Optimization Protocol Table (Associated with figures 4, 5, 6 and graph 1)
Graph 2: Speed of nodes vs. Energy of nodes for 25 number of nodes with formation of 1 + 18 = 19 nodes using
AODV
Graph 3: Speed of nodes vs. Energy of nodes for 50 number of nodes with formation of 1 + 36 = 37 nodes using
AODV
Graph 4: Speed of nodes vs. Energy of nodes for 25 number of nodes with formation of 1 + 18 = 19 nodes using
DSDV
7.
CONCLUSION
In spite of the problems of interference and broadcast storming, the omnidirectional antennas still holds an inseparable part of Mobile Ad-Hoc Network (MANET). Some of the techniques have been developed to avoid the packet collisions; to make it more efficient and accurate the combined use of the proposed protocol will prove to be more beneficial.
Further the use of range optimizing protocol will increase the range of the network in a perfectly circular pattern; using minimum number of nodes providing wide range of flexibility in choosing the range of the network. With the minimum number of nodes engaged in search operation while optimising the range, the packet collisions and broadcast storming will also be reduced resulting in saving the total
Stage No. of Nodes
Before Increment No. of Node Added
No. of Nodes
After Increment Range of Network
% Increment in Range
0 1 0 1 + 0 = 1 R 0.00%
1 1 4 1 + 4 = 5 √(2) x R 41.42%
2 5 2 5 + 2 = 7 √(3) x R 73.20%
3 7 2 7 + 2 = 9 2 x R 100.00%
4 9 4 9 + 4 = 13 [1 + √(2)] x R 141.42%
5 13 6 13 + 6 = 19 √(7) x R 164.57%
6 19 2 19 + 2 = 21 2 x √ (2) x R 182.28%
7 21 8 21 + 8 = 29 √(10) x R 216.22%
energy of the network and enhancing the total lifetime of the network.
Finally we conclude that the use of range optimisation protocol would be beneficial to avoid the unnecessary broadcasting of nodes, which will eventually reduce the packet collision, re-route requests, errors and thus will also help to save the precious battery power, enhancing the total life time of the network. Due to these modifications, noticeable improvement in reducing the interference to simulate large mobile ad hoc networks is realized in this paper. This improvement will allow faster simulation for large scale scenarios.
Graph 5: Speed of nodes vs. Energy of nodes for 50 number of nodes with formation of 1 + 36 = 37 nodes using
DSDV
8.
REFERENCES
[1] Avik Ray, Kanad Basu, Samir Biswas and M.K.Naskar, “A Novel Distributed Algorithm for Topology Management in Mobile Ad-hoc Networks”, 3rd International Conference on Computers and Devices for Communication (CODEC-06) Institute of Radio Physics and Electronics, University of Calcutta, December 18-20, 2006.
[2] Dinesh Ratan Gautam, Sanjeev Sharma and Santosh Sahu “Enhanced Transmission Power Control
Mechanism based on RSSI for MANET”, IJCA vol. 28, Aug. 2011.
[3] Jamal N. Al-Karaki and Ahmed E. Kamal in “Efficient virtual-backbone routing in mobile ad hoc networks”, Science Direct, Computer Networks 52 (2008) 327–350.
[4] Shuhui Yang and Jie Wu, “NEW TECHNOLOGIES OF MULTICASTING IN MANET”.
[5] Janusz Kusyk, Elkin Urrea, Cem Safak Sahin, M. Umit Uyar, Giorgio Bertoli and Christian Pizzo, “RESILIENT NODE SELF-POSITIONING METHODS FOR MANETS BASED ON GAME THEORY AND GENETIC ALGORITHMS”, The 2010 Military Communications Conference – Unclassified Program – Networking Protocol and Performance Track, IEEE 2010.
[6] Floriano De Rango, Marco Fotino, Salvatore Marano, “EE-OLSR: ENERGY EFFICIENT OLSR ROUTING PROTOCOL FOR MOBILE AD-HOC NETWORKS”, IEEE 2008.
[7] Hai Liu, Pengjun Wan, and Xiaohua Jia “Maximal Lifetime Scheduling for Sensor Surveillance Systems with K Sensors to One Target”, IEEE TRANSACTIONS ON PARALLEL AND DISTRIBUTED SYSTEMS, VOL. 17, NO. 12, DECEMBER 2006.
[8] D.S. Thenmozhi and M. Rajaram Department of Computer Science, Institute of Road and Transport Technology, Erode, Tamilnadu, India Anna University, Tirunelveli, Tamilnadu, India, “An Effective Contention Aware Stable Path Finding Approach to Provide Quality of Service in Mobile Ad hoc Networks”, Journal of Computer Science 7 (3): 352-358, 2011, ISSN 1549-3636, © 2011 Science Publications.
[9] Ram Ramanathan, Senior Member, IEEE, Jason Redi, Senior Member, IEEE, Cesar Santivanez, Member, IEEE, David Wiggins, and Stephen Polit “Ad Hoc Networking With Directional Antennas: A Complete System Solution”, IEEE JOURNAL ON SELECTED AREAS IN COMMUNICATIONS, VOL. 23, NO. 3, MARCH 2005.