www.impactjournals.com/oncotarget/ Oncotarget, Vol. 7, No. 48
Metformin treatment reduces temozolomide resistance of
glioblastoma cells
Seung Ho Yang1,2,3,*, Shenglan Li1,3,*, Guangrong Lu1, Haipeng Xue1,3, Dong H. Kim1,3, Jay-Jiguang Zhu1,**, Ying Liu1,3,**
1Department of Neurosurgery, McGovern Medical School, University of Texas Health Science Center at Houston, Houston, Texas, USA
2Department of Neurosurgery, St. Vincent's Hospital, College of Medicine, The Catholic University of Korea, Suwon, South Korea
3Center for Stem Cell and Regenerative Medicine, The Brown Foundation Institute of Molecular Medicine, University of Texas Health Science Center at Houston, Houston, Texas, USA
*These authors contributed equally to this work **These authors contributed equally to this work
Correspondence to: Jay-Jiguang Zhu, email: jay.jiguang.zhu@uth.tmc.edu Ying Liu, email: ying.liu@uth.tmc.edu
Keywords: glioblastoma, metformin, temozolomide resistance, SOX2, global gene expression
Received: September 07, 2016 Accepted: October 14, 2016 Published: October 24, 2016
ABSTRACT
It has been reported that metformin acts synergistically with temozolomide (TMZ) to inhibit proliferation of glioma cells including glioblastoma multiforme (GBM). However, the molecular mechanism underlying how metformin exerts its anti-cancer effects remains elusive. We used a combined experimental and bioinformatics approach to identify genes and complex regulatory/signal transduction networks that are involved in restoring TMZ sensitivity of GBM cells after metformin treatment. First, we established TMZ resistant GBM cell lines and found that the resistant cells regained TMZ sensitivity after metformin treatment. We further identified that metformin down-regulates SOX2 expression in TMZ-resistant glioma cells, reduces neurosphere formation capacity of glioblastoma cells, and inhibits GBM xenograft growth in vivo. Finally, the global gene expression profiling data reveals that multiple pathways are involved in metformin treatment related gene expression changes, including fatty acid metabolism and RNA binding and splicing pathways. Our work provided insight of the mechanisms on potential synergistic effects of TMZ and metformin in the treatment of glioblastoma, which will in turn yield potentially translational value for clinical applications.
INTRODUCTION
Glioblastoma multiforme (GBM) is the most prevalent and deadly primary malignant brain tumor, with a median overall survival of 14.6 months [1]. Current treatments of GBM include maximum safe craniotomy, radiotherapy, and chemotherapy. Temozolomide (TMZ) is the main drug in chemotherapy regimens for newly diagnosed GBM. TMZ induces double-stranded DNA breaks in tumor cells and acts via interference with the DNA mismatch repair (MMR) pathway [2, 3]. Despite aggressive therapies, GBM recurrence is inevitable in most GBM patients [4]. This is partly due to the development of TMZ resistance, which is mediated by multiple possible
mechanisms, including increased activity of DNA repair enzyme, O6-methylguanine DNA methyltransferase
(MGMT) [5, 6], amplification or mutations of the
epidermal growth factor receptor (EGFR) gene [7], mutations of tumor suppressor genes TP53 and PTEN [8, 9], and aberrant miRNA expression [10]. Although different therapeutic molecules have been developed to target these pathways and have demonstrated promising results from both in vitro and in vivo experimental models,
these strategies often showed limited efficacy and/or
intolerable side effects when applied to GBM patients. Recent work has shown that metformin, an FDA approved diabetic medication, could have anti-cancer effects in patients with a variety of anti-cancer types
including breast cancer, pancreatic cancer, colon cancer, and ovarian cancer [11–14]. In addition, metformin might have synergistic effects with TMZ treatment and enhance
chemotherapy efficacy in GBM [15–17], which opens
a new avenue to overcome TMZ resistance in glioma
treatment. As an inexpensive, well-tolerated, first-line
anti-diabetic oral drug, metformin has been reported
to significantly reduce gluconeogenesis in the liver and
increase insulin receptor sensitivity and glucose uptake in peripheral tissues. In addition, metformin also functions along the fatty acid metabolism pathway by de-repressing fatty acid oxidation.
Several potential mechanisms have been investigated attempting to explain the anti-cancer effects
of metformin. Previous reports have identified metformin
playing a role in activating AMP-activated protein kinase (AMPK)-mammalian target of rapamycin (mTOR) signaling pathway, which is important in regulating cancer cell survival, proliferation and apoptosis, as well as the process of epithelial-to-mesenchymal cells transition (EMT) phenotype [12–14]. As AKT phosphorylation is implicated in TMZ drug resistance [18, 19], it is possible that metformin might act via inhibition of AKT phosphorylation in cancer cells, thus inhibiting cancer proliferation, metastasis, and drug resistance [16, 20]. Metformin has also been found to reverse or reduce drug resistance through inhibition of insulin-like growth factor-1-receptor (IGF1R) [21, 22].
To investigate the potential mechanisms of how metformin functions with TMZ and identify molecular changes in gene expression regulatory networks in GBM, we developed two TMZ-resistant glioblastoma cell lines, and compared proliferation, neurosphere formation, and invasion capacity of metformin treated, TMZ-resistant cells with their corresponding parental cells. Our results demonstrate that metformin might function through multiple pathways in partial restoration of TMZ sensitivity in glioblastoma cells, which subsequently enhances chemotherapy effects of TMZ.
RESULTS
Generation of TMZ-resistant glioblastoma cell lines
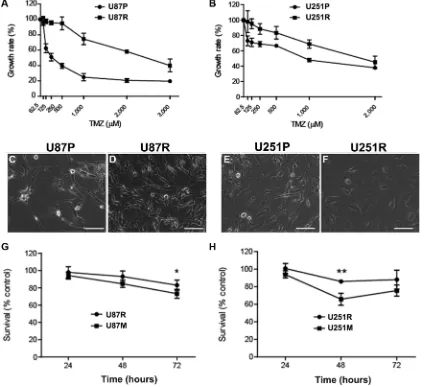
Glioblastoma cell lines U87 and U251 (named as U87P and U251P for parental cell lines. Nomenclature of all cell lines is listed in Supplementary Table S1) were treated with TMZ with gradually increasing doses, starting from 50 µM to 600 µM, over a period of 8–10 months. IC50 (half or 50% minimal inhibitory concentration) was used to monitor the change of their resistance properties. Before TMZ treatment induction, IC50 of U87P was 325 µM. At the end of the treatment, IC50 has increased by 2.6 folds and reached 1,165 µM. Similarly, IC50 for U251P was 722 µM, while the cells obtained after TMZ induction
showed an IC50 of 1,994 µM, a nearly 2-fold increase compared to the parental line. It is worth noting that once established, both TMZ-resistant cell lines maintained strong resistance to further TMZ treatment. These cell lines with higher IC50’s were therefore named U87R and U251R, respectively, and they were used in experiments described in the current work (Figure 1A, 1B). The resistant GBM cells showed similar proliferation rate and doubling time comparing to their respective parental cell lines, U87P and U251P, although changes in morphology were noted after acquisition of TMZ resistance. U87R cells showed enlarged cytoplasm and curved cellular processes. U251R cells became elongated and pleomorphic with varied sizes of the cytoplasm and bamboo-like processes (Figure 1C–1F).
Metformin partially restores TMZ sensitivity in TMZ-resistant glioblastoma cell lines
To test whether pre-conditioning of TMZ resistant cells with metformin will be able to reverse the drug
resistance, U87R and U251R cells were first treated with
metformin (1 mM) for 2 weeks, then they were exposed to TMZ (50 µM) for 24, 48, and 72 h, respectively. Fifty µM of TMZ was chosen because this dosage is known to be clinically relevant [23]. Cell survival rate was measured at 24, 48, and 72 h time points. While both U87R and U251R showed a high survival rate of about 80–100% after 3 days
of TMZ treatment, the survival rate dropped significantly
for the cells that were pre-treated with metformin (Figure 1G, 1H). For U87R, 98%, 93.1%, and 83.1% of cells survived TMZ treatment at 24, 48, and 72 h, respectively, while the cells that were pre-conditioned with metformin (hence named as U87M) responded to TMZ treatment, and only 94.3%, 84.7%, and 73.3% of cells were viable at 24, 48, and 72 h, respectively. U251R cells exhibited a similar trend. About 100%, 86%, and 88.2% of cells survived TMZ treatment at 24, 48, and 72 h, respectively, while the cells that were pre-treated with metformin (hence named as U251M) responded to TMZ treatment, and only 94%, 65.8%, and 75.7% of cells were able to survive at 24, 48, and 72 h time points, respectively. It is interesting to note that although cell numbers kept decreasing as TMZ treatment continued over the 3-day period in U87R cells,
the time course profile was different for U251R cells in
that pre-treatment with metformin can convert TMZ-resistant cells into a state in which they are susceptible to
a clinically efficacious concentration of TMZ.
Metformin reduces the capability of migration and invasion of TMZ-resistant glioblastoma cells
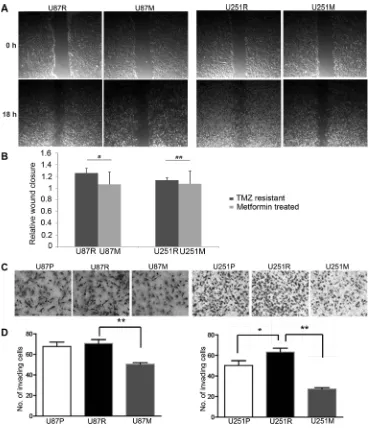
In addition to testing the effect on general response to TMZ treatment with metformin pre-conditioning, we examined the effects of metformin on both migration and invasion capabilities of TMZ resistant cells using wound-healing scratch assays. Both U87R and U251R underwent 2 weeks of metformin (1 mM) pre-treatment (hence the resultant cell lines named as U87M and U251M), and were tested for wound-healing capacity. Eighteen hours after
the scratch, wound healing capacities were significantly
reduced in both cell lines, reaching 10-fold (p < 0.05) and
3-fold (p = 0.07) reduction for U87M and U251M cells, respectively (Figure 2A, 2B). These results suggest that metformin was able to weaken the migration capacity of TMZ drug resistant glioblastoma cells.
[image:3.612.96.522.272.659.2]To examine the effects of metformin on invasion capability of glioblastoma cells, we conducted chamber invasion assay in U87 and U251 parental (U87P and U251P), TMZ-resistant (U87R and U251R), and TMZ-resistant cells pre-conditioned with metformin (1 mM) treatment (U87M and U251M) for two weeks. Phase images of invading cells through transwell were captured and the number of invading cells was counted and analyzed (Figure 2C, 2D). We found both U87R and U251R were more capable of invading through the transwells than their parental cells. Metformin pre-treatment for two weeks, however, profoundly inhibited the capacity of tumor invasion for both U87R and U251R
Figure 1: Metformin reduces temozolomide (TMZ) resistant glioblastoma cells. (A, B) Generation of TMZ-resistant U87R (A) and U251R (B) glioblastoma cell lines by extended TMZ treatment. IC50 of resistant cells is > 2-fold higher than thatof the parental
cells. Interestingly, the invasion capacity of metformin treated TMZ-resistant cells was even lower than the two parental lines, indicating that metformin might exert direct inhibition for cell invasion in addition to working via the pathways that are activated by TMZ.
Metformin down-regulates SOX2 expression and reduces the formation of neurospheres in TMZ-resistant glioblastoma cells
SOX2 has been reported to play a pivotal role in developing drug resistance during glioblastoma treatment [24, 25]. To test any changes of SOX2 gene
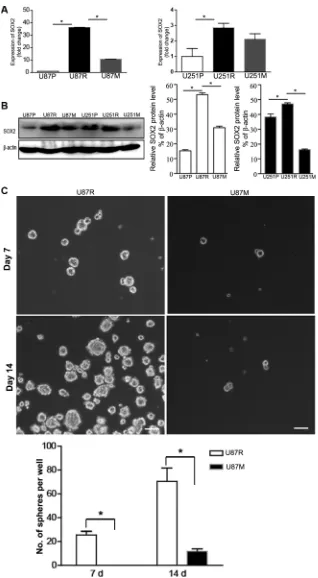
expression in TMZ-resistant and metformin treated cells, we performed qRT-PCR and Western blot analysis to examine the expression of SOX2 at both the mRNA and protein levels, in U87P, U87R, and U87M, as well as U251P, U251R, and U251M, respectively. Compared to U87P and U251P, SOX2 mRNA expression was
significantly greater in TMZ-resistant U87R and U251R
cells. In contrast, SOX2 mRNA expression level was lower in U87M and U251M cells (Figure 3A). These
findings support the hypothesis that metformin treatment
[image:4.612.121.491.225.654.2]partially restored TMZ sensitivity. Consistent with the qRT-PCR result, Western blot analysis showed that SOX2 protein levels were elevated in U87R and U251R,
while the protein levels were reduced in U87M and U251M (Figure 3B).
SOX2 is a neural stem cell marker. Neurosphere formation assay is often used to evaluate the proliferation and self-renewal capacity of neural stem cells and glioma cancer stem cells. To test the effects of metformin on potential cancer stem cell properties, we performed neurosphere formation assays on U87P, U87R, and U87M. Since U251 cells do not form neurospheres, we only performed neurosphere formation assay on U87 cells. An
equal number of cells (~100 cells/well of a 6-well plate)
was grown on ultra-low attachment plates in serum free medium to encourage sphere formation. The number of neurospheres sized > 50 µm in diameter was counted at both Day 7 and Day 14 time points. TMZ-resistant cells showed robust neurosphere formation and had on average of 26 ± 4 spheres per well on Day 7 and 70 ± 10 spheres per well on Day 14 (Figure 3C). The metformin pre-treated group, U87M, however, could not form neurospheres on Day 7 and Day 14 by the same criteria for U87R. They
only formed significantly reduced numbers of very tiny
clumps (Figure 3C, p < 0.05).
Metformin inhibits tumor growth in vivo
To evaluate tumor growth capacity in vivo, we
injected glioblastoma cells into the lower flank of severe combined immunodeficiency (SCID) mice. The mice
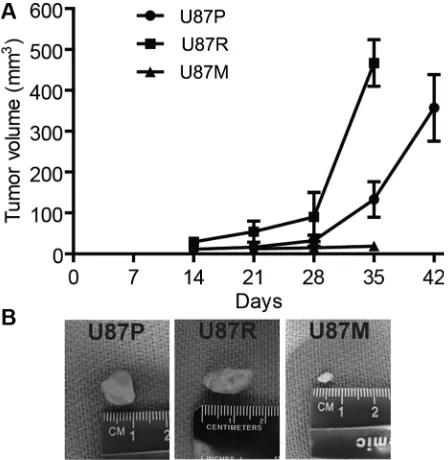
were randomly divided into 3 groups to receive U87P, U87R, and U87M cells. Tumor volume in the U87P group
gradually expanded during the first month post injection,
accelerated in the second month, and reached ~360 mm3
at 6 weeks post injection. TMZ-resistant U87R cells
generated tumors of a similar size during the first month,
but in the second month, the tumor size quadrupled,
indicating that TMZ-resistant cells had significantly
greater growth capacity. In contrast, tumors from U87M, the metformin treated TMZ-resistant cells, showed slower growth rate and formed much smaller tumors compared to both U87P and U87R cells, as tumors generated from U87M only had a mere volume of 10 mm3 at 5 weeks post
injection, consistent with previous reports that metformin acted to attenuate tumorigenicity of glioblastoma cells (Figure 4A, 4B).
Global gene expression profiling reveals that multiple pathways are involved in metformin treatment related changes
To better understand the mechanism of metformin restoration of TMZ sensitivity of glioblastoma cells and identify potential pathways that contribute to TMZ resistance and the metformin reversal of such resistance in both U87 and U251 cells, we performed
genome-wide gene expression profiling using Illumina bead
array platform, sorted out differentially expressed genes
(DEGs), and constructed networks based on DEGs. Two biological replicates of U87P, U87R, and U87M, as well as U251P, U251R, and U251M were included in the analysis.
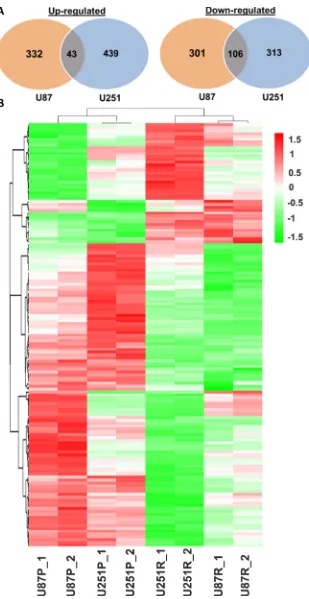
We first obtained the gene expression profiles of
TMZ-resistant and parental lines (U87R vs. U87P; U251R vs. U251P). Compared with U87P, 375 genes were up-regulated and 407 genes were down-up-regulated in U87R cells. In parallel, compared with U251P, 482 genes were up-regulated and 419 genes were down-regulated in U251R cells. Of these genes, 43 genes were commonly up-regulated in both U87R and U251R, while 106 genes were commonly down-regulated in both cell lines (Figure 5).
A review of the top 10 genes that were expressed higher in U87R than in U87P (Supplementary Table S2) revealed that many of the genes have been previously
identified as associated with chemoresistance or have been
proposed as biomarkers for a variety of tumors including gliomas and GBM, thus validating our approach of identifying these genes by microarrays. These DEGs were then analyzed for Gene Ontology (GO) terms and KEGG pathways.
Compared to U87P, in U87R lines, 4 cellular component (CC) terms involving vacuole, lysosome, and mitochondrial functions were up-regulated, demonstrating that these components might contribute to TMZ resistance. From the down-regulated DEGs list, 17 biological process (BP) terms, 6 CC terms, and 2 molecular function (MF) terms were shown. These terms are associated with
wound response, inflammatory response, or cytokine
activity. Most interestingly, both cell proliferation and anti-apoptosis processes were down-regulated in U87R compared to U87P, indicating the complex nature of TMZ resistance. Nucleotide-binding oligomerization domain (NOD) like receptor signaling pathway, which is involved in cell response to stress, is also down-regulated. This observation is consistent with GO analysis as several endoplasmic reticulum stress (ER stress) terms were down-regulated (Table 1).
In the comparison of U251R and U251P cells, no
GO terms or KEGG pathways were identified in
up-regulated DEGs, while 24 BP terms, 10 CC terms, 9 MF terms and 1 KEGG pathway were found to be altered from the down-regulated DEGs list. Similar to U87 lines, these GO terms were mainly involved in ER stress and anti-apoptosis (Table 1), indicating that these components are commonly involved in the development of TMZ resistance. Overlapping GO terms from the comparison of U87R vs. U87P, and U251R vs. U251P lines are all related to ER stress pathways.
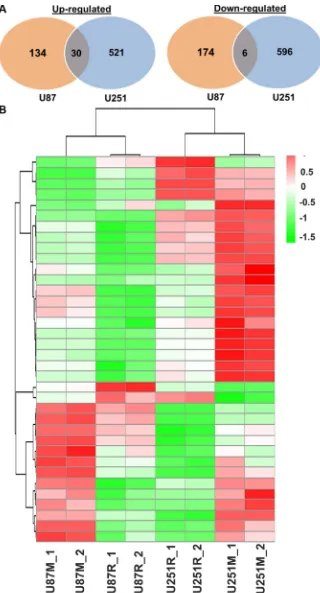
Next, we compared gene expression profiles of
commonly down-regulated in both U87M and U251M cell lines (Figure 6).
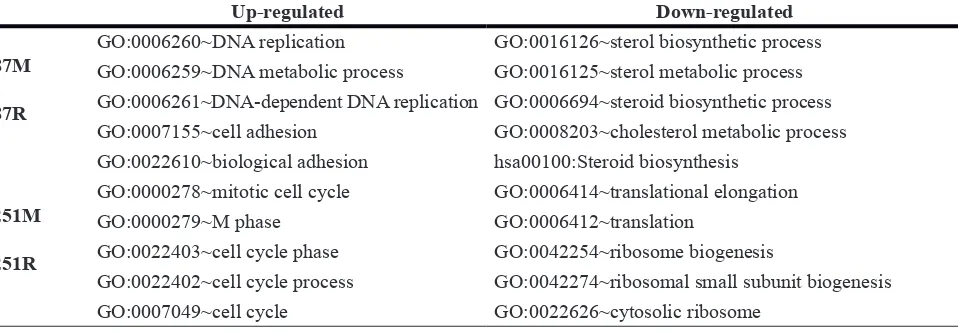
The two cell lines responded to metformin treatment in a distinct manner. The top 10 DEGs are listed in Supplementary Table S3. In GO analysis of U87M vs. U87R, 5 BP terms, 4 CC terms, and 1 KEGG pathway were extracted in up-regulated DEGs, while 4 BP terms and 1 KEGG pathway were obtained from the down-regulated DEGs. The up-down-regulated genes were related to DNA replication and cell adhesion while the down-regulated genes were associated with steroid biosynthesis (Table 2). In GO analysis of U251M vs. U251R, 29 BP terms, 13 CC terms, and 1 KEGG pathway were obtained from up-regulated DEGs, which are mainly related to cell cycle regulations. Of the 4 BP terms, 12 CC terms, 5 MF terms, and 1 KEGG pathway extracted from the
down-regulated DEGs, ribosome and protein translation pathways are the major objects of repression (Table 2).
Metformin partially reverses gene expression in TMZ-resistant glioblastoma cells
To further characterize pathways on which metformin might act to reverse TMZ resistance, we
identified genes that were differentially expressed (up-
or down-regulated) in TMZ resistant cells which were later reversed after metformin treatment. When the cutoff was set to gene expression fold change larger than 1.2 and the p value was less than 0.05, a total of 415 genes
were identified as being reversed by metformin treatment
[image:7.612.58.555.63.214.2]in U87 cell lines. Of those, 229 genes were up-regulated in U87R and reversed in U87M cells; 186 genes were
[image:7.612.194.418.453.683.2]Figure 4: Metformin treatment reduces tumor growth in mouse xenografts. (A) Tumor volume is measured along the time course of post injection of U87P, U87R, and U87M cells, respectively. U87P and U87R cells generate tumors of similar sizes, while U87M cells show slow growth rate and form much smaller tumors. Representative tumor images of each group are shown in (B).
Table 1: Top 5 GO terms and pathways between TMZ-resistant and parental cell lines
Up-regulated Down-regulated
U87R vs. U87P
GO:0005773~vacuole GO:0009611~response to wounding GO:0005764~lysosome GO:0006954~inflammatory response
GO:0000323~lytic vacuole GO:0008285~negative regulation of cell proliferation GO:0005739~mitochondrion hsa04621:NOD-like receptor signaling pathway
U251R vs. U251P
GO:0042592~homeostatic process
GO:0006984~ER-nuclear signaling pathway GO:0010941~regulation of cell death GO:0006916~anti-apoptosis
down-regulated in U87R and reversed in U87M (Figure 7A, Supplementary Table S4). A total of 561 genes were
identified as being reversed in U251 cell lines, with 362
genes up-regulated in U251R and reversed in U251M, and 199 genes down-regulated in U251R and reversed in U251M cells (Figure 7B, Supplementary Table S5).
To further explore potential regulatory networks among the reversed genes, we retrieved protein-protein interactions (PPI) of these genes from the String database and reconstructed the PPI network using Cytoscape software. A total of 158 reversed genes formed 367 interactions in U87 cells and 334 reversed genes formed 790 interactions in U251 cells (Supplementary Figures S1, S2). It was found these reversed genes worked together, interacting as a large network during the process of metformin reversal of TMZ resistance.
In the co-regulated genes, several networks (clusters of genes) were formed based on the analysis
of MCODE, a plugin of Cytoscape that identifies highly interconnected clusters within a defined set of genes.
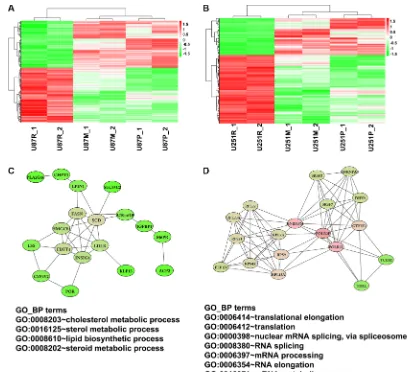
From these tightly clustered networks, we noticed a sub-network of genes involving lipid biosynthetic and cholesterol metabolic process (Figure 7C). This sub-network comprises 18 genes, including those that are
responsible for fatty acid synthesis and modifications,
such as FASN (fatty acid synthase) and SCD (stearoyl-CoA desaturase or delta-9-desaturase). They are co-regulated in the same direction, i.e., up-co-regulated when treated with TMZ but down-regulated when treated with metformin, indicating that they play a role in drug resistance and metformin’s reversal of such resistance.
SCD gene, encoding Δ9 desaturase, one of the two fatty
acid desaturases [26], has 8 immediate connections
(edges), specifically to LPIN1 (lipin 1), low density LDLR (lipoprotein receptor), LSS (lanosterol synthase),
CYP4V2 (cytochrome P450, family 4, subfamily V, polypeptide 2), POR (cytochrome P450 oxidoreductase), IGFBP1 (insulin-like growth factor binding protein 1), and INSIG1 (insulin induced gene 1).
Another closely-interconnected cluster of 18 genes was up-regulated after TMZ treatment but down-regulated after cells were treated with metformin (Figure 7D). This cluster includes 6 RNA binding and splicing proteins HNRNPM (heterogeneous nuclear ribonucleoproteins M) and HNRNPA0 (heterogeneous nuclear ribonucleoproteins
A0), SRSF3 (serine/arginine-rich splicing factor 3), SRSF7 (serine/arginine-rich splicing factor 7), DHX9
(DEAH-Box Helicase 9), GTF2F2 (general transcription factor IIF subunit 2). It also has a group of translation
regulatory genes including ribosomal protein RPL7A, RPL13A, RPL22, RPL23A, RPS4X, RPS9, RPS21, polymerase (RNA) II subunit POLR2L, POLR2F, and
EEF1D (eukaryotic translation elongation factor 1 delta). Function enrichment analysis shows that these clustered genes participate in translational elongation and nuclear mRNA splicing.
DISCUSSION
In this study, we generated TMZ-resistant glioblastoma cell lines and showed that metformin could partially restore TMZ sensitivity in TMZ-resistant cells. In addition, metformin reduced migration and invasion capacities of TMZ-resistant glioblastoma cells. We found that metformin down-regulated SOX2 expression in TMZ-resistant glioblastoma cells, reduced the formation of neurospheres by glioblastoma cells, and inhibited tumor growth in vivo. Most compelling, we performed global
gene expression profiling of this set of glioblastoma cell
lines, which revealed that multiple pathways might be involved in metformin treatment-related changes.
It was further shown that stem-like properties of GBM cells contribute to chemo-resistance to TMZ [27].
Transcription factor SOX2 has been identified as an
oncogene in many cancers and plays important roles in cancer stem cells (CSC), EMT, and metastasis of cancer cells.
[image:8.612.73.552.65.231.2]The downstream mechanisms that specifically drive SOX2-dependent invasion in glioblastoma remain to be identified.
Table 2: Top 5 GO terms and pathways between metformin treated and TMZ-resistant cells
Up-regulated Down-regulated
U87M vs. U87R
GO:0006260~DNA replication GO:0016126~sterol biosynthetic process GO:0006259~DNA metabolic process GO:0016125~sterol metabolic process GO:0006261~DNA-dependent DNA replication GO:0006694~steroid biosynthetic process GO:0007155~cell adhesion GO:0008203~cholesterol metabolic process GO:0022610~biological adhesion hsa00100:Steroid biosynthesis
U251M vs. U251R
GO:0000278~mitotic cell cycle GO:0006414~translational elongation GO:0000279~M phase GO:0006412~translation
GO:0022403~cell cycle phase GO:0042254~ribosome biogenesis
Recently, it was reported that E3 ubiquitin ligase CDC20-APC interacts with and regulates SOX2 protein to promote SOX2-dependent transcription and drive glioma stem cell invasiveness and self-renewal [28]. The inhibition of cell growth was found to be due to changes in the cell cycle, and
inhibition of SOX2 has led to cell cycle arrest in G2/M phase
and translated into a lower cell migration rate [29]. Attenuated S-phase entry was observed in human glioma cells upon inhibition of SOX2 [30]. The mechanisms that contribute to elevated SOX2 levels in resistant cancers are not fully understood. Ectopic expression of SOX2 in breast cancer cells renders them more resistant to tamoxifen treatment
in vitro and in vivo, and is associated with an increase in the frequency of stem cells and capacity for invasion [31]. Treatment of medulloblastomas in mice with an anti-mitotic drug or sonic hedgehog (SHH) pathway inhibitor resulted in residual tumors that were enriched in SOX2+ cells,
indicating that these cells were likely to contribute toward
tumor relapse [32]. SOX2 is also implicated in the cancer stem cell phenotype and development of chemo-resistance in GBM [33]. In the current work, we present that SOX2 is associated with TMZ-resistance in U87 and U251 lines, which is consistent with the important roles of SOX2 in CSC maintenance and drug resistance.
[image:11.612.98.509.277.649.2]In addition, the difference in localization of the SOX2 protein as opposed to its level of expression may also be important. SOX2 has been shown to be located in the cytoplasm or both nucleus and the cytoplasm in several cancer tissues, such as lung and prostate cancer [34, 35]. However, it seemed thought that SOX2 is restricted to the nuclei of GBM cells in patient tissues or cell lines [36, 37]. Our data is consistent with published reports that SOX2 expression was restricted to the nuclei in our parental U251 cells. Further investigation along the lines of subcellular localization of SOX2 in TMZ-resistant or metformin treated cells is warranted.
Interestingly, TMZ-resistant cells treated with metformin lost their aggressiveness and showed a decrease of SOX2 expression compared with resistant cells before metformin treatment (Figure 3). Evidence demonstrating that metformin selectively targets CSCs and reverses multidrug resistance continues to accumulate. It has been shown that metformin inhibited the proliferation of CSCs and reduced neurosphere formation in GBM cells [20, 38]. When co-administered with TMZ, metformin prevented the growth of stem-like cells in gliomas [15– 17]. Meanwhile, metformin also effectively targeted CSCs in several types of solid tumors, such as breast cancer, pancreatic cancer, and colorectal cancer [39–41]. The anti-proliferative effect of metformin on CSCs is mainly via activation of AMPK [42] and inhibition of AKT
[20]. Other pathways or proteins such as ERK/P70S6K signaling, STAT3, and Nemo-like kinase (NLK) were also identified as targets of metformin [43–45]. Consistent
with previous reports, the decreased expression of SOX2 in metformin treated U87 and U251 lines in the current study indicates that metformin reduced CSCs and TMZ resistance partially via the impairment SOX2 expression.
To further reveal the mechanisms of metformin in reversal of TMZ resistance, we performed microarray analysis on these glioblastoma cell lines. Gene expression
profiling between resistance and parental cell lines showed
that similar pathways were involved in the process of TMZ resistance, as ER stress and anti-apoptosis were found in both U87 and U251 cell lines. A total of 149
DEGs were identified to be involved in TMZ resistance in
both cell lines. Among the 43 DEGs that were commonly up-regulated in both cell lines, many of them have been reported to be involved in chemo-resistance and tumor invasion in brain tumors. For example, MGMT and STAT3 are well known for being involved in TMZ resistance [46, 47]. Another example is CD9, a gene encoding the transmembrane protein tetraspanin, which has been reported to be up-regulated and involved in tumor cell invasion, apoptosis, and resistance to chemotherapy from transcriptomic analysis of glioblastoma tissues compared to normal brain tissues [48]. Another gene from the DEG list is Cadherin-11 (CDH11), which has been shown to promote migration of glioblastoma cells [49].
The metabolic enzyme fatty acid synthase (FASN) is also up-regulated in TMZ resistant U87 and U251 cells (U87R and U251R). FASN is a multifunctional enzyme that plays a central role in fatty acid synthesis and lipid biosynthesis [50]. In various cancers, aggressive features such as migration, invasion, metastasis, and chemo-resistance, have been shown to be dependent upon FASN [51–53]. Over-expression of FASN is also associated with glioma grade. Treatment of glioblastoma cells
with FASN inhibitors resulted in a significant reduction
in tumor cell viability [54]. FASN has been reported
to be significantly down-regulated and decrease of
FASN protein level was observed following 24 hours of
metformin treatment in triple negative breast cancer cells [55]. In our current work, up-regulated FASN expression in TMZ-resistant lines was decreased after metformin treatment. Furthermore, a sub-network associated with
fatty acid metabolism was also identified (Figure 7C). The
expressions of 18 genes (including FASN) in this network was up-regulated in TMZ resistant cell lines and decreased after metformin treatment. In this clustered network, two proteins responsible for fatty acid synthesis and
modification and encoded by FASN and SCD, acted as key
regulators and interacted with other fatty acid metabolism
components such as LPIN1, LDLR, IGFBP1, and INSIG1.
All of these data indicate that fatty acid metabolism is involved in TMZ resistance and the potential reversal of such resistance by metformin.
Another cluster of genes reversed after metformin treatment is associated with translational elongation and RNA binding and splicing. RNA binding proteins interact with pre-mRNA when genes are actively transcribed by RNA polymerase II in ribosomes and participate in nascent mRNA splicing, nuclear export, and stability [56, 57]. Two heterogeneous ribonucleoproteins (hnRNPs) and their functionally related components are included in this subnetwork. hnRNPs are involved in multiple steps of gene transcription and subsequent posttranscriptional
modification [58]. Emerging evidence has demonstrated
that hnRNPs play key roles in tumor development and procession [59, 60]. We have also noticed that hnRNPM is a hub gene in the sub-network of metformin reversed genes, for it possesses over 10 edges (potential binding partners, Figure 7D). hnRNPM, an RNA splicing factor which binds GU-rich RNA cis-elements [61, 62] has been shown to promote EMT and metastasis by regulating alternative splicing in breast cancer [63]. The co-regulation of these RNA binding proteins, RNA polymerase II subunits and ribosomal proteins might contribute to the altered mRNA metabolism and ultimately TMZ resistance, while metformin treatment partially reverses this abnormal gene expression. The detailed mechanisms on how metformin regulates mRNA metabolism is warranted.
transcription factors could contribute to the difference in response to metformin treatment.
In summary, we have used combinatorial experimental and bioinformatics approaches to identify gene regulatory networks that are involved in the development of TMZ resistance and the restoration of sensitivity by metformin treatment. SOX2 up-regulation, altered fatty acid metabolism, and mRNA metabolism might contribute to TMZ resistance, while metformin treatment partially reverses these up-regulated genes back to original or near original levels found in parental
glioblastoma cell lines. Our findings provide potential
insight into the TMZ and metformin treatment mechanism in GBM, which could in turn yield possible translational value for clinical applications. Finally, our work offers an experimentally tractable model that may facilitate personalized treatment for GBM patients and in so doing
also help identify novel and/or personalized therapeutic
targets, leading to potentially more effective treatment.
MATERIALS AND METHODS
Cell culture and generation of TMZ-resistant cell lines
Human glioblastoma cell lines U-87MG originally obtained from American Type Culture Collection (ATCC) and U-251MG originally obtained from Sigma-Aldrich were cultured in EMEM supplemented with 10% fetal
bovine serum, 1% MEM NEAA (Life Technologies) and 1% GlutaMAX (Life Technologies) at 37°C and 5% CO2 in a humidified incubator. TMZ (Sigma-Aldrich) was
dissolved in dimethyl sulfoxide (DMSO) to prepare a stock concentration of 200 mM which was further diluted in cell culture medium to working concentrations. To generate TMZ-resistant cell lines, U87 and U251 parental cells were initially cultured in a medium containing a clinically equivalent concentration of TMZ (50µM). The dosage of TMZ was slowly escalated by 2 times every 1 or 2 passages and reached up to 600 µM. Cells in sister dishes not treated with TMZ were cultured in parallel as controls. To investigate the effects of metformin on TMZ-resistant cells, both TMZ-TMZ-resistant U87 and U251 cells were treated with metformin (1 mM) for 2 weeks.
Neurosphere formation assay
Cells were cultured in suspension at a density of 100
cells/well in 6-well plates. Cells were cultured for 14 days in a neural stem cell medium, consisting of Neurobasal (Life Technologies) and DMEM/F12 media (HyClone) (1:1), supplemented with 1x B27, 1xN2, basic fibroblast growth factor (bFGF, 20 ng/ml), and epidermal growth factor (EGF, 20 ng/ml). The number of neurospheres/well was determined by counting five different wells on Day 7 and Day 14.
Neurospheres with diameters > 50 µm were counted.
MTT assay
The proliferation potential of cells was measured
using MTT assay kit (Life Technologies). The absorbance
at a wavelength of 540 nm was measured with a microplate reader.
Wound-healing assay
The wound was created by scraping cultured glioblastoma cells with a 200 µl pipette tip. The healing process was monitored at 0 and 18 h under a microscope. Wound closure was evaluated using WimScratch Wimasis Image Analysis (www.wimasis.com).
Invasion assay
In vitro invasion assays were performed in a 24-well Multi24-well Insert System (BD Falcon) which contains 8 µm pore size membranes. About 100,000 cells were seeded to the top of the upper wells (previously coated
with Matrigel, 1:100). The lower chamber was filled
with culture medium. After 72 h of incubation, cells that
migrated to the lower side of the membrane were fixed,
stained with Giemsa, and counted. Each experiment was performed in triplicate.
Quantitative RT-PCR (qRT-PCR)
qRT-PCR analysis was used to determine the mRNA expression level of SOX2 in parental, TMZ-resistant, and metformin treated glioblastoma cells. Total RNA was extracted from cells using RNeasy Mini Kit (Zymo Research). cDNA synthesis was accomplished using SuperScriptIII First-Strand Synthesis System (Life
Technologies) following the manufacturer’s instructions. Quantitative PCR was performed by using iQ™ SYBR® Green Supermix (Bio-Rad) in 7900HT Fast Real-Time PCR System (Applied Biosystems). Gene expression levels were compared after normalization to endogenous GAPDH. The primer sequences used in this study are illustrated in Supplementary Table S6. Experiments were performed in triplicate, and the results were calculated with the 2-∆∆Ct method.
Western blotting
Total protein was extracted using a PhosSTOP EASYpack (Roche) according to manufacturer’s instructions. The proteins were separated by SDS-PAGE, transferred to nitrocellulose membranes, and detected with antibodies against SOX2 (Cell Signaling) and
β-actin (Sigma). Immunoreactivity was detected using the ECL chemiluminescence system and quantified using
an imaging densitometer. The density of each band was
Microarray experiment and gene expression analysis
Parental cells, TMZ-resistant cells, and metformin treated cells of U87 and U251 were grown in adherent conditions. RNA was extracted with the RNeasy Mini Kit (Zymo Research). RNA concentration and quality were determined with an Agilent Bioanalyzer. RNA was
labelled using the Illumina TotalPrep RNA Amplification
Kit (Ambion). Microarray data were converted into recognizable format and annotated with software GenomeStudio. The probes detected with p-value lower than 0.01 in at least one sample were accepted as
significant and used for further analysis. After
variance-stabilizing transformation (VST) and normalization with Robust Spline Normalization (RSN) method with package lumi of R, differential analysis were performed using package limma, respectively [64, 65]. Heatmap and clustering were generated using package pheatmap. Fold change > 1.5 and adj. P < 0.05 were set as the cut-offs to screen out differentially expressed genes (DEGs). The functional enrichment analysis of DEGs was performed by DAVID (The Database for Annotation, Visualization and Integrated Discovery) to identify GO categories in biological process and KEGG signal [66]. The FDR < 0.05 was used as the cut-off. The protein-protein interaction was retrieved from STRING database and reconstructed in Cytoscape software [67, 68]. Separate networks with fewer than 10 nodes were not included for further analysis. Sub-clusters analysis was performed by MCODE plugin [69].
Xenograft mouse models
U87 parental cells, resistant cells, or TMZ-resistant cells treated with metformin (1 mM) for 2 weeks (2 × 10⁶ cells per transplantation) were transplanted subcutaneously to the lower flank of 6~8 week-old SCID
mice. Tumor growth was monitored twice weekly for up to 6 weeks. Tumor diameter was measured with calipers, and the tumor volume was calculated (length × width × width × 0.5). The survival time of the mice was recorded and the median survivals were calculated. All animal procedures were approved by The University of Texas Health Science Center at Houston (UTHealth) Animal Welfare Committee.
Statistics
Results were compared between the groups using unpaired t-test. Overall survival was analyzed using the Kaplan-Meier method. Statistical analysis was performed with the SPSS software package.
ACKNOWLEDGMENTS
The authors thank Dr. Joanna S. OLeary for editing
the manuscript. We also thank the IMM FACS core facility
and the Cancer Prevention and Research Institute of Texas
(CPRIT) for the supported use of flow cytometry.
CONFLICTS OF INTEREST
The authors declare no conflicts of interest.
GRANT SUPPORT
This work was supported by the Vivian L. Smith
Department of Neurosurgery, McGovern Medical School, the University of Texas Health Science Center at Houston (UTHealth), and Dr. Marnie Rose Foundation. This work was also supported by Department of Neurosurgery, St. Vincent’s Hospital, College of Medicine, The Catholic
University of Korea, Suwon, South Korea. YL is supported
by Staman Ogilvie Foundation, Craig H. Neilsen Foundation and Mission Connect-TIRR Foundation.
REFERENCES
1. Stupp R, Mason WP, van den Bent MJ, Weller M, Fisher B, Taphoorn MJ, Belanger K, Brandes AA, Marosi C, Bogdahn U, Curschmann J, Janzer RC, Ludwin SK, et al. Radiotherapy plus concomitant and adjuvant temozolomide for glioblastoma. N Engl J Med. 2005; 352:987–996. 2. Roos WP, Batista LF, Naumann SC, Wick W, Weller M,
Menck CF, Kaina B. Apoptosis in malignant glioma cells triggered by the temozolomide-induced DNA lesion O6-methylguanine. Oncogene. 2007; 26:186–197.
3. Cahill DP, Levine KK, Betensky RA, Codd PJ, Romany CA, Reavie LB, Batchelor TT, Futreal PA, Stratton MR, Curry WT, Iafrate AJ, Louis DN. Loss of the mismatch repair protein MSH6 in human glioblastomas is associated with tumor progression during temozolomide treatment. Clin Cancer Res. 2007; 13:2038–2045.
4. Kyritsis AP, Levin VA. An algorithm for chemotherapy treatment of recurrent glioma patients after temozolomide failure in the general oncology setting. Cancer Chemother Pharmacol. 2011; 67:971–983.
5. Esteller M, Garcia-Foncillas J, Andion E, Goodman SN, Hidalgo OF, Vanaclocha V, Baylin SB, Herman JG. Inactivation of the DNA-repair gene MGMT and the clinical response of gliomas to alkylating agents. N Engl J Med. 2000; 343:1350–1354.
6. Liu L, Gerson SL. Targeted modulation of MGMT: clinical implications. Clin Cancer Res. 2006; 12:328–331.
7. Ekstrand AJ, James CD, Cavenee WK, Seliger B, Pettersson RF, Collins VP. Genes for epidermal growth factor receptor, transforming growth factor alpha, and epidermal growth factor and their expression in human gliomas in vivo. Cancer Res. 1991; 51:2164–2172.
astrocytoma to optimize p53 restoration therapy. Proc Natl Acad Sci U S A. 2013; 110:E1480–1489.
9. Mayo LD, Donner DB. The PTEN, Mdm2, p53 tumor suppressor-oncoprotein network. Trends Biochem Sci. 2002; 27:462–467.
10. Mizoguchi M, Guan Y, Yoshimoto K, Hata N, Amano T, Nakamizo A, Sasaki T. Clinical implications of microRNAs in human glioblastoma. Front Oncol. 2013; 3:19.
11. Hirsch HA, Iliopoulos D, Tsichlis PN, Struhl K. Metformin selectively targets cancer stem cells, and acts together with chemotherapy to block tumor growth and prolong remission. Cancer Res. 2009; 69:7507–7511.
12. Gou S, Cui P, Li X, Shi P, Liu T, Wang C. Low concentrations of metformin selectively inhibit CD133(+) cell proliferation in pancreatic cancer and have anticancer action. PLoS One. 2013; 8:e63969.
13. Nangia-Makker P, Yu Y, Vasudevan A, Farhana L, Rajendra SG, Levi E, Majumdar AP. Metformin: a potential therapeutic agent for recurrent colon cancer. PLoS One. 2014; 9:e84369.
14. Shank JJ, Yang K, Ghannam J, Cabrera L, Johnston CJ, Reynolds RK, Buckanovich RJ. Metformin targets ovarian cancer stem cells in vitro and in vivo. Gynecol Oncol. 2012; 127:390–397.
15. Yu Z, Zhao G, Li P, Li Y, Zhou G, Chen Y, Xie G. Temozolomide in combination with metformin act synergistically to inhibit proliferation and expansion of glioma stem-like cells. Oncol Lett. 2016; 11:2792–2800. 16. Yu Z, Zhao G, Xie G, Zhao L, Chen Y, Yu H, Zhang Z,
Li C, Li Y. Metformin and temozolomide act synergistically to inhibit growth of glioma cells and glioma stem cells in vitro and in vivo. Oncotarget. 2015; 6:32930–32943. doi: 10.18632/oncotarget.5405.
17. Sesen J, Dahan P, Scotland SJ, Saland E, Dang VT, Lemarie A, Tyler BM, Brem H, Toulas C, Cohen-Jonathan Moyal E, Sarry JE, Skuli N. Metformin inhibits growth of human glioblastoma cells and enhances therapeutic response. PLoS One. 2015; 10:e0123721.
18. Lefranc F, Facchini V, Kiss R. Proautophagic drugs: a novel means to combat apoptosis-resistant cancers, with a special emphasis on glioblastomas. Oncologist. 2007; 12:1395–1403. 19. Bleau AM, Hambardzumyan D, Ozawa T, Fomchenko EI,
Huse JT, Brennan CW, Holland EC. PTEN/PI3K/Akt pathway regulates the side population phenotype and ABCG2 activity in glioma tumor stem-like cells. Cell Stem Cell. 2009; 4:226–235.
20. Wurth R, Pattarozzi A, Gatti M, Bajetto A, Corsaro A, Parodi A, Sirito R, Massollo M, Marini C, Zona G, Fenoglio D, Sambuceti G, Filaci G, et al. Metformin selectively affects human glioblastoma tumor-initiating cell viability: A role for metformin-induced inhibition of Akt. Cell Cycle. 2013; 12:145–156.
21. Li L, Wang Y, Peng T, Zhang K, Lin C, Han R, Lu C, He Y. Metformin restores crizotinib sensitivity in
crizotinib-resistant human lung cancer cells through inhibition of IGF1-R signaling pathway. Oncotarget. 2016; 7:34442–52. doi: 10.18632/oncotarget.9120.
22. Salani B, Maffioli S, Hamoudane M, Parodi A, Ravera S, Passalacqua M, Alama A, Nhiri M, Cordera R, Maggi D. Caveolin-1 is essential for metformin inhibitory effect on IGF1 action in non-small-cell lung cancer cells. FASEB J. 2012; 26:788–798.
23. Beier D, Rohrl S, Pillai DR, Schwarz S, Kunz-Schughart LA, Leukel P, Proescholdt M, Brawanski A, Bogdahn U, Trampe-Kieslich A, Giebel B, Wischhusen J, Reifenberger G, et al. Temozolomide preferentially depletes cancer stem cells in glioblastoma. Cancer Res. 2008; 68:5706–5715.
24. Gangemi RM, Griffero F, Marubbi D, Perera M, Capra MC, Malatesta P, Ravetti GL, Zona GL, Daga A, Corte G. SOX2 silencing in glioblastoma tumor-initiating cells causes stop of proliferation and loss of tumorigenicity. Stem Cells. 2009; 27:40–48.
25. Alonso MM, Diez-Valle R, Manterola L, Rubio A, Liu D, Cortes-Santiago N, Urquiza L, Jauregi P, Lopez de Munain A, Sampron N, Aramburu A, Tejada-Solis S, Vicente C, et al. Genetic and epigenetic modifications of Sox2 contribute to the invasive phenotype of malignant gliomas. PLoS One. 2011; 6:e26740.
26. Guo D, Bell EH, Chakravarti A. Lipid metabolism emerges as a promising target for malignant glioma therapy. CNS Oncol. 2013; 2:289–299.
27. Blough MD, Westgate MR, Beauchamp D, Kelly JJ, Stechishin O, Ramirez AL, Weiss S, Cairncross JG. Sensitivity to temozolomide in brain tumor initiating cells. Neuro Oncol. 2010; 12:756–760.
28. Mao DD, Gujar AD, Mahlokozera T, Chen I, Pan Y, Luo J, Brost T, Thompson EA, Turski A, Leuthardt EC, Dunn GP, Chicoine MR, Rich KM, et al. A CDC20-APC/SOX2 Signaling Axis Regulates Human Glioblastoma Stem-like Cells. Cell Rep. 2015; 11:1809–1821.
29. Hutz K, Mejias-Luque R, Farsakova K, Ogris M, Krebs S, Anton M, Vieth M, Schuller U, Schneider MR, Blum H, Wagner E, Jung A, Gerhard M. The stem cell factor SOX2 regulates the tumorigenic potential in human gastric cancer cells. Carcinogenesis. 2014; 35:942–950.
30. Oppel F, Muller N, Schackert G, Hendruschk S, Martin D, Geiger KD, Temme A. SOX2-RNAi attenuates S-phase entry and induces RhoA-dependent switch to protease-independent amoeboid migration in human glioma cells. Mol Cancer. 2011; 10:137.
31. Piva M, Domenici G, Iriondo O, Rabano M, Simoes BM, Comaills V, Barredo I, Lopez-Ruiz JA, Zabalza I, Kypta R, Vivanco M. Sox2 promotes tamoxifen resistance in breast cancer cells. EMBO Mol Med. 2014; 6:66–79.
32. Tam WL, Ng HH. Sox2: masterminding the root of cancer. Cancer Cell. 2014; 26:3–5.
34. Chen S, Xu Y, Chen Y, Li X, Mou W, Wang L, Liu Y, Reisfeld RA, Xiang R, Lv D, Li N. SOX2 gene regulates the transcriptional network of oncogenes and affects tumorigenesis of human lung cancer cells. PLoS One. 2012; 7:e36326.
35. Jia X, Li X, Xu Y, Zhang S, Mou W, Liu Y, Liu Y, Lv D, Liu CH, Tan X, Xiang R, Li N. SOX2 promotes tumorigenesis and increases the anti-apoptotic property of human prostate cancer cell. J Mol Cell Biol. 2011; 3:230–238.
36. Schmitz M, Temme A, Senner V, Ebner R, Schwind S, Stevanovic S, Wehner R, Schackert G, Schackert HK, Fussel M, Bachmann M, Rieber EP, Weigle B. Identification of SOX2 as a novel glioma-associated antigen and potential target for T cell-based immunotherapy. Br J Cancer. 2007; 96:1293–1301.
37. Annovazzi L, Mellai M, Caldera V, Valente G, Schiffer D. SOX2 expression and amplification in gliomas and glioma cell lines. Cancer Genomics Proteomics. 2011; 8:139–147. 38. Mouhieddine TH, Nokkari A, Itani MM, Chamaa F,
Bahmad H, Monzer A, El-Merahbi R, Daoud G, Eid A, Kobeissy FH, Abou-Kheir W. Metformin and Ara-a Effectively Suppress Brain Cancer by Targeting Cancer Stem/Progenitor Cells. Front Neurosci. 2015; 9:442. 39. Song CW, Lee H, Dings RP, Williams B, Powers J,
Santos TD, Choi BH, Park HJ. Metformin kills and radiosensitizes cancer cells and preferentially kills cancer stem cells. Sci Rep. 2012; 2:362.
40. Zhang Y, Guan M, Zheng Z, Zhang Q, Gao F, Xue Y. Effects of metformin on CD133+ colorectal cancer cells in diabetic patients. PLoS One. 2013; 8:e81264.
41. Ning X, Du Y, Ben Q, Huang L, He X, Gong Y, Gao J, Wu H, Man X, Jin J, Xu M, Li Z. Bulk pancreatic cancer cells can convert into cancer stem cells(CSCs) in vitro and 2 compounds can target these CSCs. Cell Cycle. 2016; 15:403–412.
42. Sato A, Sunayama J, Okada M, Watanabe E, Seino S, Shibuya K, Suzuki K, Narita Y, Shibui S, Kayama T, Kitanaka C. Glioma-initiating cell elimination by metformin activation of FOXO3 via AMPK. Stem Cells Transl Med. 2012; 1:811–824.
43. Chai X, Chu H, Yang X, Meng Y, Shi P, Gou S. Metformin Increases Sensitivity of Pancreatic Cancer Cells to Gemcitabine by Reducing CD133+ Cell Populations and Suppressing ERK/P70S6K Signaling. Sci Rep. 2015; 5:14404.
44. Suwei D, Liang Z, Zhimin L, Ruilei L, Yingying Z, Zhen L, Chunlei G, Zhangchao L, Yuanbo X, Jinyan Y, Gaofeng L, Xin S. NLK functions to maintain proliferation and stemness of NSCLC and is a target of metformin. J Hematol Oncol. 2015; 8:120.
45. Pan Q, Yang GL, Yang JH, Lin SL, Liu N, Liu SS, Liu MY, Zhang LH, Huang YR, Shen RL, Liu Q, Gao JX, Bo JJ. Metformin can block precancerous progression to invasive tumors of bladder through inhibiting STAT3-mediated signaling pathways. J Exp Clin Cancer Res. 2015; 34:77.
46. Ashizawa T, Akiyama Y, Miyata H, Iizuka A, Komiyama M, Kume A, Omiya M, Sugino T, Asai A, Hayashi N, Mitsuya K, Nakasu Y, Yamaguchi K. Effect of the STAT3 inhibitor STX-0119 on the proliferation of a temozolomide-resistant glioblastoma cell line. Int J Oncol. 2014; 45:411–418. 47. Hegi ME, Liu L, Herman JG, Stupp R, Wick W, Weller M,
Mehta MP, Gilbert MR. Correlation of O6-methylguanine methyltransferase (MGMT) promoter methylation with clinical outcomes in glioblastoma and clinical strategies to modulate MGMT activity. J Clin Oncol. 2008; 26:4189–4199. 48. Podergajs N, Motaln H, Rajcevic U, Verbovsek U,
Korsic M, Obad N, Espedal H, Vittori M, Herold-Mende C, Miletic H, Bjerkvig R, Turnsek TL. Transmembrane protein CD9 is glioblastoma biomarker, relevant for maintenance of glioblastoma stem cells. Oncotarget. 2016; 7:593–609. doi: 10.18632/oncotarget.5477.
49. Schulte JD, Srikanth M, Das S, Zhang J, Lathia JD, Yin L, Rich JN, Olson EC, Kessler JA, Chenn A. Cadherin-11 regulates motility in normal cortical neural precursors and glioblastoma. PLoS One. 2013; 8:e70962.
50. Wakil SJ. Fatty acid synthase, a proficient multifunctional enzyme. Biochemistry. 1989; 28:4523–4530.
51. Seguin F, Carvalho MA, Bastos DC, Agostini M, ZecchinKG, Alvarez-Flores MP, Chudzinski-Tavassi AM, Coletta RD, Graner E. The fatty acid synthase inhibitor orlistat reduces experimental metastases and angiogenesis in B16-F10 melanomas. Br J Cancer. 2012; 107:977–987. 52. Zaytseva YY, Rychahou PG, Gulhati P, Elliott VA,
Mustain WC, O’Connor K, Morris AJ, Sunkara M, Weiss HL, Lee EY, Evers BM. Inhibition of fatty acid synthase attenuates CD44-associated signaling and reduces metastasis in colorectal cancer. Cancer Res. 2012; 72:1504–1517. 53. Menendez JA, Lupu R. Fatty acid synthase and the lipogenic
phenotype in cancer pathogenesis. Nat Rev Cancer. 2007; 7:763–777.
54. Grube S, Dunisch P, Freitag D, Klausnitzer M, Sakr Y, Walter J, Kalff R, Ewald C. Overexpression of fatty acid synthase in human gliomas correlates with the WHO tumor grade and inhibition with Orlistat reduces cell viability and triggers apoptosis. J Neurooncol. 2014; 118:277–287. 55. Wahdan-Alaswad RS, Cochrane DR, Spoelstra NS,
Howe EN, Edgerton SM, Anderson SM, Thor AD, Richer JK. Metformin-induced killing of triple-negative breast cancer cells is mediated by reduction in fatty acid synthase via miRNA-193b. Horm Cancer. 2014; 5:374–389. 56. Keene JD. RNA regulons: coordination of
post-transcriptional events. Nat Rev Genet. 2007; 8:533–543. 57. Sanchez-Diaz P, Penalva LO. Post-transcription meets
post-genomic: the saga of RNA binding proteins in a new era. RNA Biol. 2006; 3:101–109.
58. Krecic AM, Swanson MS. hnRNP complexes: composition, structure, and function. Curr Opin Cell Biol. 1999; 11:363–371. 59. Han N, Li W, Zhang M. The function of the RNA-binding
60. Carpenter B, MacKay C, Alnabulsi A, MacKay M, Telfer C, Melvin WT, Murray GI. The roles of heterogeneous nuclear ribonucleoproteins in tumour development and progression. Biochim Biophys Acta. 2006; 1765:85–100.
61. Datar KV, Dreyfuss G, Swanson MS. The human hnRNP M proteins: identification of a methionine/arginine-rich repeat motif in ribonucleoproteins. Nucleic Acids Res. 1993; 21:439–446.
62. Hovhannisyan RH, Carstens RP. Heterogeneous ribonucleoprotein m is a splicing regulatory protein that can enhance or silence splicing of alternatively spliced exons. J Biol Chem. 2007; 282:36265–36274.
63. Xu Y, Gao XD, Lee JH, Huang H, Tan H, Ahn J, Reinke LM, Peter ME, Feng Y, Gius D, Siziopikou KP, Peng J, Xiao X, Cheng C. Cell type-restricted activity of hnRNPM promotes breast cancer metastasis via regulating alternative splicing. Genes Dev. 2014; 28:1191–1203.
64. Du P, Kibbe WA, Lin SM. lumi: a pipeline for processing Illumina microarray. Bioinformatics. 2008; 24:1547–1548. 65. Ritchie ME, Phipson B, Wu D, Hu Y, Law CW, Shi W,
Smyth GK. limma powers differential expression analyses
for RNA-sequencing and microarray studies. Nucleic Acids Res. 2015; 43:e47.
66. Huang da W, Sherman BT, Lempicki RA. Systematic and integrative analysis of large gene lists using DAVID bioinformatics resources. Nat Protoc. 2009; 4:44–57. 67. Szklarczyk D, Franceschini A, Wyder S, Forslund K,
Heller D, Huerta-Cepas J, Simonovic M, Roth A, Santos A, Tsafou KP, Kuhn M, Bork P, Jensen LJ, von Mering C. STRING v10: protein-protein interaction networks, integrated over the tree of life. Nucleic Acids Res. 2015; 43(Database issue):D447–452.
68. Shannon P, Markiel A, Ozier O, Baliga NS, Wang JT, Ramage D, Amin N, Schwikowski B, Ideker T. Cytoscape: a software environment for integrated models of biomolecular interaction networks. Genome Res. 2003; 13:2498–2504. 69. Bader GD, Hogue CW. An automated method for finding