HYGROTHERMAL PERFORMANCE OF HEMP BASED THERMAL INSULATION MATERIALS IN THE UK
ESHRAR LATIF
MSc Planning Practice and Research
MSc Architecture: Advanced Environmental and Energy Studies Bachelor of Architecture
A thesis submitted in partial fulfilment of the requirements of the School of Architecture, Computing and Engineering, University of East London
for the degree of Doctor of Philosophy
ii
Abstract
This thesis explores the hygrothermal performance of hemp insulation in the context of the United Kingdom. The key objectives of this investigation were to assess the heat and moisture management capacities of hemp insulations in two constructions typical to the UK, of timber frame and solid brick walls and to put the findings of the assessment into the greater context of conventional insulation materials by comparing hemp insulation’s performance with that of stone wool. The assessments were performed by means of laboratory-based experiments, in situ experimental monitoring and computer based numerical hygrothermal simulations. The most important finding during the laboratory-based experiment is that, in high relative humidity, the likelihood and frequency of interstitial condensation is higher in stone wool insulation than in hemp insulation. In terms of the material properties, one of the key findings during the laboratory-based experiment is the high level of moisture buffering capacities of hemp insulations, and therefore their potential in managing moisture in buildings. The in situ assessment of hygrothermal properties of hemp and stone wool insulations confirms the findings of the laboratory based experiments of the corresponding moisture management capacities of these two insulation materials. Parametric analysis of the in situ data shows that mould spore germination is possible in the insulations in vapour open walls although the visual observation has not confirmed the outcome of this analysis. In terms of thermal conductivity, the important finding is that the equivalent thermal conductivity of hemp and stone wool insulations are always equal or below the manufacturers’ declared thermal conductivity values. Long-term hygrothermal performances of hemp and stone wool insulation in timber frame and solid brick walls have been also assessed using a numerical hygrothermal simulation tool (WUFI). As far as the WUFI predictions are concerned, the application of the hemp or stone wool insulation on solid brick wall does not seem to be feasible with reference to condensation and mould growth in the insulations.
iii
Table of contents
Abstract ii
Table of contents iii
List of Figures xv
List of Tables xxxiii
List of abbreviations and acronyms xxxvi
Acknowledgment xxxix
1 Introduction 1
1.1 Background 1
1.2 Research Hypothesis 7
1.3 Aim and objectives of the research 7 1.4 Outline of the materials and research methods 8
1.4.1 Materials 8
1.4.2 Outline of the research methods 10
1.5 Boundaries of research 10
1.5.1 Boundary of research activities 10
1.5.2 Boundary of location 11
1.6 Contribution to knowledge 11
1.6.1 Experimental setup and equipment 11 1.6.2 Experimental method for laboratory and in situ tests 11
1.6.3 Research Outcome 11
1.7 Structure of the thesis 12
2 Literature review of hygrothermal properties of
fibrous insulations with particular focus on hemp 15
iv
2.1.1 Material level 15
2.1.2 Assembly or system level 18
2.1.3 Variable heat capacity 19
2.1.4 Heat of Wetting 20
2.2 Moisture flux and moisture mass in buildings 21 2.2.1 Hygrothermal performance of typical UK houses 22 2.2.2 Moisture in loft space, roof and implications 23
2.2.3 Structural moisture and implications 23 2.2.4 Indoor moisture and implications 26
2.3 Moisture adsorption and Buffering 28
2.3.1 Moisture adsorption 28
2.3.2 Moisture buffering 30
2.4 Mould Growth 32
2.5 Summary of the literature review 35
2.5.1 Heat 35
2.5.2 Moisture 35
2.5.3 Mould 36
2.6 Summary of the key knowledge gaps 37
3 Definitions and theories related to heat, air and mass transfer and
mould growth 38
3.1 Heat, air and moisture transfer 38
3.1.1 Moisture transfer 38
3.1.2 Heat transfer 39
3.1.3 Heat and Moisture Balance Equation 39
3.1.4 Air balance equation 40
3.2 Thermal conductivity 40
3.2.1 Definition of thermal conductivity 40
v
3.2.3 Thermal conductivity of moist materials 42
3.2.4 Equivalent thermal conductivity 43
3.3 Adsorption isotherm of fibrous insulation materials 44 3.3.1 Adsorption and adsorption isotherm 44 3.3.2 Morphology of bio-based fibres and adsorption 46
3.3.3 Adsorption mechanism 48
3.3.4 Hygroscopic region 49
3.3.5 Types of adsorption isotherms 51
3.3.6 Hysteresis 52
3.3.6.1 The incomplete wetting theory 53
3.3.6.2 The bottle neck theory 54
3.3.6.3 The open pore theory 54
3.3.6.4 The sorption site availability theory 55 3.3.7 Heat of wetting or heat of sorption 55 3.3.8 Variations in adsorption isotherms 56
3.3.9 Theories of adsorption 57
3.3.9.1 The Langmuir Isotherm 57
3.3.9.2 The Brunauer, Emmett and Teller isotherm 58 3.3.9.3 The Guggenheim/ Andersen/ de Boer
isotherm 59
3.3.9.4 Hailwood and Horrobin model 59
3.4 Moisture buffering 60
3.4.1 Introduction 60
3.4.2 Application of moisture buffering capacity of materials 60
3.4.3 Levels of moisture buffering 61
3.4.4 Moisture penetration depth 62
3.4.5 The methods and units of moisture buffering capacity 63
3.4.5.1 Nordtest units 63
3.4.5.2 ‘Buf’ Value 65
3.4.6 The Japanese Standard and the Nordtest method 67
vi
3.6 Vapour permeability and vapour diffusion resistance
factor 68
3.7 Prediction of mould growth 70
3.8 Chapter summary 72
4 Research Methodology: materials, equipment, test methods and
numerical simulation software 74
4.1 Introduction 74
4.2 The methodological philosophy 74
4.3 Outline of research methods 77
4.3.1 The material level and research methods 77 4.3.2 The system level and research methods 78
4.4 Material selection 80
4.4.1 Hemp Insulation 93
4.4.2 Stone Wool Insulation 94
4.4.3 Sheep Wool Insulation 94
4.4.4 Wood fibre Insulation 95
4.5 Use of equipment 95
4.5.1 Standard equipment 95
4.5.1.1 The TAS climate chamber 95 4.5.1.2 The Feutron climate chamber 96 4.5.1.3 Measurement and control module 97
4.5.1.4 Temperature probes 98
4.5.1.5 Temperature and relative humidity sensors 99
4.5.1.6 Heat flux sensors 100
4.5.1.7 Water content reflectometer 100 4.5.1.8 Isomet heat transfer analyser 101 4.5.1.9 Precision weighing scales 102 4.5.1.10 Flir i7 thermal imaging camera 103
4.5.1.11 Digital microscope 104
vii
4.5.1.13 Fox 600 guarded hot plate 105 4.5.1.14 Century 4 industrial humidifier 105 4.5.1.15 TH-810H plug-in humidistat 106
4.5.2 Specialist equipment 106
4.5.2.1 Data acquisition and temperature control unit 106
4.5.2.2 Data acquisition unit 107
4.5.2.3 The dynamic hygrothermal hotbox 107
4.6 Chapter Summary 108
5 Standard steady state tests 110
5.1 Introduction 110
5.2 Determination of adsorption-desorption Isotherm 110
5.2.1 Method of determination 110
5.2.2 Method of analysis of the adsorption-desorption data 111
5.2.3 Results and discussion 112
5.2.4 Adsorption isotherms in terms of weight and volume 119
5.2.5 Hysteresis 121
5.2.6 Summary of adsorption-desorption isotherm 121 5.3 Determination of moisture buffering capacity 122 5.4 Determination of vapour diffusion resistance factor 126 5.5 Determination of water absorption coefficient 130
5.6 Chapter summary 136
6 Dynamic and quasi steady state experiments 139 6.1 Introduction to the dynamic and quasi steady state
experiments. 139
6.2 Dynamic hygrothermal performance of hemp-2 and stone wool
viii
6.2.1 Introduction 142
6.2.2 The sample insulation materials 142
6.2.3 The experimental setup 142
6.2.3.1 The dynamic hygrothermal hot box 143
6.2.3.2 The air conditioner 143
6.2.3.3 Temperature and relative humidity sensors 143
6.2.3.4 Heat flux sensors 144
6.2.3.5 Isomet needle probe 144
6.2.3.6 CR1000 data logger 144
6.2.4 Material preparation and instrumentation 144
6.2.5 Insulation installation 147
6.2.6 Experimental method 148
6.2.7 Results and discussion 152
6.2.7.1 Relative humidity and interstitial condensation 152 6.2.7.2 Heat Flux and thermal conductivity 161 6.2.8 Summary of the dynamic experiment 172 6.3 Hygrothermal performance of hemp-2 and stone wool insulation
materials in quasi steady state hygrothermal conditions 173
6.3.1 The insulation samples 174
6.3.2 Instrumentation and experimental setup 174 6.3.2.1 Feutron dual climate chamber 174
6.3.2.2 Temperature and relative humidity sensors 174
6.3.2.3 Heat flux sensors 174
6.3.2.4 CR1000 data logger 175
6.3.2.5 Sample Installation 175
6.3.3 Experimental method 179
6.3.4 Results and discussion 180
ix
6.4 An experimental assessment of the conventional method of measuring thermal conductivity of moistened insulations 200
6.4.1 Introduction 200
6.4.2 Method 199
6.4.3 Conditioning and preparation of the insulations 201
6.4.4 Setup and instrumentation 201
6.4.5 Measurement of thermal Conductivity 203
6.4.6 Results and discussion 205
6.4.7 Summary of the assessment 209
6.5 Insulation in lofts: experimental simulation of moisture
management and thermal conductivity 209
6.5.1 Introduction 209
6.5.2 Material selection 210
6.5.3 Experimental method 210
6.5.4 The Experimental Protocol 218
6.5.5 Results and discussion 218
6.5.5.1 Likelihood of condensation 218 6.5.5.2 Equivalent thermal conductivity 223 6.5.6 Summary of the loft experiment 225
6.6 Chapter summary 226
7 In situ tests to determine hygrothermal properties of insulation
materials in service conditions 228
7.1 Introduction 228
7.2 Outline of the in situ tests 229
7.2.1 Test-1 229
7.2.2 Test-2 229
7.2.3 Test-3 229
7.3 The test building and the test panels 230
7.3.1 The test building 230
x
7.4 Theory 237
7.4.1 Theory on thermal conductivity and mould spore
germination 237
7.4.2 Mould spore germination: hygrothermal conditions 238 7.5 Operational errors in heat flux measurement 239
7.5.1 Operational errors in heat flux measurement in
assembly-1 239
7.5.2 Operational errors in heat flux measurement in
assembly-2 240
7.6 In situ test-1: Hygrothermal performance of hemp insulation in timber frame structures with and without vapour barrier 240
7.6.1 Introduction 240
7.6.2 Test Materials and test panels 241
7.6.2.1 The test materials 241
7.6.2.2 The test panels 241
7.6.3 Research Method 241
7.6.3.1 Experimental protocol 241
7.6.3.2 Assessment of thermal performance and mould
growth conditions 244
7.6.4 Results test-1.1 and test-1.2 245 7.6.4.1 Temperature and relative humidity 245
7.6.4.2 Heat flux, U-value and thermal conductivity 246
7.6.4.3 Hygric conditions 248
7.6.5 Discussion 249
7.6.5.1 Thermal properties 249
7.6.5.2 Relative humidity and prediction of mould growth 251 7.7 In situ test-2: Hygrothermal performances of two hemp
insulations in a vapour open timber frame structure 255
7.7.1 Introduction 255
xi
7.7.2.1 Test materials 256
7.7.2.2 The test panels 257
7.7.3 Research Method 257
7.7.3.1 Experimental protocol 257
7.7.3.2 Assessment of thermal performance and mould
growth conditions 258
7.7.4 Results of the in situ experiment 258 7.7.4.1 Temperature and relative humidity 258
7.7.4.2 Heat flux, U-value and thermal conductivity 258
7.7.4.3 Hygric conditions 260
7.7.5 Discussion 261
7.7.5.1 Thermal properties 261
7.7.5.2 Relative humidity and prediction of mould growth 262 7.8 In situ Test-3: Hygrothermal performance of hemp-2 and
stone wool insulation materials 264
7.8.1 Introduction 264
7.8.2 Test materials and experimental setup 265
7.8.2.1 Test materials 265
7.8.2.2 The test panels, instrumentation 265
7.8.3 Research Method 266
7.8.3.1 Experimental protocol 266
7.8.3.2 Assessment of thermal performance and mould
growth conditions 266
7.8.4 Results 267
7.8.4.1 Temperature and relative humidity 267 7.8.4.2 Heat flux, U-value and thermal conductivity 267
7.8.5 Discussion 269
7.8.5.1 Thermal properties 269
7.8.5.2 Relative humidity and prediction of mould spore
germination 270
xii
8 Hygrothermal simulations using test reference year data
from two UK sites 277
8.1 Introduction 277
8.2 Validation of WUFI software and parameter sensitivity
analysis 278
8.2.1 Validation of the WUFI software 278
8.2.2 Parameter sensitivity analysis 279 8.3 Material selection and wall types 284
8.3.1 Materials 284
8.3.2 Wall types 284
8.4 Boundary conditions 290
8.4.1 Interior temperature and relative humidity 290
8.4.2 Weather Data 290
8.5 Method of hygrothermal simulation 291
8.5.1 Material data 291
8.5.2 Simulation period 291
8.5.3 Data analysis and comparison 292
8.6 Results and discussion 293
8.6.1 Timber Frame Wall in Edinburgh 293 8.6.1.1 Relative humidity conditions 294
8.6.1.2 Water content 296
8.6.1.3 Mould spore germination and mould growth 299 8.6.1.4 Mould index and mould growth 306 8.6.1.5 Thermal conductivity of the insulations 307
8.6.2 Timber frame walls in Birmingham 308
8.6.2.1 Relative humidity 308
8.6.2.2 Water content 313
xiii
8.6.3 Solid Brick Wall in Edinburgh 325
8.6.3.1 Relative humidity 325
8.6.3.2 Mould spore germination and mould growth 329 8.6.3.3 Equivalent U-value of the walls 331
8.6.4 Solid Brick Wall in Birmingham 333
8.6.4.1 Relative humidity 333
8.6.4.2 Mould spore germination and mould growth 335 8.6.4.3 Equivalent U-value of the walls 337 8.7 Summary of the numerical simulations using the WUFI
software 339
8.7.1 Condensation, mould spore germination and growth 339 8.7.2 Equivalent thermal conductivity and U-value 340
9 Conclusions and recommendations 342
9.1 Overall conclusions 342
9.1.1 Hygric material properties of hemp insulations 343 9.1.2 Moisture management of hemp insulations 344 9.1.3 Mould spore germination and mould growth 345 9.1.4 Thermal conductivity and U-value 346
9.2 Contribution to knowledge 349
9.2.1 Moisture management of hemp insulation 349 9.2.2 Experimental setup for visual inspection of condensation 349 9.2.3 Experimental determination of the equivalent thermal
conductivity of hemp insulations in the laboratory 350 9.2.4 In situ measurement of equivalent thermal conductivity
of hemp insulations 350
9.3 Industrial benefit from the research 351
9.4 Recommendations for further work 351
xiv
9.4.3 Hygrothermal simulation in a heat, air and mass (HAM)
transfer software 352
References 353
Appendix A Hot wire method for measuring thermal
conductivity 366
Appendix B Thermal conductivity of insulation materials: comparison of the results obtained by using an Isomet 2104 heat transfer analyser with the
results obtained from Fox 600 hot plate 369 Appendix C Some proposed ‘rule of thumb’ methods of
measuring moisture dependent thermal
conductivity of hemp 372
Appendix D Thermal and daylight images of the test building 376 Appendix E Whole building energy use 377 Appendix F Sensitivity analysis data 384 Appendix G Conference presentation and publication 386 Appendix H Reference of current research 388
xv
List of Figures
Figure 1.1: Built environment and CO2 emission (IGT, 2010) 03 Figure 1.2: Heat loss through the envelope of an uninsulated home
(after McMullan, 2007) 04
Figure 1.3: Insulation measures (Utley and Shorrock, 2012) 05 Figure 1.4: Outline of the structure of the thesis 14 Figure 2.1: Thermal conductivity of hemp samples (Korjenic et al., 2011) 16 Figure 2.2: Heat of wetting of flax fibre (Hill, Norton and Newman, 2009) 21 Figure 2.3: Relative humidity in a residential space adjacent to the
bathroom (Hill, Norton and Newman, 2009) 23 Figure 2.4: Health and emission risk related to different humidity
regimes (Modified from Arundel et al., 1986) 27 Figure 2.5: Adsorption isotherm of some natural fibres
(Hill, Norton and Newman, 2009) 29 Figure 2.6: Sorption kinetics of hemp fibres (Xie et al., 2011) 30 Figure 3.1: Scanning electron microscopy (SEM) images of hemp bast
fibres, Scale bar: 10μm (Garcia-Jaldon, Dupeyre and
Vignon, 1998) 46
Figure 3.2: Structure of hemp fibres (Norton, 2008) 47 Figure 3.3: A schematic diagram of direct and indirect moisture sorption
onto (1) external surface, (2) amorphous regions, (3) inner surface of voids and (4) crystallites (Okubayashia,Griesserb
and Bechtolda, 2004) 48
Figure 3.4: Adsorption regions (Kunzel, 1995) 50 Figure 3.5: Monolayer and multilayer adsorption (after Osborne, 2004) 51 Figure 3.6: Physisorption (after Condon, 2006) 52 Figure 3.7: Types of hysterisis loops (Donohue, 2012) 53 Figure 3.8: Relative energy (enthalpy) levels of vapour, liquid water,
frozen and bound water as a function of moisture content
(Skaar, 1998 in Time, 1998) 56
xvi
Figure 3.11: Moisture buffering Equivalent volume
(Padfield and Jensen, 2009) 66
Figure 3.12: Tortuosity (Hens, 2007) 70
Figure 3.13: Sedlbauer’s isopleth system for substrate class I
(Vereecken, 2012) 71
Figure 4.1: The research methods and their relationship 76 Figure 4.2: Schematic diagram of the research method 79
Figure 4.3: The material assessment pyramid 80
Figure 4.4: Illustration of hemp samples; (a) hemp-1, (b) hemp-2, (c) hemp-3, (d) hemp-4, (e) hemp-5, (f) perspective
image of hemp-2. Scale bar: 1 cm 83
Figure 4.5: Illustration of wood fibre insulation sample. Scale bar: 1 cm 84 Figure 4.6: Illustration of sheep wool insulation sample. Scale bar: 1 cm 84 Figure 4.7: Illustration of stone wool insulation sample. Scale bar: 1 cm 84 Figure 4.8: Microscopic image of the sample of the hemp-1 insulation.
Scale bar: 100 µm 85
Figure 4.9: Microscopic image of the sample of the hemp-1
insulation. Scale bar: 100 µm 85
Figure 4.10: Microscopic image of the sample of the hemp-2
insulation. Scale bar: 100 µm 86
Figure 4.11: Microscopic image of the sample of the hemp-2
insulation. Scale bar: 100 µm 86
Figure 4.12: Microscopic image of the sample of the hemp-3
insulation. Scale bar: 100 µm 87
Figure 4.13: Microscopic image of the sample of the hemp-3
insulation. Scale bar: 100 µm 87
Figure 4.14: Microscopic image of the sample of the hemp-4
insulation. Scale bar: 100 µm 88
Figure 4.15: Microscopic image of the sample of the hemp-4
insulation. Scale bar: 100 µm 88
Figure 4.16: Microscopic image of the sample of the hemp-5
insulation. Scale bar: 100 µm 89
Figure 4.17: Microscopic image of the sample of the hemp-5
xvii
Figure 4.18: Microscopic image of the sample of the stone wool
insulation. Scale bar: 100 µm 90
Figure 4.19: Microscopic image of the sample of the stone wool
insulation. Scale bar: 100 µm 90
Figure 4.20: Microscopic image of the sample of the wood fibre
insulation. Scale bar: 100 µm 91
Figure 4.21: Microscopic image of the sample of the wood fibre
insulation. Scale bar: 100 µm 91
Figure 4.22: Microscopic image of the sample of the sheep wool
insulation. Scale bar: 100 µm 92
Figure 4.23: Microscopic image of the sample of the sheep wool
insulation. Scale bar: 100 µm 92
Figure 4.24: TheTAS climate chamber 96
Figure 4.25: The Feutron dual climate chamber 97
Figure 4.26: The CR100 measurement and control module
(CR1000: Specifications and Technical Data, 2013) 98
Figure 4.27: The 107 thermistor probes 99
Figure 4.28: The CS215 Temperature & Relative Humidity Sensors 100
Figure 4.29: The HFP01 heat flux sensor 100
Figure 4.30: The CS616 water content reflectometer 101 Figure 4.31: The Isomet heat transfer analyser 102 Figure 4.32: The surface and needle probes of the
Isomet heat transfer analyser 102
Figure 4.33: The PGW 4502e precision balance 103
Figure 4.34: The Flir i7 thermal imaging camera 103
Figure 4.35: The digital microscope 104
Figure 4.36: The Cirrus 40 fan heater 104
Figure 4.37: The Fox 600 hot plate 138
Figure 4.38: The Century 4 industrial humidifier 106 Figure 4.39: The TH-810H plug-in humidistat 106 Figure 4.40: Thee dynamic hygrothermal hot box 108 Figure 5.1: The test equipment for determination of
xviii
Figure 5.2: Adsorption of Moisture in the insulation materials
in terms of average moisture content by weight (AMCw)
of each of the insulation types with 1 standard deviation 113 Figure 5.3: Adsorption of Moisture in the insulation materials in terms
of average moisture content by volume (AMCv) of each of
the insulation types with 1 standard deviation 114 Figure 5.4: Adsorption Isotherms of insulation materials by average
moisture content by weight (AMCw) 115
Figure 5.5: Adsorption Isotherms of insulation materials by average
moisture content by volume (AMCv) 115
Figure 5.6: Adsorption-desorption isotherm of hemp-1 with GAB fit in
relation to average moisture content by weight (AMCw) 116 Figure 5.7: Adsorption-desorption isotherm of hemp-2 with GAB fit in
relation to average moisture content by weight (AMCw) 116 Figure 5.8: Adsorption-desorption isotherm of hemp-3 with GAB fit in
relation to average moisture content by weight (AMCw) 117 Figure 5.9: Adsorption-desorption isotherm of hemp-4 with GAB fit in
relation to average moisture content by weight (AMCw) 117 Figure 5.10: Adsorption-desorption isotherm of hemp-5 with GAB fit in
relation to average moisture content by weight (AMCw) 118 Figure 5.11: Adsorption-desorption isotherm of wood fibre with GAB fit in
relation to average moisture content by weight (AMCw) 118 Figure 5.12: Adsorption-desorption isotherm of sheep wool with GAB fit in
relation to average moisture content by weight (AMCw) 119 Figure 5.13: Modified classification of type 2 isotherms
(Blahovic and Yanniotis, 2008) 120
Figure 5.14: Moisture buffering test setup showing hemp, sheep wool
and wood fibre samples 123
Figure 5.15: Moisture buffering values with one standard deviation 124 Figure 5.16: Wood fibre insulation with three layers and hemp-2
insulation 126
Figure 5.17: Test setup for assessing vapour diffusion resistance factor 127 Figure 5.18: Mean μ value with one standard deviation determined by
wet cup tests 129
xix
Figure 5.20: Setup for assessing water absorption coefficient or A-value 131 Figure 5.21: Δmt versus √s plot for hemp-1 insulation, average
of 3 samples 133
Figure 5.22: Δmt versus √s plot for hemp-2 insulation, average
of 3 samples 165
Figure 5.23: Δmt versus √s plot for hemp-3 insulation, average
of 3 samples 134
Figure 5.24: Δmt versus √s plot for hemp-4 insulation, average
of 3 samples 134
Figure 5.25: Δmt versus √s plot for hemp-5 insulation, average
of 3 samples 135
Figure 5.26: A value of Hemp insulations with 1 standard deviation 135 Figure 6.1: The cross section of the setup showing the dynamic
hygrothermal hot box and the air-conditioner 143 Figure 6.2: Installation of sensors inside the insulation 145 Figure 6.3: The cross section of the insulation sample showing the
position of the sensor and probes 145
Figure 6.4: The front elevation of the dual-insulation setup 146
Figure 6.5: The installed samples 146
Figure 6.6: The experimental setup 148
Figure 6.7: Relative humidity and vapour pressure inside the dynamic
hot box and in the insulation external surfaces during test-1 153 Figure 6.8: Relative humidity and vapour pressure inside the dynamic hot
box and in the insulation external surfaces during the test-2 153 Figure 6.9: Condensation is observed in (stone wool)–acrylic interface (a)
while hemp-acrylic interface (b) remains dry 154 Figure 6.10: Dew point temperatures of hemp-2 and stone wool and the
acrylic surface temperature during condensation (test-1) 156 Figure 6.11: Dew point temperatures of hemp-2 and stone wool and the
acrylic surface temperature during condensation (test-2) 156 Figure 6.12: Calculated dew point temperature along the depth of the
hemp-2 and stone wool insulations and the surface
temperatures at those points 157
Figure 6.13: Relative humidity distribution in the insulation materials
xx
Figure 6.14: Adsorption isotherms of hemp-2 and stone wool insulation
in terms of average moisture content by volume (AMCv) 159 Figure 6.15: Water absorption of hemp in relation to √s 159 Figure 6.16: Comparison of WUFI numerical simulations and
experimental results during test-2 in terms of relative humidity and water
content in the insulation-acrylic interface 160 Figure 6.17: Effective equivalent thermal conductivity of hemp-2 and
stone wool insulations during test-1 162
Figure 6.18: Effective equivalent thermal conductivity of hemp-2
and stone wool insulations during test-2 162 Figure 6.19: Equivalent thermal conductivity values of hemp-2 and
stone wool Insulations 163
Figure 6.20: Correlation between ambient temperature difference
and heat flux in hemp-2 and stone wool during test-1 166 Figure 6.21: Correlation between the ambient temperature difference
and heat flux in hemp-2 and Stone wool during test-2 167 Figure 6.22: Relative humidity in the hot box and heat flux in hemp-2
and stone wool insulation during test-1 167 Figure 6.23: Relative humidity in the hot box and heat flux in hemp-2
and stone wool insulation during test-2 168 Figure 6.24: Vapour pressure difference and heat flux in hemp-2
and Stone wool insulation during test-1 168 Figure 6.25: Vapour pressure difference and heat flux in hemp-2 and
stone wool insulation during test-2 169
Figure 6.26: Experimental data and numerical predictions (WUFI) of heat
flux during test-2 170
Figure 6.27: Correlation between ranges of average relative humidity and equivalent thermal conductivity of hemp-2 171 Figure 6.28: Ranges of average relative humidity and corresponding
equivalent thermal conductivity of stone wool 172 Figure 6.29: Correlation between ranges of adsorbed moisture content
xxi
Figure 6.32: Insulation materials to be placed on the EPS frameworks 177 Figure 6.33: The XPS framework and the partition frame 177 Figure 6.34: The insulation materials placed between the hot and cold
chamber 178
Figure 6.35: The insulation materials between the hot and cold chamber
with all the sensors installed 178
Figure 6.36: The temperature and humidity profile of the climate
chamber 180
Figure 6.37: Relative humidity in the middle and in the surface of hemp
insulation 181
Figure 6.38: Relative humidity in the middle and in the surface of stone
wool insulation 182
Figure 6.39: Relative humidity in the insulation-acrylic interface and in
the hot chamber 182
Figure 6.40: Dew formed in acrylic inner surface of stone wool insulation and foggy patches in acrylic inner surface of hemp-2
insulation 183
Figure 6.41: Relative humidity in the insulation-acrylic interface and in the warm chamber during the laboratory experiment and
simulation in the WUFI software 184
Figure 6.42: Internal surface temperatures of the acrylic and the
insulation-acrylic dew point temperatures 185 Figure 6.43: Insulation-acrylic interface air temperature and dew point
temperature 187
Figure 6.44: WUFI simulation data of water content in insulation external surfaces and insulation-acrylic interfaces 188 Figure 6.45: Equivalent thermal conductivity values of hemp-2 and
stone wool insulation along with the values of interior and
insulation-acrylic interface relative humidity 190 Figure 6.46: Equivalent thermal conductivity values of hemp-2 and stone
wool Insulations 191
Figure 6.47: Equivalent thermal conductivity of hemp-2 plotted against
relative humidity 192
Figure 6.48: Equivalent thermal conductivity of stone wool plotted against
xxii
Figure 6.49 Equivalent thermal conductivity plotted against
adsorbed water 193
Figure 6.50: Interior relative humidity and heat flux in hemp-2 and
stone wool insulation 194
Figure 6.51: Vapour pressure difference and heat flux in hemp-2 and
stone wool insulation 194
Figure 6.52: Experimental and WUFI simulation of heat flux in the cold side of hemp insulation (external surface of the acrylic) 195 Figure 6.53: Experimental and WUFI simulation of heat flux in the cold
side of stone wool insulation (external surface of the acrylic) 196 Figure 6.54: Experimental and WUFI simulation of heat flux in the warm
side surface of hemp insulation 197
Figure 6.55: Experimental and WUFI simulation of heat flux in the warm side surface of stone wool insulation 197 Figure 6.56: The front elevation of the dual-insulation setup 202 Figure 6.57: The cross section of the dual-insulation setup 203 Figure 6.58: Thermal conductivity measurement of hemp-2 at 80 EMC
with EPS insulation as a control (40 hours) 205 Figure 6.59: Thermal conductivity measurement of hemp-2 at 95 EMC
with EPS insulation as a control (24 hours measurement) 206 Figure 6.60: Thermal conductivity measurement of hemp-2 at 95 EMC
with EPS insulation as a control (40 hours measurement) 206 Figure 6.61: The typical hygrothermal condition in the ‘problem loft’ 211 Figure 6.62: The conceptual diagram of the lab-based experiment 213 Figure 6.63: The cross section of the experimental set up 214 Figure 6.64: Completed installation of the experimental setup 215
Figure 6.65: The plan view of the setup 215
Figure 6.66: Installation process of the sensors 216 Figure 6.67: Installation of insulation and temperature and relative
humidity sensors 216
Figure 6.68: Installation of the breather membrane box 217 Figure 6.69: Condensed moisture on the acrylic inner surface after the
experiment with stone wool 219
xxiii
Figure 6.71: Mass change in the experimental setups for the insulation
materials 221
Figure 6.72: Relative humidity distribution during the stone wool test 221 Figure 6.73: Relative humidity distribution during the sheep wool test 222 Figure 6.74: Relative humidity distribution during the hemp-1 test 222 Figure 6.75: Relative humidity distribution during the Hemp-4 test 223 Figure 6.76: Equivalent thermal conductivity of the insulations
with error bar 224
Figure 6.77: Heat flux and temperature difference in stone wool
and hemp-4 225
Figure 7.1: The test building showing the test wall 230
Figure 7.2: The plan of the test building 231
Figure 7.3: Three dimensional computer image of the test building
with the roof removed 231
Figure 7.4: Construction of the outer layer of the test building 232 Figure 7.5: Installation of the EPS insulation and breather membrane 232 Figure 7.6: Installation of the OSB boards and timber frames for
wall panels 233
Figure 7.7: Installation of the EPS insulation in the eastern wall 233 Figure 7.8: Horizontal cross section showing panel A and pane B
and sensor locations in assembly-1 235
Figure 7.9: Horizontal cross section showing panel A and panel B and
sensor locations in assembly-2 236
Figure 7.10: Sedlbauer’s isopleth system for substrate class I 238 Figure 7.11: The setup process showing the inner OSB linings and the
temperature and relative humidity sensors 243 Figure 7.12: The installation of the inner layer of the insulation with the
sensors 243
Figure 7.13: The installation of the outer layer of the insulation 244 Figure 7.14: The installation of the surface lining and the sensors 244 Figure 7.15: Surface temperatures in OSB inner lining, (a) panel A
and (b) panel B 245
xxiv
Figure 7.19: Heat flux in panels with plasterboard lining during test-1.2 247 Figure 7.20: Relative humidity and soil moisture content equivalent in
hemp-PB interfaces and interior relative humidity during
test-1.1 248
Figure 7.21: Relative humidity and soil moisture content equivalent in hemp-PB interfaces and interior relative humidity
during test-1.2 249
Figure 7.22: Equivalent thermal conductivity values (λequi) with
error bar during test-1.1 250
Figure 7.23: Equivalent thermal conductivity values (λequi) with error
bar during test-1.2 250
Figure 7.24: Average equivalent thermal conductivity values (λequi) with error bar during test-1.1 and test-1.2. 251 Figure 7.25: (Hemp-1)-OSB interface conditions against Sedlbauer’s
isopleth during the test-1.1 252
Figure 7.26: 11 days’ conditions of (hemp-1)-OSB interface condition
against Sedlbauer’s 8 day isopleth line during test-1.1 253 Figure 7.27: (Hemp-1)-OSB interface condition against Sedlbauer’s
isopleth during test-1.2 254
Figure 7.28: The vertical cross section of the wall panel 256 Figure 7.29: Hem-1 and hemp-2 insulation materials respectively 257 Figure 7.30: The temperature and relative humidity boundary
conditions during the experiment 258 Figure 7.31: Heat Flux data gathered from the surface of the
plasterboards during test-2 259
Figure 7.32: Heat flux data gathered from insulation-OSB
interfaces during test-2 259
Figure 7.33: Relative humidity and moisture content in the
insulation-OSB interface during test-2 260 Figure 7.34: Equivalent thermal conductivity values with error bar 262 Figure 7.35: Adsorption isotherms of hemp-1 and hemp-2 263 Figure 7.36: Hygrothermal conditions in the insulation-OSB interface
xxv
Figure 7.38: Heat Flux in panel A (hemp-2) and panel B (stone wool) based on the heat flux sensors located on the inner plaster
board surfaces 268
Figure 7.39: Heat Flux in panel A (hemp-2) and panel B (stone wool) based on the heat flux sensors located in the
insulation-OSB interfaces 268
Figure 7.40: The equivalent thermal conductivity values of the
Insulations 270
Figure 7.41: The relative humidity conditions at insulation-OSB
interfaces 270
Figure 7.42: The insulation-OSB interface hygric conditions 271 Figure 7.43: The insulation-OSB interface hygric conditions 272 Figure 7.44: 39 Days' Hygrothermal Condition in (stone wool)-OSB
Interface 273
Figure 7.45: Continuous 11 days hygrothermal condition in
(stone wool)-OSB interface 273
Figure 7.46: 40 Days' Hygrothermal Condition in (hemp-2)-OSB
Interface 274
Figure 7.47: Continuous 11 days hygrothermal condition in
(hemp-2)-OSB interface 274
Figure 8.1: Moisture distribution in the slab in 7 days, 30 days and 365 days (Benchmark Test of EN 15026, 2012) 278 Figure 8.2: Temperature distribution in the slab in 7 days, 30 days
and 365 days (Benchmark Test of EN 15026, 2012) 279 Figure 8.3: Effect of (%) change of parameters on (%) change of
water content in Hemp-2 from base case 281 Figure 8.4: Effect of (%) change of parameters on (%) change of water
content in (hemp-2)-OSB interface from base case 282 Figure 8.5: Effect of (%) changes of parameters on (%) changes of
relative humidity in (hemp-2)-OSB interface from
base case 282
xxvi
Figure 8.7: Effect of (%) changes of parameters on (%) changes of temperature in hemp-2 from base case 283 Figure 8.8: Effect of (%) changes of parameters on (%) changes of
temperature in hemp-2 from base case(ranges of y axis
narrowed down to ±1%) 284
Figure 8.9: The vertical cross section of the timber frame wall assembly
without vapour barrier (wall-1) 285
Figure 8.10: The vertical cross section of the timber frame wall assembly
with vapour barrier (wall-2) 286
Figure 8.11: The vertical cross section of the solid brick wall assembly
without vapour barrier (wall-3) 287
Figure 8.12: The vertical cross section of the solid brick wall assembly
with vapour barrier (wall-4) 288
Figure 8.13: The vertical cross section of the solid brick wall assembly
(with air gap) without vapour barrier (wall-5) 288 Figure 8.14: The vertical cross section of the solid brick wall assembly
(with air gap) assembly with vapour barrier (wall-6) 289 Figure 8.15: The vertical cross section of the solid brick wall assembly
(with lime plaster) without vapour barrier (wall-7) 289 Figure 8.16: The vertical cross section of the solid brick wall assembly
(with lime plaster) with vapour barrier (wall-8) 290 Figure 8.17: The study of an insulated solid brick wall to explore the
time required to reach hygrotheral equilibrium 292 Figure 8.18: Relative humidity conditions in (hemp-1)-OSB
interfaces in wall-1 and wall-2 in Edinburgh 293 Figure 8.19: Relative humidity conditions in the (hemp-2)-OSB
interfaces in wall-1 and wall-2 in Edinburgh 294 Figure 8.20: Relative humidity conditions in the (stone wool)-OSB
interfaces in wall-1 and wall-2 in Edinburgh 294 Figure 8.21: Relative humidity conditions in the Insulation OSB
interfaces in wall-1 and Wall-2 in Edinburgh 295 Figure 8.22: Relative humidity conditions in the inner surfaces
of the hemp-1 insulations in wall-1 and wall-2
xxvii
Figure 8.23: Relative humidity conditions in the inner surfaces of
the hemp-2 insulations in wall-1 and wall-2 in Edinburgh 296 Figure 8.24: Relative humidity conditions in the inner surfaces
of the stone wool insulations in wall-1 and wall-2
in Edinburgh 296
Figure 8.25: Water content in the (hemp-1)-OSB interfaces of wall-1
and wall-2 in Edinburgh 297
Figure 8.26: Water content in the (hemp-2)-OSB interfaces of wall-1
and wall-2 in Edinburgh 297
Figure 8.27: Water content in the stone wool-OSB interfaces of
wall-1 and wall-2 in Edinburgh 298
Figure 8.28: Water content in the insulation-OSB interfaces of wall-1
and wall-2 in Edinburgh 298
Figure 8.29: Estimated and critical water content in the mould spore in
The (hemp-1)-OSB interface of the timber frame walls without vapour barrier (wall-1) in Edinburgh 300 Figure 8.30: Estimated and critical water content in the mould spore in
the (hemp-1)-OSB interface of the timber frame walls with
vapour barrier(wall-2) in Edinburgh 300
Figure 8.31: Estimated and critical water content in the mould spore in the (hemp-2)-OSB interface of the timber frame walls
without vapour barrier (wall-1) in Edinburgh 301 Figure 8.32: Estimated and critical water content in the mould spore
in the (hemp-2)-OSB interface of the timber frame walls
with vapour barrier (wall-2) in Edinburgh 301 Figure 8.33: Estimated and critical water content in the mould spore
in the (stone wool)-OSB interface of the timber frame
walls without vapour barrier (wall-1) in Edinburgh 302 Figure 8.34: Estimated and critical water content in the mould spore in
the (stone wool)-OSB interface of the timber frame walls
with vapour (wall-2) barrier in Edinburgh 302 Figure 8.35: Hygrothermal condition in the (hemp-1)-OSB interface of
timber frame walls without vapour barrier (wall-1)
xxviii
Figure 8.36: Hygrothermal condition in the (hemp-1)-OSB interface of
timber frame walls with vapour barrier (wall-2) in Edinburgh 303 Figure 8.37: Hygrothermal condition in the (hemp-2)-OSB interface of
frame timber walls without vapour (wall-1) barrier
in Edinburgh 304
Figure 8.38: Hygrothermal condition in the (hemp-2)-OSB interface of timber frame walls with vapour barrier (wall-2) in Edinburgh 304 Figure 8.39: Hygrothermal condition in the (stone wool)-OSB interface of
timber frame walls without vapour barrier (wall-1)
in Edinburgh 305
Figure 8.40: Hygrothermal condition in the (stone wool)-OSB interface of timber frame walls with vapour barrier (wall-2) in Edinburgh 305 Figure 8.41: Mould index in insulation-OSB interfaces for different
insulations in Edinburgh 306
Figure 8.42: Mould growth in insulation-OSB interfaces for different
insulations in Edinburgh 307
Figure 8.43: Equivalent thermal conductivity values of the insulations
in Edinburgh 308
Figure 8.44: Relative humidity conditions in the (hemp-1)-OSB
interfaces for timber frame walls with and without vapour
barrier in Birmingham 309
Figure 8.45: Relative humidity conditions in the (hemp-2)-OSB
interfaces in wall-1 and wall-2 in Birmingham 310 Figure 8.46: Relative humidity conditions in the (stone wool)-OSB
interfaces in wall-1 and wall-2 in Birmingham 310 Figure 8.47: Relative Humidity conditions in the inner surfaces of the
hemp-1 insulations in wall-1 and wall-2 in Birmingham 311 Figure 8.48: Relative Humidity conditions in the inner surfaces of the
hemp-2 insulations in wall-1 and wall-2 in Birmingham 311 Figure 8.49: The relative humidity conditions in the inner surfaces of the
stone wool insulations in wall-1 and wall-2 in Birmingham 312 Figure 8.50: Relative humidity conditions in the inner surfaces of the
insulations in wall-1 and wall-2 in Birmingham 312 Figure 8.51: Water content in the (hemp-1)-OSB interfaces in wall-1
xxix
Figure 8.52: Water content in the (hemp-2)-OSB interfaces in wall-1
and wall-2 in Birmingham 314
Figure 8.53: Water content in the (stone wool)-OSB interfaces in wall-1
and wall-2 in Birmingham 314
Figure 8.54: Water content in the insulation-OSB interfaces in wall-1
in Birmingham 315
Figure 8.55: Water content in the insulation-OSB interfaces in wall-2 in
Birmingham 315
Figure 8.56: Estimated and critical water content in the mould spore in
the (hemp-1)-OSB interfaces in wall-1 in Birmingham 316 Figure 8.57: Estimated and critical water content in the mould spore
in the (hemp-1)-OSB interface in wall-2 in Birmingham 317 Figure 8.58: Estimated and critical water content in the mould spore
in the (hemp-2)-OSB interface in wall-1 in Birmingham 317 Figure 8.59: Estimated and critical water content in the mould spore
in the (hemp-2-OSB) interface in wall-2 in Birmingham 318 Figure 8.60: Estimated and critical water content in the mould spore
in the (stone wool)-OSB interface in wall-1 in Birmingham 318 Figure 8.61: Estimated and critical water content in the mould spore in
the (stone wool)-OSB interface in wall-2 in Birmingham 319 Figure 8.62: Hygrothermal condition in the (hemp-1)-OSB in wall-1
in Birmingham 319
Figure 8.63: Hygrothermal condition in the (hemp-1)-OSB interface
in wall-2 in Birmingham 319
Figure 8.64: Hygrothermal condition in the (hemp-2)-OSB interface in
wall-1 in Birmingham 320
Figure 8.65: Hygrothermal condition in the (hemp-2)-OSB interface in
wall-2 in Birmingham 321
Figure 8.66: Hygrothermal condition in the (stone wool)-OSB in wall-1
in Birmingham 321
Figure 8.67: Hygrothermal condition in the (stone wool)-OSB interface
in wall-1 in Birmingham 322
Figure 8.68: Predicted mould index in the insulation-OSB interfaces of
xxx
Figure 8.69: Predicted mould growth in the insulation-OSB interfaces
of timber frame walls (Birmingham) 323
Figure 8.70: Equivalent thermal conductivity values of the insulations in
wall-1 and wall-2 in Birmingham 324
Figure 8.71: Relative humidity in (hemp-1)-Brick, (hemp-1)-air and (hemp-1)-lime interfaces in walls with and without vapour
barrier in Edinburgh 326
Figure 8.72: Relative humidity in (hemp-2)-Brick, (hemp-2)-air and (hemp-2)-lime interfaces in walls with and without vapour
barrier in Edinburgh 326
Figure 8.73: Relative humidity in(stone wool)-Brick, (stone wool)-air and (stone wool)-lime interfaces in walls with and without
vapour barrier in Edinburgh 327
Figure 8.74: Relative humidity in the hemp-2 inner surface of the
wall-7 and wall-8 in Edinburgh during October 1991 to
November 1995 328
Figure 8.75: Relative humidity in the hemp-2 inner surface of the
wall-7 and wall-8 in Edinburgh during 1994 328 Figure 8.76: Hygrothermal condition in the (hemp-2)-air interface of
wall-5 in Edinburgh 329
Figure 8.77: Estimated and critical water content in the mould spore in
the (hemp-2)-air interface of wall-5 in Edinburgh 330 Figure 8.78: Predicted mould index in the (hemp-2)-air interface of
wall-5 in Edinburgh 330
Figure 8.79: Predicted mould growth in the (hemp-2)-air interface of
wall-5 in Edinburgh 331
Figure 8.80: Equivalent U-values of walls incorporating hemp-1
insulations in Edinburgh 331
Figure 8.81: Equivalent U-values of walls incorporating hemp-2
insulations in Edinburgh 332
Figure 8.82: Equivalent U-values of walls incorporating stone wool
insulations in Edinburgh 332
Figure 8.83: Relative humidity in the (hemp-1)-brick, (hemp-1)-air and
xxxi
Figure 8.84: Relative humidity in the (hemp-2)-brick, (hemp-2)-air and
(hemp-2)-lime interfaces of solid brick walls in Birmingham 334 Figure 8.85: Relative humidity in the (stone wool)-brick, (stone wool)-air
and (stone wool)-lime interfaces of solid brick walls
in Birmingham 334
Figure 8.86: Hygrothermal condition in the (hemp-2)-air interface of the
wall-5 in Birmingham 335
Figure 8.87: Estimated and critical water content in the mould spore in
the (hemp-2)-air interface of wall-5 in Birmingham 336 Figure 8.88: Predicted mould index in the (hemp-2)-air interface of
wall-5 in Birmingham 336
Figure 8.89: Predicted mould growth in the (hemp-2)-air interface of
wall-5 in Birmingham 337
Figure 8.90: Equivalent U-values of walls incorporating hemp-1
insulations in Birmingham 337
Figure 8.91: Equivalent U-values of walls incorporating hemp-2
insulations in Birmingham 338
Figure 8.92: Equivalent U-values of walls incorporating stone wool
insulations in Birmingham 338
Figure 8.93: The relative humidity the insulation-air interfaces of wall-5
in Edinburgh and Birmingham 340
Figure A.1: Transient hot wire apparatus 367
Figure A.2: Isomet heat analyser at CAT 368
Figure B.1: Conductivity readings at 23 °C temperature and 50%
relative humidity 370
Figure B.2: Conductivity readings at 90 °C temperature and 10%
relative humidity 370
Figure B.3: Conductivity readings at 10 °C temperature and 80%
relative humidity 371
Figure C.1: Thermal conductivity of hemp insulation
determined by using supplement 375
Figure D.1: Thermal images showing (a) wall panel location
(b) eastern wall, without insulations 376
Figure D.2: Thermal images showing (a) wall panel location
xxxii
Figure D.3: Illustration showing the test and the residential building 376
Figure E.1: The wall section 378
Figure E.2: Moisture content in hemp-2 insulation 379 Figure E.3: The plan of the notional building for the IES software 380 Figure E.4: The IES software image of the simulated buildings 380 Figure E.5: The monthly space conditioning sensible loads of the
selected buildings in Edinburgh 381
Figure E.6: The monthly space conditioning sensible loads of the
selected buildings in Birmingham 382
xxxiii
List of Tables
Table 2.1: Thermal conductivity values of the insulations
(adapted from Ye et al., 2005) 17
Table 2.2: Thermal properties of some building materials 19 Table 3.1: Mould spore germination conditions in IEA-Annex 14 71 Table 4.1: Summary of the properties of the hemp insulations 93 Table 4.2: Summary of the properties of stone wool insulation 94 Table 4.3: Summary of the properties of the sheep wool insulation 94 Table 4.4: Summary of the properties of the wood fibre insulation 95 Table 4.5: Dimensions of the TAS climate chamber 95 Table 4.6: Range and accuracy of conditioning of the TAS
climate chamber 96
Table 4.7: Dimensions of the Feutron dual climate chamber 96 Table 4.8: Range and accuracy of conditioning of the chambers 97 Table 4.9: Technical details of the CR100 measurement and
control module 98
Table 4.10: Technical details of CS616 water content reflectometer 101 Table 4.11: Range and accuracy of conditioning of the chambers 101 Table 4.12: Capacity and accuracy of the precision weighing scale 102 Table 4.13: Technical details of the Flir i7 thermal imaging camera 103 Table 4.14: Technical details of the HooToo digital microscope. 104 Table 4.15: Technical details of the Fox 600 hot plate 105 Table 5.1: The test conditions for all insulation samples 122 Table 5.2: Mean practical moisture buffer value of the Hemp
insulations 124
Table 5.3: Ranges for practical Moisture Buffer Value classes
(Rode, 2005) 125
Table 5.4: μ values and Sd values of the insulations 129 Table 5.5: Mean Aw,24 value of the Hemp insulations 136 Table 6.1: Overview of the experimental tests 140 Table 6.2: Equivalent and design values of thermal conductivity of
xxxiv
Table 6.3: The average heat flux values of hemp-2 and stone wool
insulation materials 169
Table 6.4: The average interior relative humidity and the corresponding equivalent thermal conductivity values of hemp-2 insulation
along with adsorption water content 171
Table 6.5: The temperature and relative humidity profile of the
climate chamber 179
Table 6.6: Experimental and design value of thermal conductivity with
standard deviations 191
Table 6.7: Moisture migration during conductivity measurements of
hemp-2 at 85 EMC during test-1 207
Table 6.8: Moisture migration during conductivity measurements of
hemp-2 at 95 EMC during test-2 208
Table 6.9: Different values of thermal conductivity 209 Table 6.10: Representative data for experimental simulation of the loft
hygrothermal conditions 212
Table 6.11: The experimental protocol 218
Table 6.12: Moisture accumulation in the acrylic, the breather membrane
box and in the insulation materials 220
Table 6.13: Equivalent thermal conductivity of the insulations 224 Table 7.1: Average external temperatures (temp) in the UK and
Wales during January, February, July and August 234
Table 7.2: The test setup and duration 241
Table 7.3: U-value of the wall panel A and panel B and equivalent thermal conductivity of the hemp insulation measured
according to the ISO 9869 248
Table 7.4: The setup and duration of test-2 255 Table 7.5: U-value of the wall panel A and panel B and equivalent
thermal conductivity of the hemp insulation measured
according to the ISO 9869 260
Table 7.6: The test setup and duration 265
xxxv
Table 7.8: U-values of the wall panel A (hemp-1) and panel B (stone wool) and λequi values of hemp-2 and stone wool
insulation materials 269
Table B.1: Material properties of the insulations 369 Table C.1: Thermal conductivity of hemp insulation determined by
using thermal conductivity supplement 372 Table C.2: Thermal conductivity of hemp insulation determined by
using effective thermal conductivity value 373 Table C.3: Design values of thermal conductivity of hemp insulation 374 Table F.1: Effect of change of parameter values (%) on change of water
content (%) in hemp-2 from the base case 384 Table F.2: Effect of change of parameter values (%) on change of relative
humidity (%) in (hemp-2)-OSB interface from the base case 384 Table F.3: Effect of change of parameter values (%) on change of water
content (%) in (hemp-2)-OSB interface from the base case 385 Table F.4: Effect of change of parameter values (%) on change of
xxxvi
List of Abbreviations and Acronyms
ACC Aerated cellular concrete
ACE Association for the Conservation of Energy ASTM American Society of Testing and Materials BET Brunauer, Emmett and Teller
BMP Bitmap image file
BRE Building Research Establishment
BREAM Building Research Establishment Environmental Assessment Method
BS British Standards
DCLG Department for Communities and Local Government DECC Department of Energy and Climate Change
DETR Department of the Environment, Transport and the Regions EEP Extruded polystyrene
EMC Equilibrium moisture content
EN European Standards
EPS Expanded polystyrene
FSP Fibre saturation point
GAB Guggenheim/ Andersen/ de Boer
GP Gypsum plaster
IEA International Energy Agency
xxxvii
IPCC Intergovernmental Panel on Climate Change ISO International Organization for Standardization IUPAC International Union of Pure and Applied Chemistry JPEG Joint Photographic Experts Group
LIM Lowest isopleth for mould MBV Moisture buffer value MFA Microfibril angle
MMC Modern method of construction
MMF Man-made fibre
N-DEEM Non-Domestic building Energy and Emissions Model NIST National Institute of Standards and Technology Nordtest Nordic organisation for cooperation within the area of
testing
NPL National Physical Laboratory
NTP National Toxicology Program
OH Hydroxyl
OSB Oriented strand board
PE Polyethylene
PF Polyurethane foam
ppm Parts per million
PW Plywood
RH Relative humidity
xxxviii TSB Technology Strategy Board
UNEP United Nations Environment Programme
VB Vapour barrier
VO Vapour open
VWC Volumetric water content
WFB Wood fibreboard
xxxix
Acknowledgements
I am greatly indebted to Dr Mihaela Anca Ciupala, Dr Simon Tucker, Mr Darryl Newport and Professor D C Wijeyesekera for their meticulous supervision and continued encouragement.
I would like to thank the Technology Strategy Board, the University of East London and the other partners of the ‘Energy Efficient Bio-based Natural Fibre Insulation’ project for the PhD studentship and continued support without which this work would not have been possible. Grateful thanks are extended to the Centre for Alternative Technology (CAT) where I was on secondment during the whole period of my doctoral studies.
I am grateful to the Faculty of Civil Engineering and Building Services of ‘Gheorghe Asachi’ Technical University of Iași, Romania, for allowing me to use their climate chamber. I would like to thank Dr Mihaela Anca Ciupala again for being instrumental in arranging this travel and introducing me to the ‘Going Global’ travel grant.
Particular thanks must go to Professor Tom Woolley, Dr Robert Elias, Dr Andrew Hewitt, Dr Marian Pruteanu, Dr Arthur Butler, Mr Giles Ranyl Rhydwen, Mr Gary Newman, Ms Ceri Loxton, Mr Christof Fehr, Ms Blanche Cameron, Ms Paula Amani, Ms Linda Day and Mr Will Bryson for their kind support at various stages of the research. I would also like to convey my gratitude to Mr Neil May for sharing his wealth of knowledge on natural building materials and for providing the wood fibre samples.
xl To
1
Chapter 1
Introduction
1.1 Background
This thesis explores the hygrothermal performance of bio-based fibrous thermal insulations with particular reference to the use of hemp in the UK. The rationale for the research is rooted in the global context of concerted efforts to mitigate the adverse effects of climate change and resource depletion.
Among the bio-based thermal insulation materials, the hemp insulation is of particular importance in the UK. Hemp is a high yield and low input crop with the additional advantages of being a break crop in cereal rotations. Other benefits include excellent weed control and less field operation (Hemp Technology, 2012a). The largest hemp fibre processing plant in the world with the highest production capacity is located in the UK from where much of the locally grown hemp fibres are processed and supplied to the domestic and international market. Hemp fibre is a renewable, sustainable and carbon negative material (Hemp Technology, 2012b). The aforementioned agricultural, processing and environmental benefits of hemp make hemp insulation potentially relevant to the UK construction sector.
The ‘Earth System’ is facing unprecedented threats from human interference. Anthropogenic activities, with 90% probability (IPCC, 2007), are changing the dynamics of atmospheric, geological, hydrological, biological and other Earth System processes (UNEP, 2012). Most evident of the changes are the rise in global average air and sea level temperature and ocean acidification, both triggered by increasing greenhouse gas emission, especially carbon and methane (UNEP, 2012). Sea level is rising at the average rate of 3.1 mm per year with thermal expansion contributing about 57%, melting of glacier and ice caps about 28% and decrease of polar ice sheet contributing the remainder to the total rise (IPCC, 2007).
2
resulting in about 20% increase in radiative forcing (IPCC, 2007). The best estimate predicts that 450 ppm of CO2equivalent radiative forcing will increase
the global mean equilibrium surface temperature by 2.1 °C over the pre-industrial level (IPCC, 2007). More than 2°C rise in global temperature is described as the ‘dangerous anthropogenic interference with the climate system’ (UNEP, 2010) beyond which the risk of severe damage to ecosystem and of nonlinear responses are expected rapidly (IPCC, 2007). The business as usual scenario is a 6 °C rise in temperature by the end of the century (IEA, 2008).
Two-thirds of the anthropogenic contributor to CO2 emission is fossil fuel, of
which about 37% of the emission is from oil, 43% from coal/peat and 14% from natural gas (IEA, 2011). To avert the global temperature rise to a dangerous level, a paradigm shift from human civilization’s dependence on hydrocarbon based energy to clean energy is apparently inevitable.
Yet climate change is not the only risk necessitating immediate mitigating action. Human consumptions are not in harmony with the earth’s natural support system. Twenty per cent of the world’s seven billion population are consuming seventy seven per cent of the earth’s resources at a pace and intensity that outdo the earth’s capacity to neutralize the adverse effects (Kummel, 2011). Resource depletion and degradation at a planetary scale are gradually pushing the human civilization to the edge of catastrophe. Production of oil and ‘non-renewable water’ (Palaniappan and Gleick, 2009) are predicted to reach their peak nearly at the same time (Brown, 2011) irrespective of one being stock-limited and the other being flow-limited.
Against this overwhelmingly challenging backdrop, the United Kingdom has made the legally binding commitment to reduce greenhouse gas emissions by 80% compared to the 1990 baseline by the year 2050 (Great Britain. Climate Change Act 2008). Any deep cut in CO2 emission in the UK requires involving
the construction sector, since about 55% of the total CO2 emission from the UK
3
Figure 1.1: Built environment and CO2 emission (IGT, 2010).
Within the domestic sector in the UK, the highest amount of energy is being used for space heating (IGT, 2010) which can be explained by the fact that 75% of the existing domestic buildings were built before energy efficiency was taken into consideration in the building regulations in 1975 (Utley and Shorrock, 2012, Mackenzie et al., 2010). It has been estimated that there is a technical potential of 40% reduction of CO2 emission of these houses of which 20% is achievable
by adopting cost effective measures such as using energy efficient boilers and appliances and improving insulation standards (Mackenzie et al., 2010). Among the cost effective measures, improving insulation standards can contribute to about 65% of total carbon reduction (Halliday, 2008). Studies suggests that most of the 7.7 million houses with solid brick walls and about 7.6 million of the 19 million houses with cavity walls are uninsulated (DECC, 2012) while about 9 million lofts are inadequately insulated. About 25 million out of existing 26.7 million houses will still be present in 2050 (Boardman, 2007; DECC, 2012; ACE, 2012). Subsequently, these housing stocks need to be thermally upgraded to become energy efficient in line with the carbon reduction target set by the UK government. One-quarter of the 2050 housing stock, consisting of post-2010 houses, will be gradually built with an annual construction rate of 240,000 houses to meet the demand of about 31.8 million houses by 2050. These houses will be built by the standards set in the Code for Sustainable Homes
Domestic Buildings
27% Non-Residential
Buildings 18%
Other 45%
Manufacture
8% Distribution
Operation On-site Refurb & Demolition
Design
Construction Process
4
(DCLG, 2006), particularly by the Code Level 6 from 2016 onward. At any rate, the building fabrics of these housing stocks have to be well insulated. Apart from this, increasing interest in Passivhaus design standards (Passivhaus, 2012) will mean that many of the fabrics of the houses will potentially be built with very high amount of thermal insulations. For the insulation market, it implies that there will be a steady demand for thermal insulations for next 40 years.
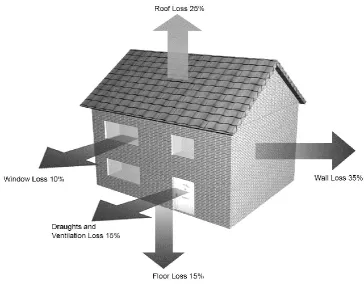
[image:44.595.140.505.259.544.2]The importance of thermal insulation particularly in the lofts and walls can be understood from Figure 1.2 (after McMullan, 2007).
Figure 1.2: Heat loss through the envelope of an uninsulated home (after McMullan, 2007).
5
Figure 1.3: Insulation measures (Utley and Shorrock, 2012).
Among the non-domestic buildings, about 60% of the existing stock will remain in 2050 and many will require upgrade in terms of energy use (Mackenzie et al., 2010). Fabric insulation in the existing non-domestic buildings can save around 4.7 Mt (million tons) CO2/year (Caleb, 2012). The new non-domestic buildings,
on the other hand, will be built according to the energy efficiency measures set in the building regulations.
The Use of higher amount of insulation materials can potentially increase the embodied carbon of the building. It has been suggested that between 2%- 36% of the lifetime energy demand of a conventional house is attributable to the embodied energy of the building materials and this can increase to 9%-46% for a low energy building (Monahan and Powell, 2011). However, the amount of embodied carbon can be kept low by using low energy and renewable materials. The Centre for the Built Environment of the University of East Anglia (2013) observed that an average low energy house built with conventional building materials, to attain the Code Level 6, can contain about 50 tonne (t) CO2 as embodied carbon compared to the 18 tonne CO2 in a low energy house
built with renewable materials designed according to the Code Level 4.
To reduce the embodied and operational energy of the buildings, thermal insulations need to be produced from low-energy and renewable materials and should meet the key operational performance criteria. The key performance criteria of thermal insulation materials are to control heat flow through the building envelope and to manage moisture. Additionally, thermal insulation
0 20 40 60 80 100
1921 1931 1941 1951 1961 1971 1981 1991 2001 2011
Ho u se h o ld (% ) Year