User generated (web) content: trash or treasure
Giovanni M. Alluvatti
*, Andrea Capiluppi
**, Giuseppe De Ruvo
*, and Marco Molfetta
**
RCOST, University of Sannio (Italy), {giovannimaria.alluvatti, giuseppe.deruvo,
marco.molfetta}@studenti.unisannio.it
**
DSE, University of East London (UK), [email protected]
ABSTRACT
It has been claimed that the advent of user-generated content has reshaped the way people approached all sorts of content realization projects, being multimedia (YouTube, DeviantArt, etc.), knowl-edge (Wikipedia, blogs), to software in general, when based on a more general Open Source model.
After many years of research and evidence, several studies have demonstrated that Open Source Software (OSS) portals often con-tain a large amount of software projects that simply do not evolve, often developed by relatively small communities, and that still strug-gle to attract a sustained number of contributors. In terms of such content, the “tragedy” appears to be that the user demand for con-tent and the offer of experts contributing concon-tent are on curves with different slopes, with the demand growing more quickly.
In this paper we argue that, even given the differences in the re-quested expertise, many projects reliant on user-contributed content and expertise undergo a similar evolution, along a logistic growth: a first slow growth rate is followed by a much faster evolution growth. When a project fails to attract more developers i.e. contrib-utors, the evolution of project’s content does not present the “explo-sive growth” phase, and it will eventually “burnout”, and the project appears to be abandoned. Far from being a negative finding, even abandoned project’s content provides a valuable resource that could be reused in the future within other projects.
1.
INTRODUCTION
The similarities between OSS projects and the more general user-generated content (UGC), such as Wikipedia, have been already proposed and discussed [19, 21, 24]. Both environments are based on the open source model, which is essentially people-centered: people, not paid content-creators1, use their time to contribute or revise knowledge and content, in a collaborative effort to create var-ious “types” of publicly available knowledge-based products [8].
1
Although a mixed approach to develop OS software by paid de-velopers has been documented, and it’s becoming a very effective business model [6]
Permission to make digital or hard copies of all or part of this work for personal or classroom use is granted without fee provided that copies are not made or distributed for profit or commercial advantage and that copies bear this notice and the full citation on the first page. To copy otherwise, to republish, to post on servers or to redistribute to lists, requires prior specific permission and/or a fee.
IWPSE ’11
Copyright 2011 ACM X-XXXXX-XX-X/XX/XX ...$10.00.
Such user-generated content has become substantial in quantity (and relevant in quality [7]) during the last few years, and centered around major topics and websites: multimedia (YouTube, Flickr, DeviantArt, etc), expert knowledge on specific topics (Slashdot.org, IMDB, Wi-kipedia, etc), let alone all the source code released with open li-censes through well known OSS repositories (SourceForge, Google Code, etc). Similarly to OSS projects, UGC’s face an “uncon-trolled, self-organized community of volunteer contributors, with-out the traditional tight conditions and organizational policies im-posed in industrial production environments” [21]. Also similarly to OSS projects, UGC’s are essentially based on measurable effort of volunteers and produce measurable output with a determined productivity that can be tracked throughout the content’s evolution, by parsing the recorded history of changes.
Computer scientists have a good understanding of the challenges faced when evolving OSS systems: challenges in the coordina-tion of efforts, in the continuous evolucoordina-tion and maintenance of content, in the recruitment of new contributors, let aside the com-plexity of the task at hand. However, discording results have been found in the past when analysing the evolution of OSS projects: on the one hand, some studies have claimed that the OSS model can achieve evolutionary patterns not observed before in propri-etary systems [11, 12, 14, 22, 28]. On the other hand, empirical studies on randomly chosen OSS projects have shown that most of the OSS projects are small and inactive, and tend to involve a small number of developers and contributors [4, 9, 16, 26, 27]. One of the reasons for such diverse results is due to the type of analysed systems, and the selection process: when randomly sampling, or considering the overall set of projects of large OSS repositories, the findings tend to be uniform and confirmed. Conversely, when sam-pling a specific, representative sample of successful OSS projects, the findings tend to be more sparse and optimistic: this has been found when analysing specific, successful OSS projects, including packages in the Debian/Linux distribution, or some of the flagship OSS projects (Linux, KDE, Apache, Samba, etc.)
Whether similar challenges, patterns of evolution, or results, are found generally in any UGC (Wikipedia, blogs, OSS projects, etc), and how the lessons learned from OSS evolution can be applied to a more general UGC evolution, are questions that still need to be studied, and they represent the object of this study. In order to do so, this paper analyses two types of UGC: firstly, a random selec-tion of active OSS projects extracted from one of the categories of SourceForge; secondly, a selection of Wikipedia pages, belonging to the same category2, namely the “Software engineering” category.
2Categories give a structure to Wikipedia by grouping together
For both sources of data, the effort of the contributors and the out-put are evaluated along the evolution of such artefacts. The overall goal of this paper is to evaluate whether a common framework of the evolution of UGC can be formalized, and which of these re-sources could be reused when abandoned during their life-cycle.
This paper is articulated as follows: section 2 describes the em-pirical approach, the goal-question-metrics approach implemented, and the definitions used throughout the paper. Section 3 shows the results from both the samples of FLOSS projects and the Wikipe-dia pages, while section 4 provides a discussion of the findings. Section 7 finally concludes, and provides avenues of further work.
2.
EMPIRICAL APPROACH
This section is divided in 4 subsections: in 2.1, a list of defini-tions is given to clarify what are the key concepts and the termi-nology used throughout this study. In 2.2, a formal approach to the underlying empirical study is given through the Goal-Question-Metrics (GQM) approach. In 2.3 and 2.4, the operationalization of two of the attributes (effort, and productivity) is explained in de-tail for the analysis of the SourceForge and the Wikipedia samples. The toolchain and the relevant commands to download and retrieve such data are thoroughly described.
2.1
Definitions
The following are the definitions used throughout this study:
• Contributor: in any UGC, a contributor represents either
the original author of the artefact, or anyone else who pro-vides additions or amendments later in the life-cycle of the same artefact. In the specific case of OSS projects, develop-ers and bug-fixdevelop-ers represent the core contributors of a project (let aside users and bug reporters); in the case of Wikipedia, the editors of wiki pages are the named contributors.
• UGC item (or “item”): any online content that can be
cre-ated and modified freely by an online user. In the case of OSS, this could be represented by source files; in the case of Wikipedia, this could be represented by a wiki page.
• Created items: number of new items that have been created
during a certain period (daily, weekly, monthly, etc).
• Changed items: number of items that have been changed
once or more per period.
• Handled items: sum of the “newly created” and the “changed”
items per period.
2.2
Goal-Question-Metric Approach
This work uses the well known approach for empirical studies proposed in the Goal-Question-Metric (GQM) approach [2]. This approach establishes whether a goal has been reached by associat-ing that goal with several questions that explain it. For each of the questions, several metrics are identified in order to answered those questions.
Goal: the long term goal of this research is to produce a common
framework for the evolution of user-generated content, when reliant on the Open Source model, by identifying phases and transitions.
Questions: The following questions were addressed from the
above goal:
1. Does the effort measured in the production of Wikipedia con-tents follow a similar pattern to the OSS one?
2. Does the produced output of Wikipedia contents follow a similar pattern to the OSS outputs?
3. Is it possible to differentiate between models of evolution, based on the type of UGC?
4. Is the productivity of UGC generally increasing, decreasing or following other complex patterns?
Metrics: The following are the two types of metrics that have
been extracted in this study
• Input metrics: the effort of contributors was evaluated by
counting the number of unique (or distinct, in a SQL-like terminology) contributors during a specific interval of time. The chosen granularity of time was based on months: differ-ent approaches may be used, as on a weekly or on a daily basis, but it is believed that the month represented a larger grained unit of time to gather the number of active contribu-tors [3].
• Output metrics: the work produced was evaluated by
count-ing the sum of created and modified items durcount-ing the same interval of time. Each modification or creation affects at least one item, and it is recorded with a plain-text description (in OSS projects, by the relative versioning system; in Wikipe-dia, by the number of edits gathered during the evolution of a page, and collected by the Mediawiki and the statistics toolserver).
2.3
OSS data extraction
The following steps were performed to analyse a sample of OSS projects: below the steps to achieve each are described.
i selection of an appropriate OSS repository;
ii application of filters to reduce the population space;
iii sizing of the sample;
iv download of the relative version control systems, and
v evaluation of metrics of effort and productivity.
The Sourceforge repository was chosen as the largest and more representative OSS repository. In order to extract a sample from it, the flossmole.org database [15] was downloaded, containing the ba-sic information of all the Sourceforge projects3. From this database,
two filters were applied: one based on the status of the projects, and one relative to the specific topic (or application domain) that each project is developed for.
• Status: within Sourceforge, the status of each project is
cat-egorized as “Inactive” (3,720 projects in the studied dump), “Planning” (28,315), “Pre-Alpha” (22,003), “Alpha” (23,528), “Beta” (31,214), “Production/Stable” (25,877) and “Mature” (2,293). Only the projects classified in the ‘Production/Stable’ phase were considered, so to exclude the bias of inactive projects(they are deemed useless/irrelevant),to exclude ma-ture projects that don’t evolve anymore, or those at the very beginning of their life.
• Application Domain: within Sourceforge, the projects are
listed under 20 “categories” or “topics’: Communications and Multimedia, Database, Desktop Environment, Educa-tion, Formats and Protocols, Games/Entertainment, Internet,
3The latest available dump of such data, at the time of the extraction
Mobile, Office/Business, Other/Nonlisted Topic, Printing, Re-ligion and Philosophy, Scientific/Engineering, Security, So-cial Sciences, Software Development, System, Terminals and Text Editors. Each category is composed of one or more sub-categories, and each project can be classified in one or more categories, and zero or many subcategories. The Venn dia-gram, obtained using the R tool, shows that the categories with the largest number of common projects are “Internet” and “Software Development” (figure 2.3). Therefore, the “Production/Stable” projects, under the category “Internet” were considered for the sampling of OSS projects (and con-taining 5,103 projects).
2.3.1
Sampling + raw and intermediate data
For the calculation of the sample size, the following parameters were considered: (i) Confidence Level: 95%, (ii) Confidence Inter-val: 10%, (iii) Population Size: 5,103, and (iv) Percentage (worst case): 50%. With such parameters the sample size was requested to be 100 projects, and chosen through a random SQL select statement within the studied dump.An automatic procedure downloaded the CVS and SVN change logs, that were used to obtain the information about the evolution of a system. Only SVN and CVS projects were considered: projects managed with different version control systems (such as Git or Mercurial) were replaced by others random projects(actually the data extraction automatic procedures work only on SVN and CVS logs). Projects without an active version control system (around 50%) were also replaced.
From the history logs, and for each project, the following fields were extracted for each atomic change recorded in the change log:
• month of change
• year of change
• contributor
• change type (creation or change)
• module name (either function and file, or method and class)
• subsystem name (either containing directory or package)
Each change affects at least one module, and is recorded with a plain-text description. In some cases many changes affect the same module during the same period: these changes were counted only once for the same module [5].
Tables containing these fields were populated for all the projects: SQL queries extracted the distinct contributors per month (i.e., “man-month” [3]), and the monthly output. With these metrics, we were able to observe the evolution of both the contributors community working on the project and the output produced, and to evaluate the productivity of each month of the life-cycle.
The productivity was evaluated through the following formula:
P roductivity(i)=
Handled_items(i)
Contributors(i)
(1)
where(i)is the referred month.
2.4
Wikipedia data extraction
The same steps as above were performed to analyse the other UGC portal: (i) selection of an appropriate UGC portal; (ii) ap-plication of filters to reduce the population space; (iii) sizing of the sample; (iv) download of the data from the appropriate online database, and (v) evaluation of metrics of effort and productivity.
Wikipedia4 is certainly the most important and diffused online UGC: as of May 2011, the English Wiki accounts for some 3,6 million articles. In order to analyse the Wikipedia’s user content, the following Open Source tools were used:
• Mediawiki Special Export Interface: this interface5 allows
a researcher to extract an XML file containing all the revi-sions of a page (or a category of pages), for offline analysis. The website to visit in order to download the revisions of all the pages belonging to a category is as follows (replacing NAME_OF_CATEGORY with the appropriate category):
http://en.wikipedia.org/w/index.php? title=Special:Export&addcat&catname= \textbf{NAME_OF_CATEGORY}\&pages=XXXX
It was decided that only one category was to be studied in this work, therefore it was decided to study only the “Software Engineering” category6.
• Mediawiki Dumper: this tool is a Java program that
pro-duces a SQL dump from the previously downloaded XML dump7. Before importing it in an SQL database for further analysis, the table structure must be created using a wiki script8. The “revision” table contains all the revision histo-ries with timestamps and page references. The “page” table contains, among others, the titles and the IDs of each page. The “text” table, finally, contains the whole text revisions in BLOB. The dump downloaded in May 2011 of the cat-egory "Software_engineering" contains an overall of 7,600 revisions, and about 900 pages.
• Eclipse BIRT Framework: this Java tool was used to
auto-matically generate graphs from specific SQL queries. Wi-kipedia provides an instant visualization tool, provided for each page, the soxred93 toolserver9. It was noted that the latter does not provide some of the requested metrics, or that such metrics are not precise: therefore it was chosen to use the raw data from the Wikipedia database and custom tools.
3.
RESULTS
This section is articulated in two subsections: in 3.1 the results from the evolutionary analysis of a sample of active, stable projects from Sourceforge, implemented for the Internet category, while 3.2 presents the results of the analysis of the Wikipedia pages contained in the “Software engineering” category.
3.1
Evolution of OSS software
By applying the process described in 2.3, the location of the ver-sion control systems of all the projects was identified, and each repository was downloaded and its history studied separately. It should be noted that only 76 projects have a recorded history larger than 2 months, which made the regression analysis of the produc-tivity quite difficult. More in general: (i) 28,95% of the projects has
4
http://en.wikipedia.org/wiki/Main_Page
5http://www.mediawiki.org/wiki/Manual:
Parameters\_to\_Special:Export
6
http://en.wikipedia.org/wiki/Category: Software_engineering
7
http://svn.wikimedia.org/svnroot/mediawiki/ trunk/mwdumper/
8http://svn.wikimedia.org/viewvc/mediawiki/
trunk/phase3/maintenance/postgres/tables. sql?view=markup
9
Figure 1: Intersection of Application Domains in Sourceforge, “stable” & “active” status
a life-cycle duration shorter than 1 year; (ii) 22,37% shorter than 2 year; (iii) 31,58% shorter than 5 year; (iv) 17,11% longer than 5 year. Even when sampling only among the active projects, and by focusing on only one Sourceforge category, the general results found regarding the bias of Sourceforge still apply [9].
After extracting the raw data and filtering the relevant attributes mentioned above, the effort (in terms of distinct contributors per month), the number of UGC items, and the number of created and changed items was extracted. From these metrics, the productivity was evaluated as in equation 1 above.
3.1.1
2-Phase Patterns
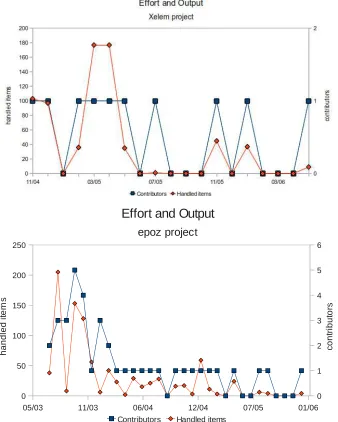
The main objective was to extract recurring patterns from the evolution of the effort and the output produced: indeed, some 60% of the analysed projects show a recurring 2-phase pattern, described as follows:
1. in the first phase, the activity appears to be sustained with a relevant contribution in terms of created and changed items per month. The amount of contributors can see the addition of new people interested in creating new, or changing exist-ing, items and content;
2. in the second phase, the activity of the contributors shows a considerable slow-down, sometimes dropping to a null activ-ity, in terms of new or modified items. The number of con-tributors often drops to one, at which time the overall activity becomes even more sparse.
Figure 3.1.1 shows such pattern for two of the analysed projects, epoz and xelem10. In both, it is clearly visible that the projects started to generate some interest from other contributors, which helped in the creation and modification of the underlying contents. After this initial phase, the original project owner remained alone to keep the project going, which decreased the overall activity, and its sustainability (the activity is completely null during some months). The second phase of decreasing activity can be considered in one of two ways:
• The collaboration between contributors has been interrupted
due to a loss of enthusiasm. The project represents a failure and is left to its own resources. This would identify an E-type
10
http://sourceforge.net/projects/xelem
program, as per the original S-P-E classification [20], which did not achieve its objectives of continual evolution. It could be interesting to try to understand which factors can cause the project failure, and which factors can help a project to raise new contributors: it has been argued that failing to con-tinually introduce new items for the contributors is a cause of such failure [5].
• The collaboration between contributors was successful and
all the goals prefixed when the project was planned have been reached: in this case the low activity could be due for exam-ple to occasional maintenance operations. This would iden-tify an S-type program, also from the classification in [20]: its requirements are exactly specified, and the project can be declared closed as long as all of such requirements are achieved. When contacting the main developer of the xelem project, he confirmed this point11.
It was found that some 60% of the analyzed projects show the 2-phases pattern just described. In this subset: (i) 36,36% of the projects has a history shorter than 1 year; (ii) 15,91% has a history shorter than 2 year; (iii) 36,36% has a history shorter than 5 year; (iv) 11,36% has a history longer than 5 year. Most importantly, 88,64% of such projects are managed by only one developer. This is an interesting observation that could explain the loss of interest on the project that wasn’t able to attract other developers in order to create a community able to continue the development.
3.1.2
3-Phase Patterns
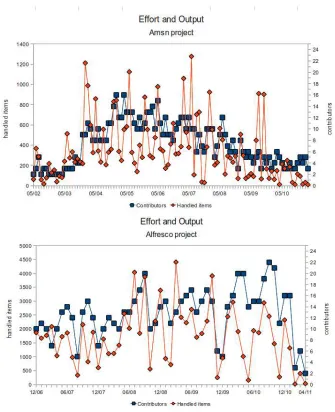
For other projects, the observed evolution featured a first phase of slow evolution, a larger phase of many contributors and high activity, and a later phase of burnout (see Figure 3 top), while other projects have only two phases (large growth and burnout phase) recorded in their versioning system (see Figure 3 bottom).
These findings shows some resemblance of the phases found in the SIR model [1], which is used as the underlying model for the modern mathematical epidemiology: according to such model, an epidemic occurs in three predictable phases, depicted in a logistic growth: (i) at first a slow growth phase, (ii) an explosive phase of growth and dissemination, and finally (iii) a burnout phase.
11In his words, “The project fulfilled more than its task at release
Figure 2: 2 Phases Pattern
Instead, the projects mentioned in section 3.1.1 above show quite clearly an initial phase, and a burnout phase, but somehow they fail to achieve the explosive phase of “growth and dissemination”. If new contributors are not added to OSS projects, it becomes less likely that such projects will produce an explosive phase of growth; if only one contributor remains in the development, it is more likely that the project will observe a burnout phase. Similarly in the SIR model, the vast spread of epidemics not always occur: most of such diseases can be controlled by human intervention, avoiding the ex-plosive phase of growth [25].
3.2
Evolution of Wikipedia pages
After examining the OSS projects, a sample of Wikipedia pages was examined with the same empirical approach: the amount of changes (“edits”) were counted, and the number of contributors noted in every month of activity of each page, and for the whole category. As detailed above, only the evolution of chosen
Wikipe-dia pages (belonging to the "Software Engineering" category) was analysed: in total, an additional 17 subcategories had to be followed (i.e., Computer programming, Programming language topics, Pro-gramming rules of thumb, Software architecture, Software design, Software development, Software engineering conferences, Software engineering disasters, Software engineering organizations, ware engineering publications, Software engineering stubs, Soft-ware engineering terminology, SoftSoft-ware engineers, SoftSoft-ware main-tenance, Software metrics, Software quality, Specification languages), for an overall amount of some 900 pages sharing the “Software en-gineering” category. The number of analysed edits to these pages is some 74,000.
The images in Figure 4 show the amount of edits for the whole category (left), and the number of distinct developers editing these pages (right)12. As observed also for the SIR logistic model, in
12The number of contributors was evaluated by SQL queries, since
Figure 3: 3 Phases Pattern
these graphs it’s possible to note the three phases: a "lazy-initialization", then a longer period of high activity in the middle, finally the curve tends to lower values. When the edits graph manifests the same pattern, it’s possible to deduce the following: "After a set-up time, followed by an high peak of activity, both the number of contribu-tors and number of edits, gradually diminish."
The previous sentence has three possible interpretations:
1. There are no more people able to improve the article’s quality and content. The free contributors are not enough.
2. There are people able to write something more, but they are not interested or they left the project.
3. There is nothing more to add, the page is complete: the qual-ity and the depth of that article (or category) has reached its objectives.
The first and the second interpretations have a negative effect, meaning effectively that the Wiki System is failing, due to the lack values of the monthly edits were also evaluated by SQL statements: when cross-checked with respect to the soxred93 values, they were also confirmed as inaccurate
of contributors. This has been reported as a viable threat to the continuous success of the online UGC portal [21, 19], which seems to be losing several thousands of contributors every year. The third interpretation, instead, shows a positive point of view; it means "reuse" of such material. There is nothing to write, because the page is complete, so it can be used for an high purpose: it can be part of an encyclopedia, because its quality is very high. It could be even used to replace some parts of existing books, in order to update such knowledge with shared information.
Figure 4: Wikipedia results – Number of edits per month (left) and number of distinct contributors per month (right)
4.1
Reuse of OSS content
Starting from the sample of projects described in 2.3, and given the visualizations given in Figure ??, three releases of the xelem project (i.e., r1.0, r2.0 and r3.0) were analysed further, by analysing the evolution of the source code, and how the components evolved in these three major releases. This project appears to be experienc-ing a burnout phase, which is visible in the scattered effort durexperienc-ing the latest months, and the few modifications and additions of items. Since it is a Java project, the packages, classes and methods com-posing the three versions were analysed. The coupling between method calls (i.e., the control coupling) was also evaluated through the Doxygen tool13: the method-to-method calls were firstly
con-verted into class-to-class calls (by extracting the classes that these methods belong to), and secondly into package-to-package calls.
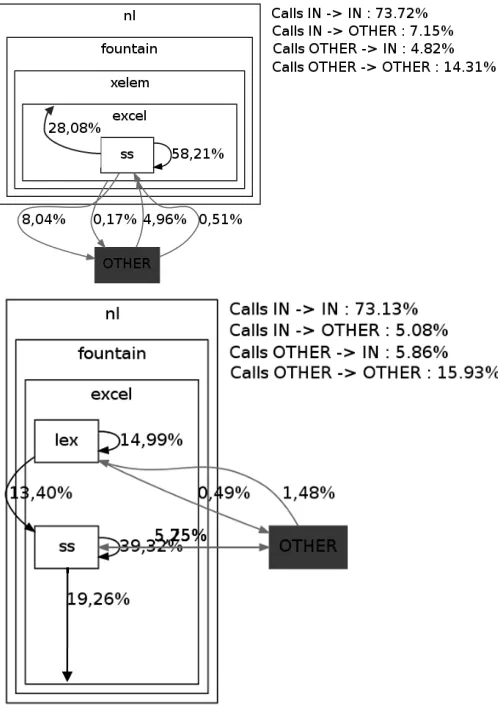
The results of such extraction show that r1.0, released in 2004-12-10, is composed of an overall 9 packages: the total number of calls performed by all classes in this release is 1,093. It is also visible that 2 of the packages (nl.fountain.xelem.excel.ss and nl.fountain.xelem.excel) alone produce more than 80% of the to-tal calls: the other packages perform only the 14% of the calls, so one can conclude that most of the logic for this specific project is contained within these two packages.
When analyzing the other two available releases of Xelem project (r2.0 and r3.0), despite the growth of the project in terms of num-ber of packages (14 in r3.0) and numnum-ber of total calls (1,806 in r3.0), the relevant packages which perform more than 80% of calls are still the same as before, plus another package which however is a sub-package of nl.fountain.xelem.excel. The core of the Xelem project has always remained stable during the evolution cycle of the entire project: this could be considered as signaling a quality archi-tecture. Figure 5 shows the two releases, and how the evolution in growth did not affect the overall composition of the architecture and its components14.
One of the main issues of component reuse then becomes how to “index” or “summarise” what each of these packages does, in order to they are good candidates for a future reuse. For example, a short description of those packages work could be the following:
• nl.fountain.xelem.excel: provides interfaces and classes that 13http://www.stack.nl/~dimitri/doxygen/
14
the "Calls IN -> IN" represents the percentage of calls which start from the core of the specific project and terminate in the core itself; the "Calls OTHER -> IN" represents the percentage of calls which start from the others packages of the specific project and terminate in that packages that are the core; and similarly the other notations
represent elements in SpreadsheetML (the XML schema for Microsoft Office Excel 2003);
• nl.fountain.xelem.excel.ss: provides classes that represent the
elements of a spreadsheet’s namespace;
• nl.fountain.xelem.excel.ss.lex: provides classes that enable
reading SpreadsheetML.
With these descriptions and packages available, a possible way to reuse this sub-architecture could be by wrapping these packages, which are known to be stable during their evolution, and by making an opportunistic reuse of a large amount of code, and avoiding to “reinvent the wheel”.
When analysing a project still under development (and that presents a different trend according to the productivity analysis), the find-ings are different: as seen above, the Alfresco15 project shows a constant activity, and a community of contributors behind its ef-fort. In order to analyze the architecture’s evolution of Alfresco project we considered 3 releases of this specific software:
Regarding this project, three releases were analysed: the r2.1 re-leased in 2007-07-10, the r3.2 rere-leased in 2009-10-09 and the r3.4 released in 2011-01-25. In release 2.1, 168 packages are respon-sible for 15342 calls: only 19 of these packages, though, are re-sponsible for more than the 80% of the total number of calls is 19. Differently from what has happened in Xelem, the Alfresco project increases the number of its packages, during its evolution, to more than 900, while the “relevant” ones (i.e., responsible for more than 80% of the calls) have grown with respect to the original 19 (now they are 76). This has an immediate effect to be a less "stable" architecture, and it would be more challenging to extract reusable resources without dealing with many unresolved calls.
4.2
Reuse of Wikipedia content
As seen for the OSS resources, it could be argued that any wiki page produces knowledge per se. It has been concluded above that majority of pages, within the “Software engineering” category, present a descending trend in the activity. One typical pattern that can be observed is depicted in Figure 6 (diamond trend), which de-picts the edits of the “View Model” page16. As visible, the number of edits starts as the typical growth phase, then very quickly de-scends to few edits per month, in a “burnout” phase. In a parallel
15http://sourceforge.net/projects/alfresco 16http://http://en.wikipedia.org/wiki/View_
Figure 5: Xelem Architecture Digraph – Releases 1.0 and 3.0
with the OSS development model, one would assume the “aban-donment or the “completion” of such project.
By cross-checking the “number of visits” on the same page, one interesting aspect emerges: this metric produces an inverse trend than the number of edits, low at the beginning and then increas-ing later, remainincreas-ing quasi-constant in the latest months (Figure 6, square trend). This can reflect the assumption that this page is com-plete, and it’s being visited regularly as a reference by students and researchers. Such status should trigger some sort of recogni-tion, and such pages could be promoted to the status of “stable”, or “third-party checked”, therefore properly reusable as references. A very similar attribute could be used in OSS projects, when consid-ering the number of downloads: as pointed out in Israeli et al [18], constant activity is not always related to users’ downloads and few OSS projects can sustain a constant number of downloads. When projects get abandoned or completed, an improved mechanism to increase their download rate would be to highlight few of their re-sources that could be reused in other projects.
5.
RELATED WORK
[image:8.595.326.546.58.195.2]The evolution of OSS has attracted attention by researchers in particular when trying to compare “open” and proprietary systems, in order to test, in an open development, the validity of the now widely accepted “laws” of software evolution [11]. As mentioned above, some studies have demonstrated that a number of flagship
Figure 6: Wikipedia edits and views – “View model” page
OSS projects achieve patterns of evolution that have not been ob-served in proprietary systems: among others, Godfrey et al. [12] demonstrated that the Linux kernel achieved a superlinear evolu-tion; Herraiz et al. [14] examined the growth of 13 OSS systems (mostly from the Debian/Linux distribution), also concluding that the predominant mode of growth was superlinear; similarly other studies, based on a selection of large OSS projects, claimed that some of such projects can practically achieve a linear or a superlin-ear growth [11, 28, 22].
On the other hand, further empirical studies on OSS projects have highlighted recurring issues and results that researchers face when mining large repositories of OSS projects, the most important and diffused one being SourceForge: it has been reported that most of the OSS projects are small, tend to involve very few developers, and they are mostly inactive, let alone being actively used by users after the download [4, 9, 10, 16, 26, 27].
One of the reasons for such diverse results is due to the type of analysed systems, and the selection process: when randomly sam-pling, or considering the overall set of projects of large OSS repos-itories, the findings tend to be uniform and confirmed. Conversely, when sampling a specific, representative sample of successful OSS projects, the findings tend to be more sparse and optimistic: this has been found when analysing specific, successful OSS projects, including packages in the Debian/Linux distribution, or some of the flagship OSS projects (Linux, KDE, Apache, Samba, etc.). This paper has tackled this second approach to sample OSS projects, in order not to highlight “exceptional” characteristics, but to propose a more general view of what is found in large OSS repositories, and whether “trash” or “treasure” could be identified from the reuse point of view.
be uniformed in a “lightweight” or a “heavyweght” model for peer production could produce the first differentiation between sustain-able and abandoned (or completed) content [13]: an “heavyweight” model infact produces stronger-ties between participants and better negotiation of purpose.
6.
THREATS TO VALIDITY
Like any other empirical study, the validity of ours is subject to several threats. In the following, threats to internal validity (whether confounding factors can influence the findings), external validity (whether results can be generalized), and construct validity (relationship between theory and observation) are illustrated.
6.1
Internal Validity
The following threats to internal validity have been detected:
• as a metric for the input, we used the number of distinct
con-tributors per month. This was done to compare the OSS data with what is available in the Wikipedia edits (also recorded monthly). This means that if a developer only makes a small change in one month, while another does the vast majority of the coding (or editing), we will be counting 2 contributors for that given month.
• as a metric for the output in WIkipedia, we used the total
number of edits to the pages composing a given category. We are aware that some of the edits are recorded as “minor” by the soxred93 toolserver: since we were not completely con-fident on the accuracy of the “number of edits” metric, let alone the “number of minor edits”, we preferred to avoid a cumulation of weakly defined metrics, and just use the “num-ber of edits” alone.
6.2
External Validity
Recognised threats to external validity are:
• the OSS results apply to a sample of projects from
Source-forge. Surely enough another, higher-profile repository (De-bian, KDE, Gnome, etc) will yeld different results, in terms of less “one-man bands”. The study nonetheless highlights that something precious is hidden in a large repository as Sourceforge, where a large percentage of projects simply do not evolve;
• the Wikipedia sample is also very small compared to the
population: instead of randomly extracting Wiki pages, we decided to analyse one full category. Obviously the results could change considerably by choosing another category. We are confident though that a random extraction of pages (not categories) from wikipedia could yield similar results to ours.
6.3
Construct Validity
Further threats to construct validity are:• we assumed that the categorization of “stable” and “active”
projects as recorded by Sourceforge is accurate. Since this is not a parameter that we could control, we had to accept it “as is” since all the hosted OSS projects are classified by that metric;
• we assumed that the data of the Wikipedia edits contained in
the soxred93 toolserver are appropriate. Since we saw dis-crepancies in the measurement data, the data on contributors was re-evaluated by using the dumps by the MediaWiki web-site
7.
CONCLUSIONS AND FUTURE WORK
This paper has argued that UGC as the Wikipedia content, or the OSS projects, share some commonalities in terms of their evolu-tionary patterns; in particular, it has argued that a predefined, lo-gistic model could be used to explain several of the similarities in “abandoned” or “completed” projects and Wikipedia pages.By making use of a random sample of OSS projects, and analysing the Wikipedia pages composing a pre-determined category (“Soft-ware engineering”), this paper provided two main contributions: first, it showed that large UGC content is modellable by a three-phase logistic model, typical of the mathematical epidemic mod-elling: at first an initial phase of slow growth, a longer phase of more sustained growth, and finally a phase of burnout. Smaller UGC content is instead modelled by a two-phase pattern, i.e., the explosive growth phase does not happen. The second contribu-tion showed that abandoned (or completed) UGC items represent a valuable resource for potential reuse: by investigating completed OSS projects, one can find valuable components ready to be reused; by investigating frequently visited Wikipedia pages, one can define third-party checked knowledge that does not need further amend-ments.
In terms of the first contribution, by examining the amount of ef-fort provided (e.g., number of contributors), and of output obtained (e.g., added and modified items) it emerged that 60% of a sample of OSS projects (from a specific Sourceforge category, and flagged as “active”) show a two-phase evolutionary pattern, somewhat fail-ing to achieve the phase of explosive growth. Larger OSS projects show instead a three-phase evolution, while others appear still to be in the second phase. Similarly, by analysing the pages compos-ing one of the Wikipedia categories, it was found somethcompos-ing sim-ilar: larger “projects” (as the Wikipedia categories) can display a three-phase pattern, while the majority of single pages of the sam-ple show a two-phase pattern, with an activity fastly desceding to zero.
In terms of the second contribution, it was found that, when OSS projects get abandoned or completed, some of their resources could be reused: in particular, analysing the architecture of one of the “completed” OSS projects, it was found that some components are more relevant and well-contained than others. These could be au-tomatically extracted for future reuse, after indexing them semanti-cally to provide a description of their capabilities. It was also found that the number of views of one of the analysed Wikipedia pages has a growing trend, albeit the changes follow a two-phase pattern, and descend quickly. This could signal the use of such pages as shared and common references, their high quality, and their poten-tial reusability in high profile publications.
The findings of this paper, if confirmed, have several open av-enues of development and research: first, other UGC sites could be added to this analysis, by parsing for instance the results of techno-rati17, that can browse for a large amount of user-generated media
(including weblogs). Second, the effects of the three phases should be clarified: are all UGC’s destined to end up in a burnout phase? What is the repercussion of such finding? Third, the potential of abandoned projects to be reused (fully or in part) as resources in other projects should be studied, by evaluating techniques to au-tomatically index and list resources which comply with the basic requirements of reuse.
8.
REFERENCES
[1] R. M. Anderson and R. M. May. Infectious Diseases of Humans Dynamics and Control. Oxford University Press,
17
1992.
[2] V. R. Basili. Software modeling and measurement: the Goal/Question/Metric paradigm. University of Maryland at College Park, College Park, MD, USA, 1992.
[3] F. P. Brooks, Jr. The mythical man-month (anniversary ed.). Addison-Wesley Longman Publishing Co., Inc., Boston, MA, USA, 1995.
[4] A. Capiluppi, P. Lago, and M. Morisio. Evidences in the evolution of OS projects through Changelog Analyses. In Proceedings of the 3nd Workshop on Open Source Software Engineering, Int. Conf. Software Engineering, 2003. [5] A. Capiluppi and M. Michlmayr. From the cathedral to the
bazaar: An empirical study of the lifecycle of volunteer community projects. In J. Feller, B. Fitzgerald, W. Scacchi, and A. Silitti, editors, Open Source Development, Adoption and Innovation, pages 31–44. International Federation for Information Processing, Springer, 2007.
[6] E. Capra, C. Francalanci, and F. Merlo. An empirical study on the relationship between software design quality, development effort and governance in open source projects. IEEE Trans. Softw. Eng., 34:765–782, November 2008. [7] M. Cha, H. Kwak, P. Rodriguez, Y.-Y. Ahn, and S. Moon. I
tube, you tube, everybody tubes: analyzing the world’s largest user generated content video system. In Proceedings of the 7th ACM SIGCOMM conference on Internet measurement, IMC ’07, pages 1–14, New York, NY, USA, 2007. ACM.
[8] C. DiBona, M. Stone, and D. Cooper. Open sources 2.0. O’Reilly, first edition, 2005.
[9] R. English and C. M. Schweik. Identifying Success and Tragedy of FLOSS Commons: A Preliminary Classification of Sourceforge.net Projects. Emerging Trends in FLOSS Research and Development, International Workshop on, 0:11, 2007.
[10] D. G. Feitelson, G. Z. Heller, and S. R. Schach. An
empirically-based criterion for determining the success of an open-source project. Software Engineering Conference, Australian, 0:363–368, 2006.
[11] J. Fernandez-Ramil, A. Lozano, M. Wermelinger, and A. Capiluppi. Empirical Studies of Open Source Evolution. In T. Mens and S. Demeyer, editors, Software Evolution: State-of-the-art and research advances, chapter 11, pages 263–288. Springer Verlag, 2008.
[12] M. W. Godfrey and Q. Tu. Evolution in Open Source Software: A Case Study. In Proceedings of the International Conference on Software Maintenance (ICSM’00), ICSM ’00, pages 131–, Washington, DC, USA, 2000. IEEE Computer Society.
[13] C. Haythornthwaite. Crowds and Communities: Light and Heavyweight Models of Peer Production. In System Sciences, 2009. 42nd Hawaii International Conference, pages 1–10, 2009.
[14] I. Herraiz, G. Robles, J. Gonzalez-Barahona, A. Capiluppi, and J. Ramil. Comparison between SLOCs and number of files as size metrics for software evolution analysis. In Software Maintenance and Reengineering, 2006. CSMR 2006. Proceedings of the 10th European Conference on, pages 8 pp. –213, march 2006.
[15] J. Howison, M. Conklin, and K. Crowston. Flossmole: A collaborative repository for floss research data and analyses. International Journal of Information Technology and Web Engineering, 1:17–26, 07/2006 2006.
[16] J. Howison and K. Crowston. The perils and pitfalls of mining SourceForge. In Mining Software Repositories, 26th International Conference on Software Engineering, Edinburgh, Scotland, 2004.
[17] ICWSM’2007 Boulder, Colorado, USA. On the Evolution of Wikipedia, 2007.
[18] A. Israeli and D. G. Feitelson. Success of open source projects: Patterns of downloads and releases with time. Software Science, Technology and Engineering, IEEE International Conference on, 0:87–94, 2007.
[19] S. T. K. Lam and J. Riedl. The past, present, and future of wikipedia. Computer, 44:87–90, March 2011.
[20] M. M. Lehman. Programs, life cycles, and laws of software evolution. Proc. IEEE, 68(9):1060–1076, September 1980. [21] F. Ortega. Wikipedia: A quantitative analysis. PhD thesis,
Universidad Rey Juan Carlos – Escuela Técnica Superior De Ingeniería De Telecomunicación, 2009.
[22] J. Paulson, G. Succi, and A. Eberlein. An empirical study of open-source and closed-source software products. Software Engineering, IEEE Transactions on, 30(4):246 – 256, april 2004.
[23] B. Suh, G. Convertino, E. H. Chi, and P. Pirolli. The singularity is not near: slowing growth of wikipedia. In WikiSym ’09: Proceedings of the 5th International Symposium on Wikis and Open Collaboration, pages 1–10, New York, NY, USA, 2009. ACM.
[24] J. Voss. Measuring wikipedia. In Proceedings of the 10th International Conference of the International Society for Scientometrics and Informetrics, Stockholm (Sweden), July 2005.
[25] D. J. Watts. Six Degrees: The Science of a Connected Age. W. W. Norton, New York, 2003.
[26] D. Weiss and B. E. X. Entry. A large crawl and quantitative analysis of open source projects hosted on sourceforge. In University of Technology, 2005.
[27] A. Wiggins, J. Howison, and K. Crowston. Heartbeat: Measuring Active User Base and Potential User Interest in FLOSS Projects. In C. Boldyreff, K. Crowston, B. Lundell, and A. I. Wasserman, editors, Open Source Ecosystems: Diverse Communities Interacting, 5th IFIP WG 2.13 International Conference on Open Source Systems, OSS 2009, Skövde, Sweden, June 3-6, 2009. Proceedings, volume 299 of IFIP, pages 94–104. Springer, 2009.
[28] G. Xie, J. Chen, and I. Neamtiu. Towards a better