www.impactjournals.com/oncotarget/ Oncotarget, Vol. 6, No. 27
Prognostic impact of c-Rel nuclear expression and REL
amplification and crosstalk between c-Rel and the p53 pathway
in diffuse large B-cell lymphoma
Ling Li1,2,*, Zijun Y. Xu-Monette2,*, Chi Young Ok2, Alexandar Tzankov3, Ganiraju
C. Manyam4, Ruifang Sun2, Carlo Visco5, Mingzhi Zhang1, Santiago Montes-Moreno6, Karen Dybkaer7, April Chiu8, Attilio Orazi9, Youli Zu10, Govind Bhagat11, Kristy L. Richards12, Eric D. Hsi13, William W.L. Choi14, J. Han van Krieken15, Jooryung Huh16, Maurilio Ponzoni17, Andrés J.M. Ferreri17, Michael B. Møller18, Jinfen Wang19, Ben M. Parsons20, Jane N. Winter21, Miguel A. Piris6, Lan V. Pham2, L. Jeffrey Medeiros2, Ken H. Young2,22
1Zhengzhou University, The First Affiliated University Hospital, Zhengzhou, China
2Department of Hematopathology, The University of Texas MD Anderson Cancer Center, Houston, TX, USA 3University Hospital, Basel, Switzerland
4 Department of Bioinformatics and Computational Biology, The University of Texas MD Anderson Cancer Center, Houston, TX, USA
5San Bortolo Hospital, Vicenza, Italy
6Hospital Universitario Marques de Valdecilla, Santander, Spain 7Aalborg Univwersity Hospital, Aalborg, Denmark
8Memorial Sloan-Kettering Cancer Center, New York, NY, USA 9Weill Medical College of Cornell University, New York, NY, USA 10The Methodist Hospital, Houston, TX, USA
11Columbia University Medical Center and New York Presbyterian Hospital, New York, NY, USA 12University of North Carolina School of Medicine, Chapel Hill, NC, USA
13Cleveland Clinic, Cleveland, OH, USA
14University of Hong Kong Li Ka Shing Faculty of Medicine, Hong Kong, China 15Radboud University Nijmegen Medical Centre, Nijmegen, Netherlands 16Asan Medical Center, Ulsan University College of Medicine, Seoul, Korea 17San Raffaele H. Scientific Institute, Milan, Italy
18Odense University Hospital, Odense, Denmark 19Shanxi Cancer Hospital, Shanxi, China
20Gundersen Medical Foundation, La Crosse, WI, USA
21Feinberg School of Medicine, Northwestern University, Chicago, IL, USA
22The University of Texas School of Medicine, Graduate School of Biomedical Sciences, Houston, Texas, USA *These authors have contributed equally to this work
Correspondence to:
Ling Li, e-mail: [email protected]
Ken H. Young, e-mail: [email protected]
Keywords: c-Rel, NF-kB, p53, DLBCL, gene expression profiling
Received: May 25, 2015 Accepted: June 16, 2015 Published: June 30, 2015
ABSTRACT
as surrogate of c-Rel activation in 460 patients with de novo DLBCL. Nuclear c-Rel
expression, observed in 137 (26.3%) DLBCL patients frequently associated with extranoal origin, did not show significantly prognostic impact in the overall- or germinal center B-like-DLBCL cohort, likely due to decreased pAKT and Myc levels,
up-regulation of FOXP3, FOXO3, MEG3 and other tumor suppressors coincided with c-Rel nuclear expression, as well as the complicated relationships between NF-κB members and their overlapping function. However, c-Rel nuclear expression correlated with significantly poorer survival in p63+ and BCL-2− activated
B-cell-like-DLBCL, and in DLBCL patients with TP53 mutations. Multivariate analysis indicated that after adjusting clinical parameters, c-Rel positivity was a significantly adverse prognostic factor in DLBCL patients with wild type TP53. Gene expression
profiling suggested dysregulations of cell cycle, metabolism, adhesion, and migration associated with c-Rel activation. In contrast, REL amplification did not correlate with c-Rel nuclear expression and patient survival, likely due to co-amplification of genes that negatively regulate NF-κB activation. These insights into the expression, prognostic impact, regulation and function of c-Rel as well as its crosstalk with the p53 pathway underscore the importance of c-Rel and have significant therapeutic
implications.
INTRODUCTION
Diffuse large B-cell lymphoma (DLBCL) is a heterogeneous aggressive non-Hodgkin lymphoma that
can be classified into germinal center B-like (GCB) or
activated B-cell-like (ABC) DLBCL. Aberrant activation
of nuclear factor-kappaB (NF-κB), either through the
“canonical” pathway activating p50/p65 and
p50/c-Rel dimers, or through the “non-canonical” pathway activating p52/RelB dimers, has been associated with tumor proliferation and survival in DLBCL, especially in the ABC subtype [1, 2]. The canonical and non-canonical
pathways are generally believed to be independent;
however, the non-canonical pathway may attenuate activities of the canonical pathways [3].
c-Rel encoded by the REL gene is a unique
NF-κB member, predominantly expressed in lymphoid and myeloid tissues, likely contributed by the unique regulators for c-Rel activation. NF-κB inhibitor IκBα preferentially inhibits p65/p50 dimers, whereas IκBε controls p65/c-Rel, and c-Rel activation also depends on the non-redundant regulator IκBβ [4–7], and the protease activities of MALT1 [8]. MALT1 inhibitors specifically
impair c-Rel nuclear localization and display selective activity against ABC-DLBCL exvivo [9]. In addition, novel IκB kinase (IKK)-dependent and proteasomal-independent pathway was found to degrade IκBα and activate p50/c-Rel in B-cells [10], triggered by stimuli different from the non-canonical NF-κB pathway. However, little is known about whether and how the upstream stimuli for NF-κB activation, e.g., signaling through B-cell receptors (BCR), T-cell receptors (TCR), tumor-necrosis factor (TNF) receptors, Toll-like receptors (TLR), and mitogen-activated protein kinases (MAPK) [11], differentially regulate c-Rel and other NF-κB subunits.
c-Rel has both nonredundant and overlapping functions compared with p65 and p50. c-Rel regulates cytokine production and plays an important role in
proliferation and inflammation mainly regulating development of T-cells [12–14]. c-Rel promotes cell
survival by transactivating antiapoptotic and cell cycle
genes, such as BCLXL/BCL2L1, BCL2A1, XIAP, cIAP,
and cyclins [4, 15, 16]. In addition, during GC reaction in B-cell development, c-Rel is required for B-cell activation before GC formation and maintenance of the GC reaction by regulating metabolism, fueling proliferation independent of Myc [17], and is crucial for the development of follicular helper T cells [7, 18]. c-Rel-knockout mice are viable but have deficiencies in immune responses [4, 19]. However, c-Rel, but not other NF-κB members, has a unique ability to transform
avian lymphoid cells in vitro [4], and is associated with
increased lymphoma risk in vivo [20].
c-Rel functions are also affected by the p53
pathway. In mouse models the requirement for NF-κB
signaling in tumor development depends on the p53
carcinoma cells [29]. In head and neck squamous cell carcinoma with MUT-p53, c-Rel overexpression activated by TNF-α modulates ΔNp63α/ Tap73 interactions and their function, promoting proliferation and cell survival [30].
c-Rel has been proposed to be an attractive
therapeutic target, whose inhibition can suppress tumor growth without causing systemic tissue toxicity [19].
A study group showed that c-Rel inhibition is a novel
strategy to ameliorate GVHD reduced alloactivation without compromising T-cell mediated immune responses [31], and a small molecule c-Rel inhibitor had anti-proliferative effect in both GCB- and ABC-DLBCL cell lines [32]. Since REL gene was found
frequently amplified in DLBCL (~15%), REL activation
may play a role in lymphomagenesis, which however, was not supported by immunofluorescence analysis [33]. One study of 68 de novo DLBCL cases found that 15 GCB-DLBCL cases positive for c-Rel nuclear expression by
immunohistochemistry had worse survival compared to 9
GCB-DLBCL cases negative for c-Rel nuclear expression
(P = 0.045) [34]. In contrast, another study using a > 30% cutoff for c-Rel nuclear staining showed that 57 c-Rel+
DLBCL patients had significantly better overall survival
than 31 c-Rel− DLBCL patients [35]. Large scale studies
of REL amplification and c-Rel nuclear expression, and the prognostic impact of concurrent dysregulation of NF-κB
and TP53 [36] in DLBCL are lacking. In this study, we aimed to evaluate the clinical significance of c-Rel nuclear expression and REL amplification in DLBCL patients, to gain insight into the underlying biology, c-Rel function, activation mechanisms, and relationship with other NF-κB subunits.
RESULTS
c-Rel nuclear expression and correlation with nuclear expression of other NF-κB subunits
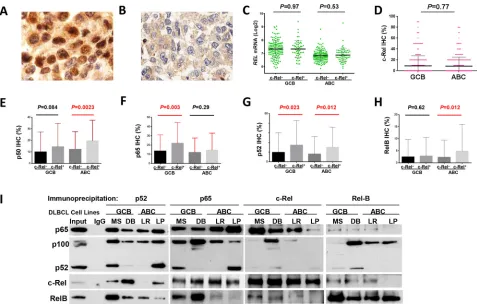
Immunohistochemistry was used to analyze the nuclear expression of c-Rel, as the surrogate marker for c-Rel activation [34] (Fig. 1A). A cutoff of ≥5% of
tumor cells with positive c-Rel staining nuclei was used to
identify positive c-Rel nuclear expression (c-Rel+). Using
this cutoff, 137 patients (26.3%) of the 460 successfully
stained cases had c-Rel+ DLBCL, with different expression
levels (5–90% of the tumor cells with c-Rel+ nuclei),
whereas majority (73.7%) of the cases were negative for c-Rel nuclear expression with or without cytoplasmic staining (Fig. 1B, Supplementary Fig. S1A). The mean expression level of nuclear c-Rel was significantly
lower than those of nuclear p65 and p50 in our cohort
(Supplementary Fig. S1B).
Nuclear c-Rel positivity did not correlate with
REL mRNA levels by Spearman rank correlation
(r = 0.004, P = 0.94), either in GCB- or
ABC-DLBCL (Fig. 1C). Consistent with a previous study
[35], GCB- and ABC-DLBCL had similar level of nuclear c-Rel protein expression (Fig. 1D). However, REL mRNA was significantly higher in the GCB subtype
(P < 0.0001), even after exclusion of cases with REL amplification or potential gains due to polysomies (Supplementary Fig. S1C).
Nuclear expression levels of c-Rel correlated positively with expression of other NF-κB subunits (significant for p52 and RelB by Spearman rank
correla-tion): p50 (r = 0.12, P = 0.12), p52 (r = 0.26, P = 0.724E-8),
p65 (r = 0.085, P = 0.073), and RelB (r = 0.12, P = 0.013). c-Rel+ correlated with significantly higher
levels of nuclear p65 and p52 in GCB-DLBCL, and p50, p52 and RelB in ABC-DLBCL (Fig. 1E-H). At the mRNA level, c-Rel+ correlated with upregulation of
NFKB1 and RELA (but not NFKB2 or RELB) in
ABC-DLBCL (Supplementary Fig. S1D-E). It has been known that c-Rel predominately forms dimers with p50 [1]. Our coimmunoprecipitation analysis using nuclear extracts purified from representative human derived GCB- and ABC-DLBCL cell lines (MS, DB, LR, LP)
however showed that c-Rel predominantly binds to p65 in
all cell lines (more intense in GCB than ABC cell lines); and that in some cell lines, p52 and RelB also formed dimers with c-Rel but to a lesser extent (Fig. 1I).
Prognostic impact of c-Rel nuclear expression
Clinicopathologic features
The clinicopathologic features of the study cohort are shown in Table 1. Interestingly, the c-Rel+ DLBCL
group had a higher proportion of patients with extranodal
disease (P = 0.0033), and had no association with other clinical parameters. Pathologically, the c-Rel+ compared
to the c-Rel− DLBCL group less frequently had Myc or
pAKT overexpression, whereas more frequently expressed nuclear p50, p52 and RelB (Table 1).
Moreover, dividing into GCB and ABC subtypes,
c-Rel+ GCB-DLBCL was associated with female sex,
low ECOG performance status score, and less MYC
translocations compared with c-Rel− GCB-DLBCL,
whereas in the ABC subtype, c-Rel+ ABC-DLBCL was
associated with extranodal disease (Table 1).
Univariate survival analysis in various DLBCL molecular subsets
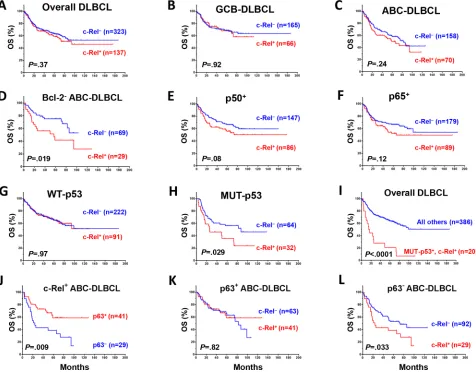
c-Rel nuclear expression did not correlate with patient survival in the overall- or GCB-DLBCL, whereas
c-Rel+ ABC-DLBCL tended to have a poorer survival
(Fig. 2A-2C). However, in DLBCL especially in ABC-DLBCL with low Bcl-2 (<70%), c-Rel+ correlated
examined the prognostic impact of c-Rel+ within the
following DLBCL subsets: p50−, p65−, p52−, RelB−, p50+,
p65+, p52+ and RelB+. c-Rel+ DLBCL showed trends
toward poorer survival only within the p50+ and p65+
subsets but not in other subsets (Fig. 2E-2F).
c-Rel nuclear expression did not correlate with survival in DLBCL patients with WT-p53 (however,
the c-Rel+ compared with the c-Rel− group had a small
proportion of patients with stage III/IV disease, Table 2). In contrast, among DLBCL patients with MUT-p53,
c-Rel+ correlated with significantly worse survival
(Fig. 2G-2H). The prognostic impact of c-Rel positivity
in the p65−, p65+, p50− and p50+ subsets with WT-p53 or
MUT-p53 was shown in Supplementary Figure S2A-2H. Among all the DLBCL patients, c-Rel nuclear expression
concurrent with TP53 mutations significantly predicted poorer survival (Fig. 2I). Moreover, p63 appears to be another tumor suppressor beside WT-p53 in suppressing the adverse impact of c-Rel activation, suggested by the correlation of p63 expression with better survival
in c-Rel+ ABC-DLBCL (Fig. 2J), and a similar trend in
GCB-DLBCL patients (P = 0.18). However, the favorable
correlation of p63 expression in c-Rel+ ABC-DLBCL
was abrogated by TP53 mutations (Supplementary Fig. S2K). Conversely, c-Rel conferred significantly
poorer survival in p63− but not in p63+ ABC-DLBCL
(Fig. 2K-L). In patients with p63+ ABC-DLBCL, c-Rel
conferred significantly poorer survival when concurrent
with TP53 mutations (Supplementary Fig. S2K).
Multivariate survival analysis in overall-, GCB- and ABC-DLBCL and in the WT-/MUT-p53 subsets
Multivariate survival analysis adjusting clinical
parameters only (IPI alone or using individual five IPI components, sex, B-symptoms, and tumor size) indicated
that c-Rel+ was not an independent prognostic factor.
However, when the potentially compounding biomarkers
(Myc+, Bcl-2+, and TP53 mutations, Table 1) were also
included in the multivariate analysis, c-Rel+ showed
significant prognostic value for poorer overall survival in
the whole and ABC-DLBCL cohorts. c-Rel+ also predicted
poorer progression-free survival in ABC-DLBCL with a borderline P value (Table 3). c-Rel+ did not predict
survival in GCB-DLBCL.
Figure 1: Nuclear expression of c-Rel and other NF-κB subunits. A-B. Representative immunohistochemical staining for
positive and negative nuclear c-Rel expression. C. Nuclear c-Rel positivity did not correlate with REL mRNA levels in GCB- and
ABC-DLBCL. D. Expression levels of nuclear c-Rel did not show significant difference between GCB- and ABC-DLBCL. E-H. Association
[image:4.612.67.544.46.354.2]Table 1: Clinicopathologic characteristics of 460
de novo DLBCL patients treated with R-CHOP
DLBCL GCB-DLBCL ABC-DLBCL
c-Rel+ c-Rel− c-Rel+ c-Rel− c-Rel+ c-Rel−
Variables N (%) N (%) P N (%) N (%) P N (%) N (%) P
Patients 137 (100) 323 (100) 66 (100) 165 (100) 70 (100) 158 (100) .68
Gender
Male 78 (57) 192 (59) .61 31 (47) 104 (63) .025 46 (66) 88 (56) .16
Female 59 (43) 131 (41) 35 (53) 61 (37) 24 (34) 70 (44) Age (yr)
<60 52 (38) 140 (43) .30 29 (44) 86 (52) .31 22 (31) 54 (34) .76
≥60 85 (62) 183 (57) 37 (56) 79 (48) 48 (69) 104 (66)
Stage
I-II 65 (50) 143 (46) .39 36 (57) 84 (53) .56 28 (42) 59 (38) .54
III-IV 65 (50) 171 (54) 27 (43) 75 (47) 38 (58) 96 (62)
B-symptoms
No 88 (71) 196 (63) .099 46 (79) 108 (68) .09 42 (65) 88 (58) .33
Yes 36 (29) 117 (37) 12 (21) 52 (32) 23 (35) 65 (42) LDH
Normal 46 (40) 113 (37) .56 24 (44) 57 (37) .37 22 (37) 56 (37) .98
Elevated 69 (60) 193 (63) 31 (56) 98 (63) 37 (63) 95 (63)
# of extranodal sites
0–1 103 (80) 235 (75) .31 49 (80) 121 (77) .55 54 (81) 114 (74) .29
≥2 26 (20) 77 (25) 12 (20) 37 (23) 13 (19) 40 (26) Performance status
0–1 95 (86) 247 (83) .47 48 (94) 125 (83) .055 46 (78) 122 (82) .52
≥2 16 (14) 52 (17) 3 (6) 25 (17) 13 (22) 27 (18)
Size of largest tumor
<5cm 47 (53) 149 (58) .38 22 (51) 78 (61) .24 25 (54) 71 (55) .94
≥5cm 42 (47) 107 (42) 21 (49) 49 (39) 21 (46) 58 (45)
IPI risk group
0–2 83 (65) 189 (60) .32 46 (75) 104 (65) .14 36 (54) 85 (54) .99
3–5 45 (35) 127 (40) 15 (25) 56 (35) 30 (46) 71 (46)
Therapy response
CR 103 (75) 247 (77) .77 51 (77) 121 (73) .54 51 (73) 126 (80) .25
PR 17 42 7 20 10 22
SD 6 13 4 8 2 5
PD 11 21 4 16 7 5
Primary origin
Nodal 70 (53) 222 (69) .0015 36 (57) 113 (69) .095 34 (51) 109 (69) .0077
Extranodal 61 (47) 99 (31) 27 (43) 51 (31) 33 (49) 48 (31)
Interestingly, in the WT-p53 subset, multivariate
survival analysis adjusting clinical parameters indicated that c-Rel+ was an independent adverse prognostic factor
(Table 3). Dividing into GCB and ABC subcohorts, the P values for the prognostic significance of c-Rel positivity remained significant for OS in both GCB- and ABC-DLBCL
with WT-p53 after adjusting all the clinical parameters
(P = 0.025 and P = 0.019 respectively), and for PFS in ABC-DLBCL with WT-p53 (P = 0.04). In the MUT-p53 subset, on the contrary, multivariate survival analysis adjusting clinical
parameters suggested that the predictive value of c-Rel+ for
poorer survival was not significant.
DLBCL GCB-DLBCL ABC-DLBCL
c-Rel+ c-Rel− c-Rel+ c-Rel− c-Rel+ c-Rel−
Variables N (%) N (%) P N (%) N (%) P N (%) N (%) P
Ki-67
<70% 49 (36) 113 (35) 1.0 27 (41) 64 (39) .88 22 (31) 49 (31) 1.0
≥70% 88 (64) 207 (65) 39 (59) 98 (61) 48 (69) 109 (69)
TP53mutation
WT TP53 91 (74) 222 (78) .45 42 (71) 107 (72) 1.0 49 (77) 115 (84) .24
MUT TP53 32 (26) 64 (22) 17 (29) 42 (28) 15 (23) 22 (16)
MYCtranslocation
− 93 (91) 180 (86) .27 44 (94) 77 (78) .0019 49 (89) 103 (94) .36 + 9 (9) 29 (14) 3 (6) 22 (22) 6 (11) 7 (6)
BCL2translocation
− 103 (81) 208 (82) 1.0 43 (69) 82 (66) .63 60 (92) 126 (97) .16
+ 24 (19) 47 (18) 19 (31) 43 (34) 5 (8) 4 (3)
BCL6translocation
− 75 (70) 144 (65) .37 43 (83) 82 (72) .14 31 (57) 62 (58) .95
+ 32 (30) 77 (35) 9 (17) 32 (28) 23 (43) 45 (42) Nuclear p50
− 50 (37) 168 (53) .0014 32 (49) 102 (62) .076 18 (26) 66 (44) .016
+ 86 (63) 147 (47) 34 (51) 62 (38) 51 (74) 85 (56)
Nuclear p52
− 77(57) 231 (77) <.0001 38(59) 115 (76) .022 39(56) 116 (79) .0007
+ 58 (43) 68 (23) 26 (41) 37 (24) 31 (44) 31 (21)
Nuclear p65
− 48(35) 135 (43) .12 21 (32) 65 (41) .23 27 (39) 70 (45) .39
+ 89 (65) 179 (57) 45 (68) 93 (59) 43 (61) 86 (55)
Nuclear RelB
− 109 (81) 266 (88) .056 54 (83) 139 (89) .28 54 (78) 127 (87) .11
+ 26 (19) 37 (12) 11 (17) 18 (11) 15 (22) 19 (13)
Abbreviations: DLBCL, diffuse large B-cell lymphoma; GCB, germinal center B-cell like; ABC, activated B-cell like; LDH, lactate dehydrogenase; IPI, international prognostic index; CR, complete remission; PR, partial response; SD, stable disease; PD, progressive
Potential molecular mechanisms underlying the prognostic impact of c-Rel positivity
A multitude of correlation and GEP analysis were
performed to understand the prognostic effect of c-Rel
nuclear expression observed in our cohorts.
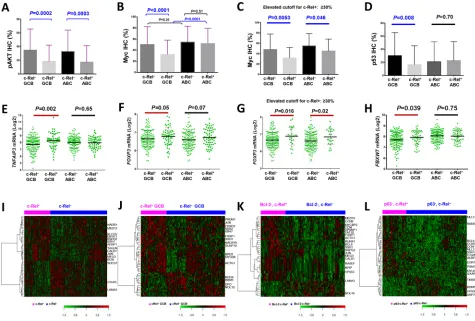
Decreased AKT, Myc, and p53 expression in c-Rel+ patients
Contrary to expectation at the protein level, there were inverse correlations between c-Rel and pAKT (r = −0.22, P = 0.0008; Fig. 3A, Supplementary Fig. S1F) in DLBCL, between c-Rel and
Myc (r = −0.20, P = 2.92E-5), and between c-Rel and p53 (WT or MUT) (r = −0.20, P = 0.005) in GCB subtype by Spearman rank correlation (Fig. 3B, 3D; Supplementary
Fig. S1G-S1H). Higher c-Rel expression levels (≥30%) coincided with decreased Myc in both GCB- and ABC-DLBCL (Fig. 3C). These correlations may not have resulted from transcriptional regulations by c-Rel,
since c-Rel positivity did not correlate with AKT1, MYC (Supplementary Fig. S1I-1J) or TP53 (P = 0.34 in GCB-DLBCL, and P = 0.088 for TP53 upregulation
in ABC-DLBCL) mRNA expression significantly, and that in GCB-DLBCL cases without MYC translocations,
c-Rel+ still correlated with decreased Myc levels in
GCB-DLBCL.
To understand the mechanisms underlying these inverse correlations, we compared the mRNA expression
levels of genes known for c-Rel activation in c-Rel+
[image:7.612.69.545.51.424.2]and c-Rel− DLBCL. We found that genes involved
Figure 2: Prognostic significance of c-Rel nuclear expression in various DLBCL subsets. A–B. In the overall- and GCB-DLBCL, c-Rel positivity did not correlate with patient survival. C. In ABC-DLBCL, c-Rel+ as a univariate did not correlate significantly
with patient survival although a trend toward poorer survival was suggested. D. In Bcl-2− (<70%) ABC-DLBCL, c-Rel+ correlated with significantly poorer patient survival. E–F. c-Rel+ concurrent with p50 or p65 expression correlated with poorer patient survival with
marginal P values. G–I. In DLBCL with MUT-p53 but not WT-p53, c-Rel+ correlated with significantly poorer patient survival. J. In ABC-DLBCL with c-Rel nuclear expression, p63 expression correlated with significantly better patient survival. K–L. Only in p63− but not p63+ ABC-DLBCL subcohort, c-Rel positivity correlated with significantly poorer patient survival. Abbreviations: OS, overall survival; PFS,
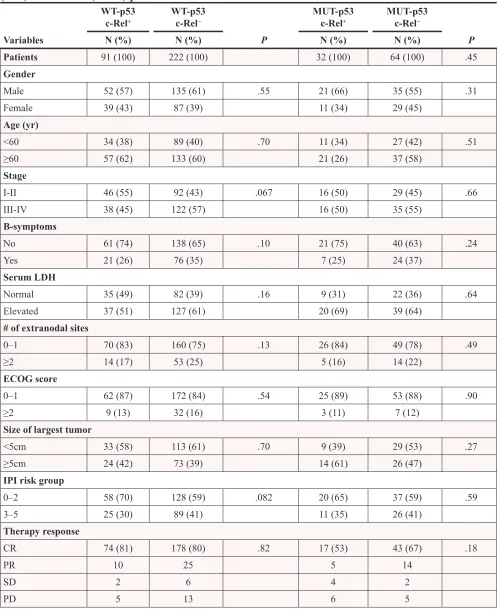
Table 2: Clinicopathologic characteristics of c-Rel
+versus c-Rel
−DLBCL patients with wild type
(WT) or mutated (MUT) p53
WT-p53
c-Rel+ WT-p53c-Rel− MUT-p53c-Rel+ MUT-p53c-Rel−
Variables N (%) N (%) P N (%) N (%) P
Patients 91 (100) 222 (100) 32 (100) 64 (100) .45
Gender
Male 52 (57) 135 (61) .55 21 (66) 35 (55) .31
Female 39 (43) 87 (39) 11 (34) 29 (45) Age (yr)
<60 34 (38) 89 (40) .70 11 (34) 27 (42) .51
≥60 57 (62) 133 (60) 21 (26) 37 (58)
Stage
I-II 46 (55) 92 (43) .067 16 (50) 29 (45) .66
III-IV 38 (45) 122 (57) 16 (50) 35 (55)
B-symptoms
No 61 (74) 138 (65) .10 21 (75) 40 (63) .24
Yes 21 (26) 76 (35) 7 (25) 24 (37) Serum LDH
Normal 35 (49) 82 (39) .16 9 (31) 22 (36) .64
Elevated 37 (51) 127 (61) 20 (69) 39 (64)
# of extranodal sites
0–1 70 (83) 160 (75) .13 26 (84) 49 (78) .49
≥2 14 (17) 53 (25) 5 (16) 14 (22)
ECOG score
0–1 62 (87) 172 (84) .54 25 (89) 53 (88) .90
≥2 9 (13) 32 (16) 3 (11) 7 (12) Size of largest tumor
<5cm 33 (58) 113 (61) .70 9 (39) 29 (53) .27
≥5cm 24 (42) 73 (39) 14 (61) 26 (47)
IPI risk group
0–2 58 (70) 128 (59) .082 20 (65) 37 (59) .59
3–5 25 (30) 89 (41) 11 (35) 26 (41) Therapy response
CR 74 (81) 178 (80) .82 17 (53) 43 (67) .18
PR 10 25 5 14
SD 2 6 4 2
PD 5 13 6 5
in BCR signaling, including CD79A, CD19, LYN, SYK, CARD11, MALT1, BLNK, BTK, and ZAP70 [2],
and MAP3K7/TAK1 [7], were significantly upregulated in
c-Rel+ compared with c-Rel− GCB-DLBCL. These
genes did not show significantly differential expression
[image:9.612.58.557.50.457.2]correlating to c-Rel+ in ABC-DLBCL (Supplementary
Fig. S3A-S3J). TNF, MAPK and TLR signaling which are also known as NF-κB activation mechanisms [3, 11], might not contribute to c-Rel activation significantly in our DLBCL cohort, suggested by non-significant
correlations between c-Rel positivity and gene
expression of CD40 (GCB, P = 0.23; ABC, P = 0.70), MAP3K14/NIK (GCB, P = 0.39; ABC, P = 0.29), BAFF (GCB, P = 0.38; ABC, P = 0.73), TNF (GCB, P = 0.51;
ABC, P = 0.61), TNFRSF11 (GCB, P = 0.75; ABC, P = 0.83), TNFSF11 (GCB, P = 0.74; ABC, P = 0.84), TNFRSF8 (GCB, P = 0.51; ABC, P = 0.22), TNFSF8 (GCB, P = 0.69; ABC, P = 0.72), TRAIL (GCB, P = 0.58;
ABC, P = 0.17), TRAF1/2/5/6 (GCB, P = 0.10, 0.89. 0.48 and 0.43 respectively; ABC, P = 0.37, 0.66, 0.35 and 0.83 respectively), TANK (GCB, P = 0.37; ABC, P = 0.44), MAP3K8 (GCB, P = 0.12; ABC, P = 0.51), MAP3K3 (GCB, P = 0.89; ABC, P = 0.68), TLR4 (GCB, P = 0.53; ABC, P = 0.06 for downregulation) and etc.
However, TNFRSF13C (encoding BAFFR) and TLR2 were significantly upregulated in GCB-DLBCL (P = 0.017
and P = 0.018 respectively). Other TLRs (TLR1, 3, 5–10) did not show significantly differential expression between
the c-Rel+ and c-Rel− groups.
On the other hand, A20/TNFAIP3 and TNIP1 which terminate NF-κB signaling [37] were also significantly upregulated in c-Rel+ GCB-DLBCL (Fig. 3E,
Supplementary Fig. S3K). Analyzing expression of NF-κB regulators IKK and INF-κB genes showed that IKK2/ IKBKB (but not IKK1) was upregulated in c-Rel+
GCB-DLBCL (marginal P value; Supplementary Fig. S3L), WT-p53
c-Rel+ WT-p53c-Rel− MUT-p53c-Rel+ MUT-p53c-Rel−
Variables N (%) N (%) P N (%) N (%) P
Ki-67
<70% 39 (43) 77 (35) .20 6 (19) 19 (30) .33
≥70% 52 (57) 143 (65) 26 (81) 44 (70)
Cell-of-origin
ABC 49 (54) 115 (52) .80 15 (47) 22 (34) .27
GCB 42 (46) 107 (48) 17 (53) 42 (66)
Nuclear p50
− 31 (34) 109 (50) .012 13 (41) 38 (61) .08
+ 59 (66) 108 (50) 19 (59) 24 (39) Nuclear p52
− 53 (59) 157 (76) .0053 16 (50) 49 (83) .0014
+ 37 (41) 50 (24) 16 (50) 10 (17)
Nuclear p65
− 37 (41) 101 (47) .38 10 (31) 20 (32) 1.0
+ 54 (59) 115 (53) 22 (69) 42 (68)
Nuclear RelB
− 73 (81) 179 (86) .30 24 (77) 55 (93) .043
+ 17 (19) 29 (14) 7 (23) 4 (7)
MYCtranslocation
− 69 (93) 130 (87) .18 19 (91) 30 (83) .70
+ 5 (7) 20 (13) 2 (9) 6 (17)
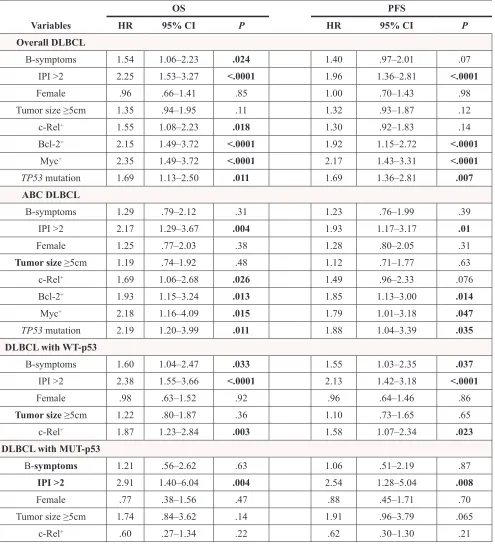
Table 3: Multivariate survival analysis of clinicopathologic parameters in DLBCLs treated with
R-CHOP
OS PFS
Variables HR 95% CI P HR 95% CI P
Overall DLBCL
B-symptoms 1.54 1.06–2.23 .024 1.40 .97–2.01 .07
IPI >2 2.25 1.53–3.27 <.0001 1.96 1.36–2.81 <.0001
Female .96 .66–1.41 .85 1.00 .70–1.43 .98
Tumor size ≥5cm 1.35 .94–1.95 .11 1.32 .93–1.87 .12
c-Rel+ 1.55 1.08–2.23 .018 1.30 .92–1.83 .14
Bcl-2+ 2.15 1.49–3.72 <.0001 1.92 1.15–2.72 <.0001
Myc+ 2.35 1.49–3.72 <.0001 2.17 1.43–3.31 <.0001
TP53 mutation 1.69 1.13–2.50 .011 1.69 1.36–2.81 .007 ABC DLBCL
B-symptoms 1.29 .79–2.12 .31 1.23 .76–1.99 .39
IPI >2 2.17 1.29–3.67 .004 1.93 1.17–3.17 .01
Female 1.25 .77–2.03 .38 1.28 .80–2.05 .31
Tumor size ≥5cm 1.19 .74–1.92 .48 1.12 .71–1.77 .63
c-Rel+ 1.69 1.06–2.68 .026 1.49 .96–2.33 .076
Bcl-2+ 1.93 1.15–3.24 .013 1.85 1.13–3.00 .014
Myc+ 2.18 1.16–4.09 .015 1.79 1.01–3.18 .047
TP53 mutation 2.19 1.20–3.99 .011 1.88 1.04–3.39 .035 DLBCL with WT-p53
B-symptoms 1.60 1.04–2.47 .033 1.55 1.03–2.35 .037
IPI >2 2.38 1.55–3.66 <.0001 2.13 1.42–3.18 <.0001
Female .98 .63–1.52 .92 .96 .64–1.46 .86
Tumor size ≥5cm 1.22 .80–1.87 .36 1.10 .73–1.65 .65
c-Rel+ 1.87 1.23–2.84 .003 1.58 1.07–2.34 .023 DLBCL with MUT-p53
B-symptoms 1.21 .56–2.62 .63 1.06 .51–2.19 .87
IPI >2 2.91 1.40–6.04 .004 2.54 1.28–5.04 .008
Female .77 .38–1.56 .47 .88 .45–1.71 .70
Tumor size ≥5cm 1.74 .84–3.62 .14 1.91 .96–3.79 .065
c-Rel+ .60 .27–1.34 .22 .62 .30–1.30 .21
Abbreviations:OS, overall survival; PFS, progression-free survival; HR, hazard ratio; CI, confidence interval; IPI, international prog
-nostic index. Cutoffs for c-Rel+, Bcl-2+, and Myc+: 5% and 70% respectively.
suggesting that activation of c-Rel was mediated through
the canonical pathway [2]. Genes encoding IκBα/β/ε (which sequester NF-κB in the cytoplasm) and IκB-zeta (which inhibits NF-κB transcription activity) were significantly upregulated in either GCB- or
ABC-DLBCL (Supplementary Fig. S3M-P), resembling p65 function [38].
Upregulation of TNFAIP3/A20 and TNIP1 (which
inhibit MALT1, IKK3 and TRAF6 [37]) in c-Rel+
pAKT and Myc levels coincided with c-Rel positivity
(Fig. 3A-3C) and the lack of c-Rel prognostic impact
[39, 40]. Upregulation of IKK2 and IκBs in c-Rel+
GCB-DLBCL may contribute to the decreased p53 levels in
GCB-DLBCL (Fig. 3D) [41]. In addition, decrease of
Myc may also result from MYC repression by FOXP3 [42]
and posttranslational regulation of Myc stability by the
ubiquitin-proteasome system. This was suggested by the
upregulation of FOXP3 (Fig. 3F-3G) in c-Rel+ DLBCL
which was opposite to the decrease of Myc in c-Rel+
DLBCL (≥5% and 30% cutoff respectively) (Fig. 3B-3C), and upregulation of FBXW7 (Fig. 3H), PIN1
(P < 0.0001), and PPP2R2A (P = 0.043) (which facilitate Myc degradation [43]) in c-Rel+ GCB-DLBCL.
Expression of c-Rel target genes
c-Rel is known to transcriptionally regulate genes
involved in inflammation, immune cell development and cell survival [4, 7]. Gene expression analysis between
c-Rel+ and c-Rel− DLBCL showed up- or downregulation
of FOXP3 (Fig. 3F-3G), IL1B, IL3, IL6, IL10RA, IL12B,
IL12RB1, IL17A, STAT3, JAK1/3, RUNX1/3, CXCR4, PRDM1, TP63, and CDKN1A (border-line P value)
(Supplementary Fig. S4B-O) in c-Rel+ versus c-Rel−
DLBCL, either in the GCB or ABC subtype. c-Rel did not
appear to correlate with transcription of apoptotic genes
significantly (data not shown) except antiapoptotic CFLAR (upregulated in GCB-DLBCL, P = 0.043, Supplementary Fig. S4P). Gene expression of antiapoptotic BCL2L1
(P = 0.13), MCL1 (P = 0.10), and TRAF1 (P = 0.10) also tended to be higher in c-Rel+ GCB-DLBCL.
Gene expression signature of c-Rel expression in overall-, GCB- and ABC-DLBCL
To better understand regulation and function of c-Rel underlying its clinical impact, genome-wide gene expression of c-Rel+ and c-Rel− DLBCLs were
compared in the overall and subsets of cohorts. Distinct
[image:11.612.66.541.48.369.2]GEP signatures were shown in overall- (Fig. 3I; Table 4) and GCB- (Fig. 3J; Supplementary Table S1) but not in ABC-DLBCL. These c-Rel signatures showed similarity and difference with that in T-cells [44], including genes Figure 3: Gene and protein expression analysis correlating with c-Rel nuclear expression. A–D. c-Rel positivity correlated
with significantly lower levels of pAKT, Myc or p53 protein expression in DLBCL or GCB-DLBCL. E–F.A20/TNFAIP3 which negatively
regulates BCR, TNF, and NF-κB signaling, and c-Rel target gene FOXP3, were significantly upregulated in c-Rel+ GCB-DLBCL. G. Higher c-Rel expression levels (≥30%) correlated with significantly higher FOXP3 mRNA levels in both GCB- and ABC-DLBCL. H.FBXW7 was
significantly upregulated in c-Rel+ GCB-DLBCL. Note: red lines indicate upregulation whereas blue lines indicated downregulation with significant or border-line P values. I–J. Heatmaps by gene expression profiling analysis between c-Rel+ and c-Rel− DLBCL in the overall
and GCB-DLBCL cohorts. K. Heatmap by gene expression profiling analysis between c-Rel+ and c-Rel− DLBCL with low Bcl-2 expression
Table 4: Gene signatures of c-Rel
+in the overall DLBCL cohort (false discovery rate < .10), and
gene signatures of REL
amplification identified in the overall (false discovery rate < .05, fold change
>2) or GCB-DLBCL cohort (false discovery rate < .05)
Function
c-Rel+vs. c-Rel− REL amp+vs. REL amp−
Upregulated Downregulated Upregulated Downregulated
Mitogen, cytokine, growth factor, receptors, signal transduction, NF-κB activation
CTGF, AEBP1, IGFBP7, GPR124, RASEF, PTGFRN
PTP4A3, CCL17, KISS1R*, IL8*,
CD80*, CAMKK2* P2RX5, IL7, PRKCB
DNA replication, recombination, cell
cycle MLF1IP C10orf78
STAG3, H1F0*, NDNL2*
Gene expression, transcription and translation regulation
JUN, MED12,
SFMBT2, NSD1 KDM5A, ZNF267, TCERG1
REL‡, PUS10‡,
FYTTD1, CREM‡,
DENND4A‡,ZNF711,
KDM4B, PAPOLG‡,
SSX4, MED13L*
FOXP1
Actin, cytoskeleton, collagen, cell morphology, adhesion,
extracellular matrix, migration, muscular system function
TAGLN, CALD1, MYH11, CCDC80, SSH1, BGN, HSPG2, KIAA1109
LAMA3 CCT4, PLS3, KIF26B
‡,
ABLIM1, DYNC1I1*, DNAH14*
Protein sorting, protein and
vesicle’s trafficking, transportation, chaperone
GGA3, COG5
SEC23B, PLDN, TXNDC9, TGOLN2, SRP72, SDCCAG1, NIPSNAP3A
CSMD1‡,CLCNKB,
AHSA2‡,XPO1,
PEX13‡
Metabolism, redox NADSYN1, CKMT1A/B,
SLC25A16, POMT2 C18orf55, YME1L1 CTPS2 ODC1, GBA2*
Tumor suppressor,
apoptosis, autophagy MEG3 CISD2 CSMD1
‡,TUSC1,
C20orf117
Degradation RNF180, USP34MAGEA3, COMMD1*‡,
Unknown function NPIP, ANO8 JRKL, DNAJC9, GCOM1/GRINL1A, NOL10
CT45A5‡,MAGEA9‡,
BTNL9, SYT17, KIAA1841,
DNAJC5B, FAM9C‡,
CTAG1A/B‡,ZCCHC7,
ZC3HAV1L*, LOC339803*, ACOXL*, C22orf37*, PRUNE2*, DUSP5P*, CENPBD1*,
MAGEA5*, MEGF8*
MPEG1
involved in signaling, transcription, differentiation, tumor suppression, metabolism, cytoskeleton, adhesion, extracellular matrix assembly, metastasis and angiogenesis. AEBP1 promoting degradation of IκBα and NF-κB activation, and UBA7 encoding an E1 ubiquitin-activating enzyme were upregulated, whereas SDCCAG1 with
a role in nuclear export was downregulated in c-Rel+
DLBCL. BRD2 encoding a BET transcription factor, which enhances IKK activity and NF-κB activation in
ABC-DLBCL in vitro and in vivo [45], was significantly
upregulated in c-Rel+ GCB-DLBCL. Upregulation of
FOXO3 in c-Rel+ GCB-DLBCL, which is negatively
regulated by PI3K/AKT and inhibits MYC expression and function directly or indirectly [46], is consistent with the decreased pAKT and Myc levels in c-Rel+ DLBCL. MEG3,
which encodes a long non-coding RNA that increases p53
levels, and tumor suppressor gene RBM5 were upregulated in c-Rel+ DLBCL and c-Rel+ GCB-DLBCL respectively. Functional dependence on other NF-κB subunits and
distinctive function of c-Rel in overall-, GCB- and ABC-DLBCL
In order to identify the dependency and distinctive
functions of c-Rel versus other NF-κB subunits, we compared the GEP of c-Rel+ and c-Rel− within p50−, p65−,
p52−, RelB−, p50+, p65+ p52+ and RelB+ DLBCL subsets
individually. c-Rel showed GEP signatures in p50+,
p65+, p52− and RelB− DLBCL subsets (Supplementary
Fig. S2M-2N; Supplementary Table S2), but not in p50−,
p65−, p52+ or RelB+ DLBCL. These results may suggest
that c-Rel functions mainly through the canonical pathway
in the forms of c-Rel/p50 and c-Rel/p65 dimers. The
results also imply that c-Rel/p65 and c-Rel/p50 dimers
have significantly distinctive activities compared to other
p65 or p50 dimers (mainly p50/p65 and p50/p50 dimers
[22, 47], potentially also p65/p65 [48], p50/p52 [49], p50/ RelB dimers [22]).
c-Rel function in GCB-DLBCL did not appear to depend on other single NF-κB members significantly, because no c-Rel signatures were identified within
p50+, p65+ p52+ or RelB+ GCB-DLBCL, whereas 16
differentially expressed genes (DEGs) were identified
within the RelB− GCB-DLBCL subset by a high false
discovery rate (FDR < 0.30) threshold.
Although c-Rel nuclear expression did not show distinctive GEP signature in the overall ABC-DLBCL,
within the p65+ ABC-DLBCL subset there were 64 DEGs
between c-Rel+ and c-Rel− (FDR < 0.25), and within
the p50+ ABC-DLBCL subset 28 DEGs (FDR < 0.30)
(Supplementary Fig. S2O-2P; Supplementary Table S3),
supporting the idea that c-Rel function depended on p65 and p50 activation as suggested by the survival analysis
(Fig. 2E-2F). On the other hand, the differential expression of these DEGs between c-Rel+ and c-Rel− within the
p65+ or p50+ ABC-DLBCL groups also suggested that
c-Rel/NF-κB dimers compared with other p65 or p50 dimers have significantly distinct roles in regulation
of proliferation, apoptosis, metabolism, trafficking, cell adhesion, migration, and angiogenesis . In c-Rel+/
p65+ (versus c-Rel−/p65+) ABC-DLBCL, SIGIRR which
attenuates the TLR4 signaling, AEBP1, TFE3 (which
activates CD40L expression), and HSPB1 (encoding
Hsp27 which can either decrease IKK2 activity [50], or enhance proteasomal degradation of IκBα [51]), were
upregulated; SETD6, encoding a methyltransferase which impedes p65 function, was downregulated. In both c-Rel+/
p65+ (versus c-Rel−/p65+) and c-Rel+/p50+ (versus c-Rel−/
p50+) ABC-DLBCL, PSMG1 which promotes assembly of
the 20S proteasome was downregulated.
c-Rel signatures in Bcl-2− and p63− DLBCL
To understand the significant prognostic impact of c-Rel expression in Bcl-2− and p63− DLBCL (Fig. 2D, 2L),
GEP analysis was also performed in Bcl-2− and p63−
DLBCL subsets. In Bcl-2− DLBCL, c-Rel expression
was associated with upregulation of BCL6 (required
for GC formation), JUN, MYCBP2 (MYC binding
protein 2, involved in Myc transcriptional activities and degradation of target proteins), cyclin genes CCNK and
CCNI, LPIN1 involved in metabolism, DDR2 encoding
a tyrosine kinase, and PSMF1, which inhibits the hydrolysis of protein and peptide substrates by the 20S proteasome (Fig. 3K). In p63− DLBCL, c-Rel expression
was associated with upregulation of BCL6, EGR1, AEBP1, C7orf68, CCNG2, CCNI, ILKAP, and PSMG4
(encoding a chaperone protein which promotes assembly
of the 20S proteasome) and downregulation of FBXO22 (involved in degradation of specific proteins in response to p53 induction) (Fig. 3L). In contrast, no genes were significantly differentially expressed between c-Rel+ and
c-Rel− patients in the Bcl-2+ or p63+ DLBCL subset. To
understand the tumor suppressor function of p63 towards
c-Rel signaling, we further compared GEP between p63+
and p63− patients within the c-Rel+ DLBCL subset, and
found that LYN was significantly downregulated in p63+
DLBCL, suggesting that p63 may inhibit BCR signaling
thus attenuate c-Rel activation.
c-Rel signatures in the WT-p53 and MUT-p53 subsets and crosstalk between c-Rel and the p53 Pathway
c-Rel nuclear expression showed distinctive GEP signature only in the WT-p53 subcohort, (Supplementary Fig. S2L), but not in the MUT-p53 subcohort probably due to the heterogeneous and dominant MUT-p53 function [36]. The c-Rel GEP signature in the
WT-p53 subcohort included oncogene JUN, CTTN which
contributes to tumor cell invasion and metastasis, ENG involved in the regulation of angiogenesis, SH3GL1 with
a role in cell cycle whose overexpression may play a role in leukemogenesis, LPIN1 and CKMT1A/B involved in
metabolism regulation, and many genes involved in Golgi function. On the other hand, RASEF with a potential role
as tumor suppressor, and CREBZF (a positive regulator
which plays a role in mitochondrial protein metabolism and promotes antiapoptotic activities was downregulated.
DEGs involved in epigenetic regulation include
upregulatd NSD1 and downregulated KDM5A and MYSM1 (Supplementary Table S4).
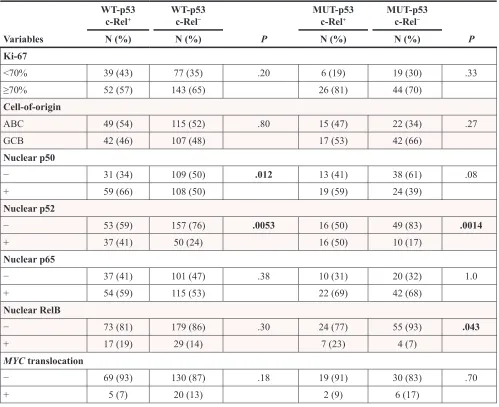
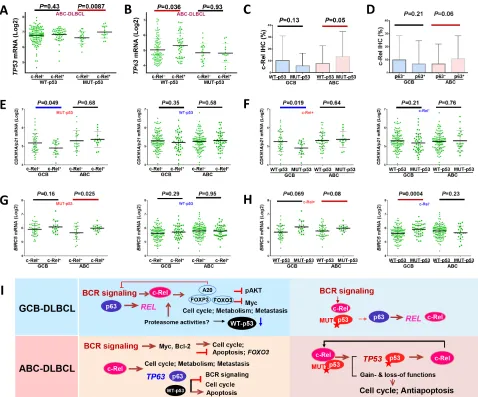
Moreover, nuclear c-Rel positivity coincided with significantly upregulated TP53 transcription in
ABC-DLBCL with MUT-p53 (Fig. 4A), whereas significantly upregulated TP63 and p63 protein levels
in ABC-DLBCL with WT-p53 (Fig. 4B, Supplementary
Fig. S5A). Conversely, in ABC-DLBCL, TP53 mutations
were associated with significantly upregulated REL mRNA (Supplementary Fig. S5B) and higher nuclear c-Rel protein levels (Fig. 4C), and p63+ ABC-DLBCL had
trend for elevated nuclear c-Rel protein levels (P = 0.06, Fig. 4D). In GCB-DLBCL, expression of MUT-p53 and
[image:14.612.67.545.46.443.2]p63 was associated with higher REL mRNA (P = 0.082 and P = 0.0016 respectively, Supplementary Fig. S5C-S5D). To exclude REL amplification as a potential compounding factor, we performed the same analyses in patients without Figure 4: Crosstalk between c-Rel and the p53 pathway. A. In ABC-DLBCL with MUT-p53, c-Rel nuclear expression was associated with significantly higher TP53 mRNA. B. In ABC-DLBCL with WT-p53, c-Rel nuclear expression was associated with significantly higher TP63 mRNA. C. In ABC-DLBCL, TP53 mutations were associated with significantly higher c-Rel nuclear expression
levels. D. In ABC-DLBCL, p63 expression coincided with higher c-Rel nuclear expression levels. E. c-Rel nuclear expression significantly
correlated with CDKN1A/p21 downregulation in GCB-DLBCL with MUT-p53, but not in GCB-DLBCL with WT-p53. F.TP53 mutations
significantly correlated with CDKN1A/p21 downregulation in GCB-DLBCL with c-Rel nuclear expression, but not in GCB-DLBCL without c-Rel nuclear expression. G. c-Rel nuclear expression significantly correlated with BIRC5 upregulation in ABC-DLBCL with MUT-p53, but not in ABC-DLBCL with WT-p53. H. In ABC-DLBCL with c-Rel nuclear expression, TP53 mutations appeared to be associated with higher BIRC5 transcription (marginal P value); in contrast without c-Rel nuclear expression, p53 mutant group correlated with significantly
higher BIRC5 transcription in GCB-DLBCL, whereas appeared to have slightly lower BIRC5 transcription in ABC-DLBCL. Note: red
lines indicate upregulation with significant or border-line P values whereas blue lines indicated downregulation. I. Hypothetical models of
REL amplification or polysomies, and found that only the
correlation between TP53 mutations (but not p63+) and
upregulated REL mRNA (but not the c-Rel protein) in ABC-DLBCL was affected.
c-Rel+ DLBCL with MUT-p53 which
was associated with significantly worse survival (Fig. 2H-2I), also correlated with decreased pAKT and Myc expression (Supplementary Fig. S2I-2J), as seen
in c-Rel+ DLBCL with WT-p53 which did not show
worse survival by univariate survival analysis (Fig. 2G). Therefore to confer worse prognostic impact, c-Rel must have used other oncogenic pathways. We analyzed expression of c-Rel and p53 target genes, which appeared to suggest that MUT-p53 and c-Rel gained functions in
downregulating p21 in GCB-DLBCL (Fig. 4E-4F), and
upregulating BIRC5 (encoding antiapoptotic survivin)
in ABC-DLBCL (Fig. 4G-4H). Our data also suggested
possible lost-of-function of c-Rel in the presence of
MUT-p53 in upregulating TP63 in ABC-DLBCL,
and gain-of-function in inducing NFKB1, TANK, and BCL2L11 in GCB-DLBCL, AURKB, RELA, and BAD in ABC-DLBCL, as well as downregulating TRAF2 in GCB-DLBCL and BCL2L11 in ABC-DLBCL
(Supplementary Fig. S5–S6).
A hypothetical model for the reciprocal induction of REL, TP53 and TP63 and other biology suggested by
GEP analysis in GCB- and ABC-DLBCL with WT- or MUT-p53 is depicted in Fig. 4I.
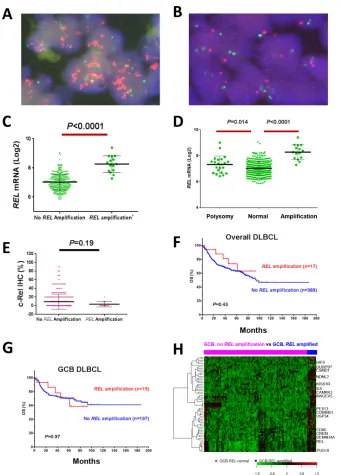
Clinical relevance and gene expression signature of REL amplification in DLBCL
REL amplification detected by FISH (Fig. 5A-5B) was found predominantly in GCB-DLBCL (only two cases of ABC-DLBCL), with a frequency of 4.2% of overall DLBCL, or 7.1% of GCB-DLBCL. REL amplification correlated with significantly higher REL mRNA levels
(Fig. 5C-5D), but not with c-Rel nuclear expression (Fig. 5E), clinical parameters (Table 5) or patient survival either in overall- or GCB-DLBCL (Fig. 5F-5G), suggesting
the importance of posttranslational regulations for c-Rel activation and function.
REL amplification showed distinct GEP signatures in either overall or GCB-DLBCL (Table 4; Fig. 5H). Except CCT4 gene which was also mapped to 2p as REL, these DEGs were not overlapping with those associated with 2p gain in chronic lymphocytic leukemia [53]. USP34 (mapped to 2p; encoding a deubiquitinase which
negatively regulates NF-κB activation), COMMD1 (mapped to 2p; COMMD1 can enhance p65 nuclear degradation), RNF180 (E3 ubiquitin-protein ligase), and XPO1 (mapped to 2p; encoding CRM1 which enhances
p65 nuclear export) were upregulated. Upregulated MAGEA3, which stimulates p53 ubiquitination by enhancing TRIM28 ubiquitin ligase activity, could negatively regulate p53 levels. However, proapoptotic PUS10 (mapped to 2p) and the tumor suppressor genes
CSMD1, KISS1R, NDNL2, TUSC1 and DENND4A
(repressing MYC transcription) were upregulated, which may also explain the lack of prognostic significance of REL amplification.
DISCUSSION
c-Rel is a unique NF-κB member important for lymphocyte development, proliferation and survival [4, 17], however, the clinical relevance of c-Rel activities
in DLBCL has not been well studied with inconsistent
results. In a cohort of 460 DLBCL patients, we found c-Rel nuclear expression positive in 26% of DLBCL patients at lower levels than p65 and p50, and associated with extranodal DLBCL. c-Rel nuclear expression conferred adverse impact in ABC-DLBCL with context-dependent prognostic significance. Remarkably, c-Rel nuclear expression had significantly synergistic effects
with TP53 mutations. Although c-Rel positivity did
not show prognostic significance in DLBCL with WT-p53, multivariate analysis indicated that c-Rel
was an independent adverse prognostic factor after adjusting clinical parameters. Compared with studies
in the literature, the positivity frequency in our study is lower than the 65% and 64% by two previous reports (0% and 30% cutoff respectively) [34, 35], and higher than the 18% by another study using a >50% cutoff [54]; the prognostic significance of c-Rel nuclear expression in MUT-p53 and various ABC-DLBCL
subsets demonstrated in our cohort have not been
reported previously. Moreover, we also found that REL amplifications in 4.2% of DLBCL had no correlation
with nuclear accumulation of c-Rel (consistent with
a previous study [33]) or prognosis (no earlier studies have been reported). In fact, if polysomy cases (46% are
of ABC subtype) are also included into REL amplified cases which resulted in a frequency of 12% for REL amplification in DLBCL, REL amplification correlated with better patient survival in ABC- but not in GCB-DLBCL. We further found that several genes, which are also mapped to 2p, and involved in deubiquitination of IκB, degradation, nuclear export of NF-κB, or proapoptosis, were highly expressed in REL amplified cases likely due to co-amplification.
The lack of prognostic impact of c-Rel nuclear expression in GCB-DLBCL probably results from the decrease in Myc, AKT and p53 expression, and
the complicated interaction and relationships with other
NF-κB subunits. Upregulation of FOXP3 [42], FOXO3 [46], A20 [39, 40], IKK2 and IκBs [41, 49] in c-Rel+
GCB-DLBCL may be relevant for the reductions as well as the phosphorylation-dependent ubiquitin-proteasome system which mediates c-Rel activation and degradation of Myc
and p53 [43, 55]. Decreased p53 and Myc levels in c-Rel+
activation and inhibits c-Rel function shown by an earlier
study [57] may also explain the lack of prognostic effect of c-Rel expression in GCB-DLBCL. In contrast, in ABC-DLBCL, elevated IKKs and other activated signaling (such as BCR) may have increased Myc protein stability [40]; and overexpressed Myc in turn inhibits FOXO3 function [58].
In agreement with a recent study that demonstrated c-Rel is required for the GC maintenance [17], our data showed distinctive c-Rel signatures in GCB- DLBCL but
not in the overall ABC-DLBCL cohort (Fig. 3J); BCL6,
essential for GC maintenance, was upregulated in both
c-Rel+/Bcl-2− and c-Rel+/p63− DLBCL (Fig. 3K-3L). c-Rel
may have different functions by forming different NF-κB dimers. In ABC-DLBCL, c-Rel function depends on p50 and p65 suggested by GEP (Supplementary Fig. S2O-2P) and survival analysis (Fig. 2E-2F). Moreover, in Bcl-2−
DLBCL especially Bcl-2− ABC-DLBCL, c-Rel+ correlated
[image:16.612.138.479.44.519.2]with significantly poorer survival (Fig. 2D), supporting the idea that c-Rel exerted its oncogenic function via Bcl-2-independent pathways [17].
Figure 5: REL amplification analysis in DBLCL. A–B. Representative DLBCL cases positive or negative for REL amplification by fluorescence in situ hybridization analysis. C–D.REL amplification correlated with significantly higher REL mRNA levels. E.REL
Table 5: Clinicopathologic characteristics of 407
de novo DLBCL patients tested for REL
amplification status
DLBCL GCB-DLBCL
REL amp+ REL amp− REL amp+ REL amp−
Variables N (%) N (%) P N (%) N (%) P
Patients 17 (100) 390 (100) 15 (100) 198 (100)
Gender
Male 7 (41) 239 (61) .097 6 (40) 120 (61) .17
Female 10 (59) 151 (39) 9 (60) 78 (39) Age (yr)
<60 8 (47) 170 (44) .77 8 (53) 103 (52) 1.0
≥60 9 (53) 220 (56) 7 (47) 95 (48) Stage
I-II 10 (59) 180 (48) .37 9 (60) 107 (56) .75
III-IV 7 (41) 198 (52) 6 (40) 85 (44)
B-symptoms
No 13 (77) 242 (65) .35 12 (80) 130 (70) .42
Yes 4 (23) 128 (35) 3 (20) 55 (30)
Serum LDH
Normal 8 (47) 144 (41) .60 7 (47) 77 (43) .81
Elevated 9 (53) 210 (59) 8 (53) 100 (57)
# of extranodal sites
0–1 16 (94) 287 (76) .085 14 (93) 148 (78) .17
≥2 1 (6) 90 (24) 1 (6) 41 (22) Performance score
0–1 17 (100) 289 (84) .068 15 (100) 145 (85) .11
≥2 0 (0) 59 (16) 0 (0) 25 (15)
Size of largest tumor
<5cm 8 (57) 176 (59) .91 7 (54) 90 (61) .62
≥5cm 6 (43) 124 (41) 6 (46) 58 (39)
IPI risk group
0–2 14 (82) 239 (89) .11 13 (87) 130 (68) .14
3–5 3 (18) 139 (11) 2 (13) 62 (32)
Therapy response
CR 14 (82) 295 (76) .77 12 (80) 146 (74) 1.0
PR 0 51 0 24
SD 0 16 0 10
[image:17.612.59.557.75.685.2]DLBCL GCB-DLBCL
REL amp+ REL amp− REL amp+ REL amp−
Variables N (%) N (%) P N (%) N (%) P
PD 3 28 3 18
Cell-of-origin
ABC 2 (12) 190 (49) .0024 0 (0) 0 (0)
-GCB 15 (88) 198 (51) 15 (100) 198 (100)
Primary origin
Nodal 9 (53) 253 (66) .30 7 (53) 131 (68) .10
Extranodal 8 (47) 130 (34) 8 (47) 63 (32)
Ki-67
<70% 5 (29) 147 (38) .61 5 (33) 82 (42) .59
≥70% 12 (71) 238 (62) 10 (68) 112 (58)
TP53mutation
MUT TP53 6 (35) 79 (22) .20 5 (33) 46 (25) .49 WT TP53 11 (65) 280 (78) 10 (67) 136 (25)
p53 expression
+ 8 (47) 126 (36) .44 7 (47) 66 (37) .58
− 9 (53) 227 (64) 8 (53) 113 (63)
MYCtranslocation
+ 1 (8) 31 (12) 1.0 1 (10) 21 (17) 1.0
− 11 (92) 228 (88) 9 (90) 102 (83)
BCL2 translocation
+ 5 (29) 54 (16) .18 5 (33) 45 (29) .77
− 12 (71) 273 (84) 10 (67) 112 (71)
BCL6 translocation
+ 5 (33) 88 (32) .91 5 (38) 33 (24) .24
− 10 (67) 187 (68) 8 (62) 106 (76)
Bcl-2 expression
+ 5 (29) 191 (50) .13 4 (27) 80 (41) .41
− 12 (71) 194 (50) 11 (73) 115 (59)
Myc expression
+ 5 (29) 117 (30.5) 1.0 4 (27) 55 (29) 1.0
− 12 (71) 266 (69.5) 11 (73) 137 (71)
pAKT
+ 1 (6) 75 (20) .21 1 (6) 37 (19) .31
− 16 (94) 307 (80) 14 (94) 156 (81)
We attempted to understand the dependence and differences between c-Rel and other NF-κB members. Coexpression in patients and coimmunoprecipitation
analysis in primary DLBCL cells suggest c-Rel can form
complexes with all NF-κB subunits. However, by GEP and
survival analyses dissecting c-Rel function and prognostic impact with and without concurrent activation of other
NF-κB subunits, our results suggested that the oncogenic c-Rel dimers with clinical significance are likely predominated of c-Rel/p65 and c-Rel/p50 in ABC-DLBCL, and potentially c-Rel/c-Rel dimers in GCB-DLBCL, which are all activated via the canonical pathway [4, 17, 68, 69].
Our data suggested crosstalk exist between c-Rel and the p53 pathway, including MUT-TP53 induction at the transcriptional level in c-Rel+ ABC-DLBCL, the gain or
loss of correlation with expression levels of genes involved
in cell cycle (p21, AURKB), apoptosis (BIRC5, BCL2L11), TNF pathways (TRAF2, TANK), and tumor suppressor TP63. Concurrent c-Rel positivity and TP53 mutation
correlated with significantly worse patient survival. This may excel result from formation of different c-Rel/ NF-κB dimers, functional alterations, posttranslational modification [59], or increased REL mutations in patients
with MUT-p53 [60]. In contrast, WT-p53 and p63 may
excel tumor suppressor function towards c-Rel signaling by cell cycle arrest, proapoptosis and BCR signaling inhibition
therefore abolished the prognostic effect of c-Rel activation.
In summary, c-Rel nuclear expression but not REL amplification has an adverse prognostic effect in DLBCL
which synergized with TP53 mutations. c-Rel has distinctive
and overlapping functions compared with other NF-κB subunits, and c-Rel/p65 and c-Rel/p50 dimers may be relevant for the oncogenic role of c-Rel in DLBCL. The biology revealed by c-Rel GEP signatures from this study has gained insight into the NF-κB pathways providing important information for further functional study, and suggest that therapeutic approaches targeting BCR, cell cycle, cytokine, and the p53 pathway, as well as BET inhibitors, but not proteasome inhibitors, may have clinical benefits in c-Rel+ DLBCL patients.
PATIENTS AND METHODS
Patients
This study included 460 patients with de novo DLBCL
treated with standard R-CHOP immunochemotherapy consisting of rituximab plus cyclophosphamide,
DLBCL GCB-DLBCL
REL amp+ REL amp− REL amp+ REL amp−
Variables N (%) N (%) P N (%) N (%) P
p16
+ 10 (67) 95 (29) .0038 9 (69) 58 (35) .017
− 5 (87) 230 (71) 4 (31) 110 (65)
Nuclear p50
+ 6 (40) 188 (52.7) .43 6 (46) 78 (42) .78
− 9 (60) 169 (47.3) 7 (54) 106 (58) Nuclear p52
+ 5 (33.3) 99 (27) .56 4 (31) 56 (30) 1.0
− 10 (66.7) 268 (73) 9 (69) 129 (70)
Nuclear p65
+ 8 (50) 223 (60.6) .44 7 (50) 113 (61) .41
− 8 (50) 145 (39.4) 7 (50) 72 (39)
Nuclear RelB
+ 0 (0) 58 (15.9) .14 0 (0) 27 (15) .22
− 15 (100) 306 (84.1) 13 (100) 159 (85)
Abbreviations: DLBCL, diffuse large B-cell lymphoma; GCB, germinal center B-cell like; ABC, activated B-cell like; LDH, lactate dehydrogenase; IPI, international prognostic index; CR, complete remission; PR, partial response; SD, stable disease; PD, progressive disease.
hydroxydaunomycin (doxorubicin), oncovin (vincristine), and prednisone. The diagnosis, review process, and cell-of-origin classification according to GEP or the immunohistochemical algorithms of Visco-Young and/or Choi have been described previously [36, 61]. Patients were excluded if they had HIV infection, primary cutaneous or nervous system DLBCL, primary mediastinal large B-cell lymphoma, or a history of low-grade B-cell lymphoma with transformation to DLBCL. This study was conducted in accordance with the Declaration of Helsinki, and informed
consent was obtained from all patients whose tumor
samples were used. The study protocol and material transfer
agreement were approved by the institutional review boards
of all participating centers. The overall study was approved by the Institutional Review Board of The University of Texas MD Anderson Cancer Center.
Tissue microarray (TMA) and immunohistochemical assay
Immunohistochemical analysis for c-Rel, p50, p52, p65, RelB, p53, p63, Myc, Bcl-2, pSTAT3, pAKT, MDM2, and Ki-67 was performed on the TMA prepared with formalin-fixed, paraffin-embedded (FFPE) tissue blocks from all of the 460 DLBCL patients using methods previously described [36, 61, 67]. The results were
analyzed independently by a group of hematopathologists
(LL, CYO, AT, KHY), and disagreements were resolved by joint review with use of a multi-head microscope [70, 71].
TP53 mutation and fluorescence in situ
hybridization (FISH) analysis
Genomic DNAs extracted from FFPE tissues
were used for TP53 exon sequencing analysis with use of the AmpliChip (Roche Molecular Systems) [36]. FISH analysis for REL amplification used a customer developed dual-color mix (Agilent Technologies, G100258R-8) consisting of a 2p16.1 (REL-locus) probe
labeled with Spectrum Orange and a reference probe (chromosome 2 centromere) labeled with Spectrum Green. Dual-color FISH was performed on 4 micron sections of the TMAs. Fluorescence signals were scored
by counting the number of single-copy genes and
reference probe signals in 200 well-defined nuclei. High-level amplification was defined as the presence of either 6 gene signals or tight clusters of at least five gene signals
per cell. Low level gains were considered when the ratio
between REL and CEP2 signals exceeded 2. Cases were
considered polysomic for chromosome 2e if the number
of tumor cell nuclei with three or more signals exceeded
the mean +3 s.d. of polysomic nuclei in the reference
cases (i.e. 15%). Five tonsils were used as references. Probes and methods of FISH analysis for MYC, BCL2, and BCL6 translocation have been described
previously [62].
Gene expression profiling
Total RNAs were extracted from FFPE tissues and used for GEP by Affymetrix GeneChips array as described previously [36, 61]. GEP was achieved in 453 DLBCL patients. The CEL files are deposited in the National Center for Biotechnology Information Gene Expression Omnibus repository (GSE#31312).61 The microarray
data were quantified and normalized by the frozen robust multiarray analysis (RMA) algorithm. The DEGs were identified by using multiple t-tests. Pathway analysis
for the DEGs was performed with use of the Ingenuity
Pathway Analysis software program (http://www.qiagen. com/ingenuity).
Cell culture and coimmunoprecipitation
Human-derived DLBCL cell lines (MS, DB, LR, LP)
were established from tissue biopsy or effusion specimens
from patients as described previously [63, 64]. The cells were cultured in RPMI medium (Gibco, Rockville, MD) containing 15% fetal calf serum (FCS; Hyclone, Logan, UT). Coimmunoprecipitation was carried out as described previously [65, 66].
Statistical analysis
The clinical and pathologic features at the time of
presentation were compared between various DLBCL subgroups by using the Chi-square test. Correlation
between expression of different genes or proteins was evaluated by the Spearman rank correlation method and
unpaired t tests. Overall survival was calculated from the
date of diagnosis to the date of last follow-up or death.
Progression-free survival was defined as the time period
from the date of diagnosis to the date of progression or
death. OS and PFS curves of the various groups were analyzed by GraphPad Prism 6 (GraphPad Software, San Diego, CA) using the Kaplan-Meier method, and
differences were compared with use of the log-rank
(Mantel-Cox) test. Multivariate analysis was conducted by using the Cox proportional hazards regression model with the SPSS software (version 19.0; IBM Corporation, Armonk, NY). Any difference with a P value of < 0.05
was considered statistically significant.