5
III
March 2017
Technology (IJRASET)
Brain Tumour Segmentation Based on SFCM using
Back Propagation Neural Network
Raja.S1, Senthil Kumar. A2, V.Gokilavani3, M.Lavanya4, S.Lavanya5
1,2
Assistant Professor, 3,4,5UG Students , Dept. of ECE Sri Shakthi Institute of Engg and Technology, Coimbatore, TN, India.
Abstract: Automatic defects detection in MR images is very important in many diagnostic and therapeutic applications. Because of high quantity data in MR images and blurred boundaries, tumour segmentation and classification is very hard. This work has introduced one automatic brain tumour detection method to increase the accuracy and yield and decrease the diagnosis time. The goal is classifying the tissues to three classes of normal, begin and malignant. . In MR images, the amount of data is too much for manual interpretation and analysis. During past few years, brain tumor segmentation in magnetic resonance imaging (MRI) has become an emergent research area in the field of medical imaging system. Accurate detection of size and location of brain tumor plays a vital role in the diagnosis of tumor. The diagnosis method consists of four stages, pre-processing of MR images, feature extraction, and classification. After histogram equalization of image, the features are extracted based on Dual-Tree Complex wavelet transformation (DTCWT). In the last stage, Back Propagation Neural Network (BPN) are employed to classify the Normal and abnormal brain. An efficient algorithm is proposed for tumor detection based on the Spatial Fuzzy C-Means Clustering.
Keywords: MR images, tumour detection method, Fuzzy C-Means Clustering, medical imaging system.
I. INTRODUCTION
The brain is a soft, delicate and spongy mass of tissue. It is a stable place for patterns to enter and stabilize among each other. A tumour is basically a mass of tissue that grows out of control of the normal forces that regulates its growth. Brain tumour is a group of abnormal cells that grows either inside the brain or around the brain . Tumors can directly destroy all healthy brain cells. It can also indirectly damage healthy cells by crowding other parts of the brain and causing inflammation , brain swelling and pressure within the skull. Benign brain tumours are low grade which grow slowly and are less likely to return after treatment. Malignant brain tumours are high grade and either start in the brain (primary tumours) or spread into the brain from elsewhere (secondary tumours) and more likely to grow back after treatment. MRI Imaging play an important role in brain tumour for analysis, diagnosis and treatment planning . It offers better difference concern of various soft tissues of human body and provides better results than CT, Ultrasound, and X-ray . In this the various pre-processing , post processing and methods like Filtering , contrast enhancement and post processing techniques like Segmentation, Morphological operation through image processing (IP) tool is available in MATLAB for detection of brain tumour images.
Thresholding method extract the features from the MRI image whereas dual- tree complex wavelet transform is used for feature extraction. Convolutional neural networks are used in the segmentation to achieve breakthrough results .The context of CNN involves initialization and the activation function . A convolutional neural network is a type of feed-forward artificial neural network in which the connectivity pattern between its neurons is inspired by the organization of the visual cortex. Individual cortical neurons respond to stimuli in a restricted region of space known as the receptive field. The receptive fields of different neurons partially overlap such that they tile the visual field. The response of an individual neuron to stimuli within its receptive field can be approximated mathematically by a convolution operation. Since it requires a lot of training data and more computational cost we are using back propagation neural network for classification.
II. LITERATURE SURVEY
A. Glioma Segmentation and Registration
Technology (IJRASET)
©IJRASET: All Rights are Reserved
357
patient specific atlas and subsequently use it as a set of probability maps to compute the posterior probabilities of tissue labels. In other words, we rely on the tumor growth model to deform and mask out the original atlas with a synthetically generated tumor probability map, a process which we call it atlas seeding. The seeded atlas is registered to patient scans and guides the segmentation process.B. Adaboost SVM algorithm
When applying Boosting method to strong component classifiers, these component classifiers must be appropriately weakened in order to benefit from Boosting. Hence, if RBFSVM is used as component classifier in AdaBoost, a relatively large value, which corresponds to a RBFSVM with relatively weak learning ability, is preferred. In the proposed AdaBoost SVM, without loss of generality, the re-weighting technique is used to update the weights of training samples. AdaBoost SVM can be described using algorithm: Initially, a large value is set to s, corresponding to a RBFSVM classifier with very weak learning ability. Then, RBFSVM with this s is trained as many cycles as possible as long as more than half accuracy can be obtained. Otherwise, this s value is decreased slightly to increase the earning capability of RBFSVM to help it achieve more than half accuracy.
III. EXISTING SYSTEM
Gliomas are the brain tumour with the highest mortality rate and prevalence. These neoplasms can be graded into Low Grade Gliomas (LGG) and High Grade Gliomas (HGG), with the former being less aggressive and infiltrative than the latter. Even under treatment, patients do not survive on average more than 14 months after diagnosis. Current treatment in the accurate segmentation of gliomas and its intra-tumoral structures is important not only for treatment planning, but also for follow-up evaluations. However, manual segmentation is time-consuming and subjected to inter- and intra-rater errors difficult to characterize. Thus include surgery, chemotherapy, radiotherapy, or a combination of them. MRI is especially useful to assess gliomas in clinical practice, since it is possible to acquire MRI sequences providing complementary information Random Forests (RF) were successfully applied in brain tumour segmentation. The RF became very used due to its natural capability in handling multi-class problems and large feature vector.
IV. EXPERIMENTAL SETUP
We conclude that the extra information provided by the rotations of the first variant in training the CNN resulted in segmentations with a better delineation of the complete tumour as well as of the intra-tumoral structures. In both grades, we have an excess of non-enhancing class, when we trained without data augmentation, and for HGG this class is even found inside the region formed by enhancing and necrotic structures, which does not happen in the manual segmentation. Brain tumours are constituted by intra-tumoral structures with very different volumes, resulting in an imbalanced number of samples of each class. This underrepresentation of some classes impairs the performance of the CNN. So, we investigated a second type of data augmentation to balance the number of samples of each class, which consisted in extracting samples from necrosis and enhancing tumour regions in HGG to use as training samples in LGG.
We compare the proposed approach, in which the number of samples of each tumour class in LGG were more balanced, with another experiment that uses only samples from LGG. We verify that the extra samples from HGG improved all metrics for the complete and core regions in the Leader board data set with a mean gain of 1:9%. Examining we note that by sampling from HGG to LGG, we improved the training of the CNN. Observe that the tumour segmentation presented a better delineation of the enhancing and non-enhancing regions, although the sampling was only for enhancing and necrosis regions.
Technology (IJRASET)
Figure 1. Proposed System
A. Activation Function
The gradients of ReLU are zero when the unit is not active, which may slow down the convergence during the optimization and lead to worst training. To avoid that problem, Maas proposed LReLU as an alternative nonlinearity. So, we investigate the effectiveness of this activation function in brain tumor segmentation. In this experiment, only the activation function was changed in the proposed method. The results in both the Leaderboard and Challenge data sets are presented in Table IV. We verify that LReLU activation improved the performance of the proposed method in both data sets in the DSC and PPV, with the exception of the core in the DSC in the Leaderboard data set. ReLU activations presented better scores in the Sensitivity metric. However, the mean gain using LReLU instead of ReLU was 1:3% (Leaderboard: 0:44%, Challenge: 2:2%). we find that using ReLU as an activation function resulted in an excessive segmentation of non-enhancing and necrosis regions outside the core for HGG.
B. Patch Extraction Plane
The use of 2D patches in a MRI image requires that we define a plane perpendicular to an axis to extract patches. So, following the procedure defined in the previous subsection, we investigated the use of patches extracted in a plane perpendicular to the Axial, Coronal, and Sagittal axis. As can be observed, extracting patches in the plane perpendicular to the Axial axis presented the best overall performance with a mean gain of 2:33% relative to the Coronal plane (Leader board: 1:89%, Challenge: 2:78%) and 4:00% relative to the Sagittal plane (Leader board: 3:56%, Challenge: 4:44%). The Axial plane presented better DSC and PPV scores for both data sets than the Sagittal plane, but worst sensitivity for the Challenge data set and for the complete region in the Leader board data set. Considering Fig. 4, this can be explained by an over-segmentation of the tumour, which is corroborated by the lower PPV score. A similar pattern is found for the Coronal plane, which was better in the enhanced region for the PPV score and in the complete region for the Sensitivity score.
C. Global Validation
They compiled the results of the top 5 methods in the Leaderboard and Challenge data sets of BRATS 2013 (including the proposed method). We also include the proposals by Havaei et al. Davy et al., and Urban et al. that are based on CNN. Appraising the results in Table V, we conclude that no method is yet able to achieve the first place in all metrics and regions for brain tumor segmentation; but, the proposed method obtained the first position in DSC in the three regions (Challenge data set), according to the online evaluation platform Also, based on the same evaluation, the proposed method obtained the overall first position in both data sets, outperforming the other methods.
V. PROPOSEDSYSTEM
The proposed system uses dual tree complex wavelet transform for feature extraction and the MRI image is compared with the normal image and then classified using classifier called back propagation neural network divides the brain MRI image as normal and tumour affected. Further, on detecting the tumour part we cluster them by using the spatial fuzzy c means clustering algorithm.
Technology (IJRASET)
©IJRASET: All Rights are Reserved
359
Figure 2 : Proposed block diagramThe input of this system is the MRI image and further processed by using DTCWT and feature extraction is done .After the detection clustering is done and the output is further validated. Detection of brain tumor requires high-resolution brain MRI. Mo st Medical Imaging Studies and detection conducted using MRI, Positron Emission Tomography (PET) and, Computer Tomography (CT) Scan. Now a day’s MRI systems are very important in medical image analysis. MRI has a multidimensional nature of data provided from different sequential pulses. A MRI (Magnetic Resonance Imaging) scan is a radiology technique that uses magnetism, radio waves, and a computer to produce images of body structures. The MRI scanner is a tube surrounded by a giant circular magnet. The patient is placed on a moveable bed that is inserted into the magnet. The magnet creates a strong magnetic field that aligns the protons of hydrogen atoms, which are then exposed to a beam of radio waves. This spins the various protons of the body, and they produce a faint signal that is detected by the receiver portion of the MRI scanner.
The receiver information is processed by a computer, and an image is produced. The image and resolution produced by MRI is quite detailed and can detect tiny changes of structures within the body. For some procedures, contrast agents, such as gadolinium are used to increase the accuracy of the images. MR images result from the excitation of hydrogen protons by Radio Frequency (RF) pulses. The MRI machine generates very brief RF Pulses; these RF pulses excite hydrogen, and elevate them to a higher energy state. As the protons return to a lower energy state, they relies electromagnetic energy. This energy is picked up and amplified by the magnet’s antennae and turned into visual display images.
Images of a patient obtained by MRI scanning are displayed as an array of pixels (a two dimensional unit based on the matrix size and the field of view) and stored in memory. In Matlab, there are several formats of image encoding, in this research the MR image is in .jpeg format and the size is 51KB.The image is taken from hospital and put inside the MATLAB code and then algorithms are executed.
A. Removal of Unwanted Parts from the Brain Mr Image
In pre-processing module image acquired will be processed for correct output. Medical images surely will have some Film artifacts like labels, marks and unwanted or critical parts which are detected and removed for better result. Pre-processing was done by using some algorithm. Pre-processing should be done so that the result can be obtained in the better way. To find out the transformation between two images precisely they should be pre-processed to improve their quality and accuracy of result. If these images are too noisy or blurred, they should be filtered and sharpened. Because in MATLAB color image takes more time .A gray scale image can be specified by giving a large matrix whose entries are numbers between 0 and 255, with 0 to black, and 255 to white. Pre-processing helps in quick execution in the MATLAB.
B. Image Enhancement
In the Enhancement stage the filters are designed to enhance the appearance of images, primarily by sharpening Edges, corners, and line detail. Several of the new enhancement filters also incorporate a noise-reduction component. Median filtering is a nonlinear operation often used in image processing to reduce "salt and pepper" noise. Median filtering is more effective than convolution when the goal is to simultaneously reduce noise and preserve edges .If the input image A is of an integer class, all the output values are returned as integers. If the number of pixels in the neighbourhood (i.e., m*n) is even, some of the median values might not be integers.
C. Median Filter
Technology (IJRASET)
VI. ALGORITHMSTEPS
INPUT: Initialize the cluster centre provided by
Vx = {s1,s2,...,sc},fixed number of cluster c ,error tolerance =0.001. OUTPUT: Cluster center C={c1,c2,...,cc},membership matrix Step1: Initial the cluster center C and U by the shots of query Step 2: Input sample dataset Vd.
[image:6.612.57.554.309.709.2]Step 3: Calculate the cluster c enters Step 4: Update U
Step 5: If ||Ul-Ul-1 and return to step 4; otherwise, stop.
The MATLAB function FCM performs FCM clustering. The function fame takes a data set and a desired number of clusters and returns optimal cluster centers and membership grades for each data point. It starts with an initial guess for the cluster centers, which are intended to mark the mean location of each cluster. The initial guess for these cluster centers is most likely incorrect. Next, FCM assigns every data point a membership grade for each cluster. By iteratively updating the cluster centers and the membership grades for each data point, FCM iteratively moves the cluster centers to the right location within a data set. This iteration is based on minimizing an objective function that represents the distance from any given data point to a cluster center weighted by that data point's membership grade. The dataset is obtained from the data file.
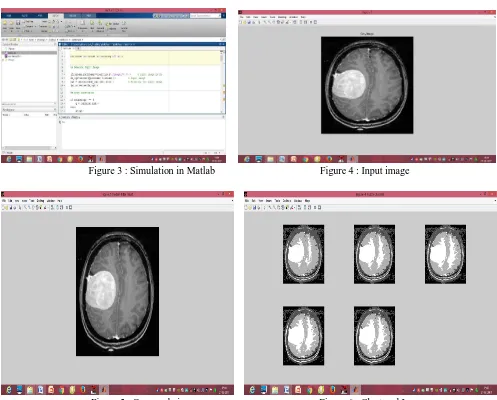
. VII.RESULTANDDISCUSSION
Figure 3 : Simulation in Matlab Figure 4 : Input image
Technology (IJRASET)
©IJRASET: All Rights are Reserved
[image:7.612.144.469.166.371.2]361
FCM clustering is an iterative process. The process stops when the maximum number of iterations is reached, or when the objective function improvement between two consecutive iterations is less than the minimum amount of improvement specified. For iris dataset comprising of 30 total iteration count results a total objective function equals to 6058.689983. The total elapsed time is 0.781679 seconds. The bold numbers represent the final fuzzy cluster center obtained by updating them iteratively. After the clustering of the tumour segment it has been validated to produce the result. Since it uses the clustering by c means it identifies the tumour places cluster them altogether and then evaluates them.Figure 7: Output Image
VIII. CONCLUSION
Here an automated brain detection method using ANN-BPN and Spatial Fuzzy algorithm is proposed in this work .The noise after pre-processing is removed by median filter .The experimental results in terms of qualitative and quantitative metrics of proposed algorithm and other state of art technique are provided with better performance of proposed neural network is demonstrated .In our future work we are doing it to implement in the FPGA board for the efficient use of them in proposed architecture.
REFERENCES
[1] S. Bauer et al., “A survey of mri-based medical image analysis for brain tumor studies,” Physics in medicine and biology, vol. 58, no. 13, pp. 97–129, 2013. [2] D.N. Louis et al., “The 2007 who classification of tumours of the central nervous system,” Acta neuropathologica, vol. 114, no. 2, pp. 97–109, 2007
[3] E. G. Van Meir et al., “Exciting new advances in neuro-oncology: The avenue to a cure for malignant glioma,” CA: a cancer journal for clinicians, vol. 60, no. 3, pp. 166–193, 2010
[4] G. Tabatabai et al., “Molecular diagnostics of gliomas: the clinical perspective,” Acta neuropathologica, vol. 120, no. 5, pp. 585–592, 2010.
[5] L. G. Ny´ul, J. K. Udupa, and X. Zhang, “New variants of a method of mri scale standardization,” IEEE Transactions on Medical Imaging,vol. 19, no. 2, pp. 143–150, 2000.
[6] M. Prastawa et al., “A brain tumor segmentation framework based on outlier detection,” Medical image analysis, vol. 8, no. 3, pp. 275–283,2004.
[7] B. H. Menze et al., “A generative model for brain tumor segmentation in multi-modal images,” in Medical Image Computing and Computer-Assisted Intervention–MICCAI 2010. Springer, 2010, pp. 151–159.