R E S E A R C H
Open Access
Cell type-specific epigenetic links
to schizophrenia risk in the brain
Isabel Mendizabal
1†, Stefano Berto
2†, Noriyoshi Usui
2,5,6†, Kazuya Toriumi
2,7†, Paramita Chatterjee
1,
Connor Douglas
2, Iksoo Huh
1,8, Hyeonsoo Jeong
1, Thomas Layman
1, Carol A. Tamminga
3, Todd M. Preuss
4,
Genevieve Konopka
2*and Soojin V. Yi
1*Abstract
Background:The importance of cell type-specific epigenetic variation of non-coding regions in neuropsychiatric disorders is increasingly appreciated, yet data from disease brains are conspicuously lacking. We generate cell type-specific whole-genome methylomes (N= 95) and transcriptomes (N= 89) from neurons and oligodendrocytes obtained from brain tissue of patients with schizophrenia and matched controls.
Results:The methylomes of the two cell types are highly distinct, with the majority of differential DNA methylation occurring in non-coding regions. DNA methylation differences between cases and controls are subtle compared to cell type differences, yet robust against permuted data and validated in targeted deep-sequencing analyses. Differential DNA methylation between control and schizophrenia tends to occur in cell type differentially methylated sites, highlighting the significance of cell type-specific epigenetic dysregulation in a complex neuropsychiatric disorder.
Conclusions:Our results provide novel and comprehensive methylome and transcriptome data from distinct cell populations within patient-derived brain tissues. This data clearly demonstrate that cell type
epigenetic-differentiated sites are preferentially targeted by disease-associated epigenetic dysregulation. We further show reduced cell type epigenetic distinction in schizophrenia.
Keywords:Schizophrenia, Neurogenomics, Epigenetics, DNA methylation, Transcriptome, Brain cell type, Neuron, Oligodendrocyte
Background
Schizophrenia is a lifelong neuropsychiatric psychotic dis-order affecting 1% of the world’s population [1]. Genetic dissection of schizophrenia risk has revealed the polygenic nature of the disorder [2–4]. Many of the schizophrenia risk loci are located in the non-coding regions of the genome, suggesting gene regulation plays a role in disease pathology. Indeed, a large number of these risk loci are associated with alterations in the gene expression in schizophrenia [2, 5, 6]. These observations implicate epi-genetic mechanisms as potential mediators of epi-genetic risk
in schizophrenia pathophysiology. Epigenetic mechanisms, such as DNA methylation, may have particular relevance for human brain development and neuropsychiatric diseases [7–9]. Previous studies found that changes in DNA methylation associated with schizophrenia are significantly enriched with DNA methylation changes from prenatal to postnatal life [7]. Moreover, genome-wide association studies (GWAS) of schizophrenia risk loci were over-represented in variants that affect DNA methylation in fetal brains [10].
Prior studies of the genetic and epigenetic risks for schizophrenia have some limitations, however, including the use of pre-defined microarrays, which traditionally focused on CpG islands and promoters, for methylation profiling. Unbiased, genome-wide analyses of DNA methylation are revealing that variation in DNA methy-lation outside of promoters and CpG islands define the critical epigenetic difference between diverse cell types
© The Author(s). 2019Open AccessThis article is distributed under the terms of the Creative Commons Attribution 4.0 International License (http://creativecommons.org/licenses/by/4.0/), which permits unrestricted use, distribution, and reproduction in any medium, provided you give appropriate credit to the original author(s) and the source, provide a link to the Creative Commons license, and indicate if changes were made. The Creative Commons Public Domain Dedication waiver (http://creativecommons.org/publicdomain/zero/1.0/) applies to the data made available in this article, unless otherwise stated. * Correspondence:Genevieve.Konopka@utsouthwestern.edu;
soojinyi@gatech.edu
†Isabel Mendizabal, Stefano Berto, Noriyoshi Usui, and Kazuya Toriumi are co-first authors.
2
Department of Neuroscience, UT Southwestern Medical Center, Dallas, TX 75390, USA
1School of Biological Sciences, Georgia Institute of Technology, Atlanta, GA
30332, USA
[11,12]. Additionally, previous genomic studies of schizo-phrenia have used brain tissue samples containing a heterogeneous mixture of cell types, although gene expression patterns vary considerably across cell types in the human brain [13–17]. To address these concerns, we carried out whole-genome methylome and tran-scriptome analyses using postmortem human brain
tissue that underwent fluorescence-activated nuclei
sorting (FANS) [18] into neuronal (NeuN+) and oligo-dendrocyte (OLIG2+) cell populations. Both neurons and myelin-forming oligodendrocytes have been implicated in
schizophrenia pathophysiology [19, 20] and may be
functionally dependent on one another for proper signal-ing in the brain [21]. Tissue was dissected from Brodmann area 46 (BA46) of the dorsolateral prefrontal cortex, a key brain region at risk in schizophrenia [1, 22]. We used whole-genome bisulfite sequencing (WGBS) to obtain an unbiased assessment of epigenetic modifications asso-ciated with schizophrenia and additionally carried out whole-genome sequencing (WGS) and RNA sequencing (RNA-seq) of the same samples to document transcrip-tomic consequences while accounting for the genetic background differences.
Integrating these data, we demonstrate extensive diffe-rential DNA methylation between neurons and oligoden-drocytes. Comparisons to previous studies using bulk tissues indicate that they were generally biased toward neuronal populations. Our resource thus offers com-prehensive and balanced analyses of molecular variation in control and disease brains, including novel information from a major yet relatively underexplored brain cell popu-lation (oligodendrocytes). This comprehensive and novel dataset allows us to demonstrate subtle yet robust DNA methylation differences between control and schizophre-nia samples, which are highly enriched in sites that are epigenetically differentiated between the two cell types. Moreover, we show that schizophrenia-associated DNA methylation changes reduce the cell type methylation dif-ference. Together, these data indicate that the integration of multiple levels of data in a cell type-specific manner can provide novel insights into complex genetic disorders such as schizophrenia.
Results
Divergent patterns of DNA methylation in human brain cell types
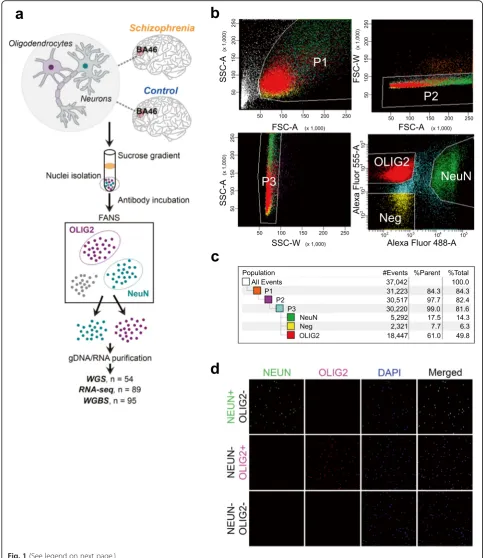
We performed FANS [18] using postmortem tissue
dissected from BA46 of the dorsolateral prefrontal cortex using NeuN and OLIG2 antibodies (Fig.1a; Additional file1:
Table S1; see the “Methods” section). Immunofluorescent
labeling indicates that NeuN-positive nuclei and OLIG2-positive nuclei following FANS (hereinafter “NeuN+” or “OLIG2+”) represent neurons within the cerebral cortex and oligodendrocytes and their precursors, respectively
(Fig.1b–d). We analyzed genomic DNA (gDNA) and total
RNA from the same nuclei preparations in NeuN+ or
OLIG2+by WGBS and RNA-seq. We additionally carried
out WGS of the brain samples to explicitly account for the effect of genetic background differences.
Whole-genome DNA methylation maps of NeuN+
(N= 25) and OLIG2+ (N= 20) from control individuals (Additional file 1: Table S1) show a clear separation of
the two populations (Fig. 2a). Previously published
whole-genome methylation maps of neurons [27]
co-segregate with NeuN+. On the other hand, previously
generated NeuN− methylomes [27] cluster as outliers of
OLIG2+ samples, potentially due to the inclusion of
other cell types compared to our cell-sorted samples. We identified differentially methylated CpGs between cell types, which we refer to as“differentially methylated positions (DMPs),”using a statistical method that allows us to explicitly take into account the effect of covariates (Additional file 1: Table S2; see the “Methods” section), while handling variance across biological replicates as well as the beta-binomial nature of read count
distri-bution from WGBS [29]. Despite the large number of
CpGs (~ 25 million out of the total 26 million CpGs in the human genome have been analyzed), we identify
numerous DMPs between NeuN+ and OLIG2+after
cor-recting for multiple testing. At a conservative Bonferroni
P< 0.05, over 4 million CpGs are differentially methyl-ated between these two cell types, revealing highly distinct cell type difference in gDNA methylation (Fig.2a,
b). On average, DMPs between NeuN+ and OLIG2+
exhibit a 32.6% methylation difference. NeuN+ tends to
be more hypermethylated than OLIG2+ (Fig. 2b; 64% of
DMPs, binomial test, P< 10−16). This observation is
consistent with NeuN+ being more hypermethylated
than non-neuronal populations [27].
As expected from regional correlation of DNA methy-lation between adjacent sites [30–32], many DMPs occur near each other, allowing us to identify “differentially methylated regions” or “DMRs” (defined as ≥ 5 signifi-cant DMPs in a 50-bp region) spanning 103 MB in the human genome, exhibiting mean methylation difference of 38.3% between cell types (Fig. 2c, Additional file 2: Table S3). Many DMRs reside in introns and distal inter-genic regions (Fig. 2d), which are traditionally viewed as
“non-coding.” Chromatin state maps based on six
chro-matin marks [28] indicate that many DMRs, especially
those located in introns and distal intergenic regions, exhibit enhancer chromatin marks, in particular, brain
enhancers (OR between 2.6- and 4.6-fold, P< 0.01,
the Illumina 450K do poorly in terms of targeting putative epigenetic regulatory loci (Fig. 2d).
NeuN+-specific hypo-methylated regions are
signifi-cantly enriched in recently identified NeuN+-specific
H3K4me3 and H3K27ac peaks [9] (Fig.2f; Fisher’s exact
test OR = 7.8, P< 10−15). H3K4me3 and H3K27ac peaks
in the NeuN− populations also show significant
enrich-ment of OLIG2+-specific hypo-methylation, although the
degree of enrichment is less strong than NeuN+
[image:3.595.55.540.88.647.2]potentially due to the inclusion of other types of cells. WGBS data is complementary to ChIP-seq data in terms of resolution and coverage. While ChIP-seq provides resolution in the scale of several thousand base pairs (for example, peak sizes in previous study [9] are on average several kilobases and extend up to several hundred kilobases), WGBS data offers base pair resolution. Even though DMPs are generally concentrated around the center of ChIP-seq peaks, some peaks show more diffuse patterns, indicating that incorporating DMP information could offer fine-scale resolution of histone modification in individual genomic regions (Fig. 2g, Additional file3: Figure S2).
We further examined DNA methylation of cytosines that are not in the CpG context, as nucleotide resolution whole-genome DNA methylation maps have begun to reveal the potential importance of non-CG methylation (CH methylation, where H = A, C, or T) particularly in neuronal function [27]. We observed that low levels of
CH methylation were present in NeuN+ but nearly
absent in OLIG2+ (Additional file 3: Figure S3),
consis-tent with previous reports [27]. CH methylation is
primarily associated with CA nucleotides (69.4%),
followed by CT (26%) and CC (4.6%) (Additional file 3:
Figure S3). In addition, gene body mCH values negatively correlate with gene expression in NeuN+(Spearman’s rho
−0.16, P< 10−10; Additional file 3: Figure S3). Therefore, CH patterns at gene bodies provide an additional layer of gene expression regulation that is specific to neurons while absent in oligodendrocytes in the human brain.
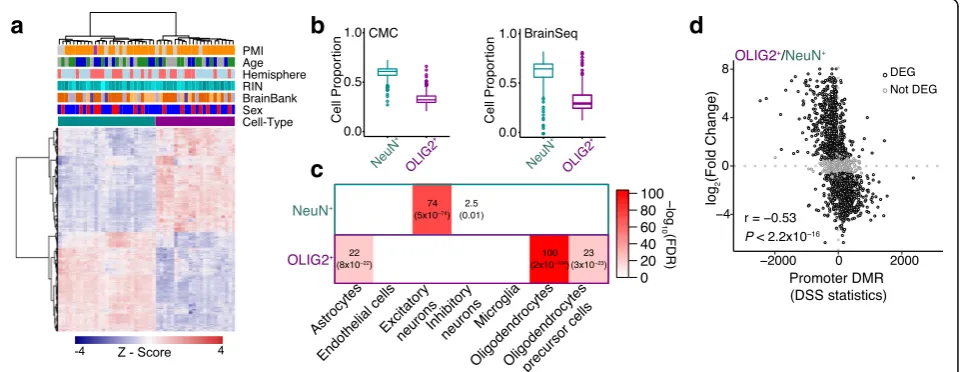
Strong association between cell type-specific DNA methylation and expression
We next performed RNA-seq using RNAs extracted from the nuclei-sorted populations (see the“Methods”section).
NeuN+ and OLIG2+ transcriptomes form distinctive
clusters (Fig. 3a). Transcriptomic data from cell-sorted populations clustered closer to bulk RNA-seq data from the cortical regions but were distinct from those from the cerebellum and whole blood (Additional file3: Figure S4). We further show that previously generated bulk RNA-seq data [5, 6] have higher proportion of NeuN+ compared
with OLIG2+ (Fig. 3b), indicating that these previously generated bulk RNA-seq data are biased toward neurons. The higher neuronal proportion in bulk RNA-seq is highlighted also using an independent single-nuclei data (Additional file3: Figure S5).
We show that 55% of genes show significant change in expression between NeuN+and OLIG2+(|log2(fold change)
| > 0.5 and Bonferroni correction < 0.05; Additional file 1: Table S5). NeuN+- and OLIG2+-specific genes (defined as
significantly upregulated in NeuN+ compared to OLIG2+
and vice versa) are enriched for known markers of specific cell types of the brain. Specifically, NeuN+-specific genes are enriched for excitatory and inhibitory neurons, whereas OLIG2+-specific genes show strong enrichment for oligo-dendrocytes and lower enrichment for oligodendrocyte precursor cells and astrocytes (Fig. 3c). Divergent DNA methylation between cell types can explain a large amount of gene expression variation between cell types (Fig. 3d, Spearman’s rho =−0.53, P< 10−15). Significant correlation extends beyond the promoter regions (Additional file 3: Figure S6),
Differential DNA methylation associated with schizophrenia
We next analyzed whole-genome methylation maps from brain tissue from patients with schizophrenia (28
NeuN+ and 22 OLIG2+) and contrasted these data with
data from matched controls (25 NeuN+and 20 OLIG2+;
see the “Methods” section) described in the previous
section. Compared to the robust signal of cell type dif-ference, DNA methylation changes associated with schizophrenia are subtler. At a moderately stringent FDR < 0.2, we identify 261 individual CpGs (60 in NeuN+
and 201 in OLIG2+) that are differentially methylated
between control and schizophrenia. Applying additional filtering for high-coverage sites (20× in at least 80% of samples per disease-control group), we identify a total of 97 CpGs (14 NeuN+and 83 OLIG2+specific) at FDR < 0.2 (Additional file 1: Tables S6–S7). Results of differential DNA methylation analyses in the rest of the paper all refer to those from the filtered dataset, and differentially me-thylated sites between case and control are referred to as
(See figure on previous page.)
“szDMPs.” The average methylation difference between schizophrenia and control at FDR < 0.2 szDMPs is ~ 6% (Additional file1: Tables S6–S7), which is within the range of case/control differences our sample sizes are em-powered to detect according to our power analyses (see the “Methods” section; Additional file 3: Figure S7). The majority of the szDMPs (FDR < 0.2) are intronic (50.5%) and distal intergenic CpGs (45.4%), whereas only two of them are located within 3 kb from the transcriptional start sites (Additional file 1: Tables S6–S7). Interestingly, two
szDMPs (FDR < 0.2) in OLIG2+ are located within the
regions reported to be associated with schizophrenia by
GWAS [4] including a CpG located in the intron of
NT5C2gene, involved in purine metabolism.
In addition to the power analysis (see the “Methods”
section, Additional file 3: Figure S7), we assessed the robustness of the results as well as the effects of cova-riates or potential hidden structures in the data by permu-tation analysis, by randomly assigning case/control labels 100 times per cell type. The observed DNA methylation difference between control and schizophrenia samples is significantly greater than those observed in the permuted samples (Additional file 3: Figure S8). Even though our statistical cutoff is moderate, considering that we are cor-recting for an extremely large number of (~ 25 million) in-dependent tests, the results from permutation analyses provide support that these sites represent schizophrenia-associated signals of differential DNA methylation. Indeed,
a
b
c
d
Fig. 3Gene expression signatures in NeuN+and OLIG2+nuclei.aHeatmap of cell type DEGs with covariates indicated.bCell deconvolution of
bulk RNA-seq data from the CommonMind Consortium and BrainSeq compared with NeuN+and OLIG2+(control samples). Y-axes show the
weighed proportion of cells that explain the expression of bulk RNA-seq.cGene set enrichment for cell type markers from single-nuclei RNA-seq. Enrichment analyses were performed using Fisher’s exact test. Odds ratios and FDRs (within parentheses) are shown.dCorrespondence between the expression change and methylation change in cell types. TheX-axis represents differential DNA methylation statistics for genes harboring DMRs in promoters. TheY-axis indicates the log2(fold change) of expression between the two cell types. The negative correlation supports the
well-established impact of promoter hypomethylation on the upregulation of gene expression (See figure on previous page.)
[image:6.595.59.540.466.652.2]quantile-quantile plots suggest that our data exhibit a modest but significant excess of goodPvalues (Fig.4a).
We also performed targeted experiments of 66 CpGs (16 szDMPs at FDR < 0.2 andNucleic Acids ResNucleic Acids Re 50 adjacent sites) through deep coverage
sequencing using 24 samples from the discovery cohort as well as an additional 20 new independent samples. This validation analysis achieved an average read depth coverage of > 14,500×. Technical replicates are highly correlated with the fractional methylation values obtained
Fig. 4Cell type DNA methylation patterns associated with schizophrenia.aDMPs associated with schizophrenia. Quantile-quantile plots of genome-widePvalues for differential methylation between schizophrenia and control based on NeuN+(left) and OLIG2+(right) WGBS data.bConcordance
between WGBS data and microarray-based data.Y-axis shows the ratio of sites showing the concordant direction in schizophrenia vs. control in our study at eachPvalue bin compared with the Jaffe et al. study [7] (X-axis). Concordance was tested using a binomial test (stars indicateP< 0.05). Boxplots correspond to the directional concordance in 100 sets of association results after case-control label permutations. NeuN+(left) and OLIG2+
(right).cszDMPs show altered cell type differences. Barplot shows the percentage of sites with larger cell type differences in controls than in schizophrenia and vice versa at different CpG classes. Absolute OLIG2+vs. NeuN+methylation differences are larger in controls than cases in szDMPs
compared to cell type DMPs and non-DMP or background CpGs. szDMPs were detected as differentially methylated between cases and controls at FDR < 0.2 in NeuN+(14 sites) and OLIG2+samples (83 sites). Top 1000 szDMPs were selected as the top 1000 loci according to bestPvalues in each
cell type (N= 2000). Cell type DMPs were detected by comparing OLIG2+vs. NeuN+methylomes at BonferroniP< 0.05. Background CpGs were
sampled from CpGs showing non-significantPvalues for both case-control and OLIG2+vs. NeuN+comparisons. Stars representPvalues for binomial
tests with all comparisons showingP< 10−7.dTop 1000 szDMPs are enriched for SZ GWAS signals. szDMPs identified in our methylation study in both
[image:7.595.58.541.161.516.2]from the WGBS (Spearman’s rho = 0.96, P< 10−15, Add-itional file 3: Figure S9), indicating the reliability of the fractional methylation estimates obtained in the discovery WGBS data. In addition, the WGBS data and validation data are highly consistent for case-control comparisons in both sign direction and correlation in effect size (Spear-man’s rho = 0.87, P< 10−16 and 81.25% sign
concord-ance, Additional file 3: Figure S10). These results
support the validity of szDMPs discovered in our study. There is no direct overlap between these DMPs (FDR < 0.2) and those previously identified from a microarray study [7]. However, despite the lack of direct overlap, the direction of methylation change between control and schizophrenia between the two studies is largely consistent
in the NeuN+, especially with increasing significance
(decreasing P values) (Fig. 4b). This pattern is highly significant compared to the permuted data (Fig. 4b). In
comparison, the OLIG2+ dataset does not exhibit such a
pattern (Fig. 4b), potentially because the bulk tissue
samples consisted largely of neurons. Deconvolution ana-lyses of transcriptomes using our cell-sorted population support this idea (Fig.3b).
Enrichment of szDMPs in cell type distinct sites imply cell type dysregulation
Remarkably, szDMPs (FDR < 0.2) are highly enriched in cell type-specific DMPs (OR = 4.1, P< 10−10, Fisher’s exact test). This enrichment persists when we examine a larger number of sites (Additional file 3: Figure S11), indicating that the enrichment is not due to the small number of szDMPs. Moreover, szDMPs (FDR < 0.2) show distinct directionality in the distinct brain cell types. Specifically, NeuN+ szDMPs (FRD < 0.2) show an excess of hypomethylation in schizophrenia samples compared to the control samples (93%, 13 out of 14,
P= 0.0018 by binomial test, Additional file3: Figure S8)
. An opposite pattern is observed for OLIG2+ szDMPs
(FDR < 0.2), where schizophrenia samples are mostly hypermethylated compared to the control samples (75.9%, 63 out of 83, P= 2.4 × 10⁻⁶ by a binomial test). In contrast, this bias is not observed in the permuted
data (NeuN+ empirical P= 0.07 and OLIG2+ empirical
P= 0.02, Additional file 3: Figure S8). Considering that
NeuN+ tend to be more hypermethylated compared to
OLIG2+(Fig.2b), we investigated whether disease patterns in schizophrenia contribute to reduced cell type difference in DNA methylation. Indeed, szDMPs consistently show decreased cell type methylation difference compared
to the control samples (Fig. 4c). In other words,
schizophrenia-associated modification of DNA me-thylation effectively diminishes cell type distinctive epigenetic profiles in our data.
These results also suggest that sites that did not pass the FDR cutoff but have been detected in the
differential methylation analyses may harbor meaning-ful candidates for future studies. Indeed, our power
study supports this idea (see the “Methods” section,
Additional file 3: Figure S7). Consequently, we further analyzed sites that are ranked top 1000 in the differ-ential DNA methylation analysis between the brains of control vs. those from patients with schizophrenia
(referred to as “top 1000” DMPs). We find that genes
harboring the top 1000 szDMPs show enrichment for brain-related functions and diseases, as well as tran-scription factors, particularly those involved in
chro-matin remodeling (Additional file 3: Figure S12).
Given that the majority of the schizophrenia herita-bility is found below the significance thresholds of
GWAS [4], we explored the association patterns at
genome-wide SNPs. Top 1000 szDMPs tend to co-localize with genetic variants associated with schizo-phrenia but not with other mental or non-mental traits, mostly with genetic variants below the strict GWAS significance threshold but with
moderate-to-high effect sizes (Fig. 4d). This result supports the
role of brain DNA methylation in the genetic etiology of schizophrenia.
Cell type expression differences associated with schizophrenia
Compared to subtle DNA methylation differences, gene expression shows good separation between
schizophre-nia and control (Fig. 5a), and diagnosis has a strong
effect on the variance compared to other covariates
(Fig. 5b). We identified 140 and 167 differentially
expressed genes between control and schizophrenia
(referred to as “szDEGs” henceforth) for NeuN+ and
OLIG2+, respectively, at FDR < 0.01 (Fig.5c; Additional file1:
Tables S8–S9; see the “Methods” section). We compared
our results to the previous results obtained from bulk tissues [5, 6] and identified common and distinct sets of differentially expressed genes across the datasets (Additional file 1: Tables S10–S11; see the “Methods” section). Comparing the effect sizes of commonly differen-tially expressed genes (P< 0.05) among the three datasets analyzed, we find significant correlations to the CMC and
BrainSeq datasets [5, 6] in NeuN+, but not when we
compare OLIG2+(Fig. 5d). These results are consistent with the aforementioned deconvolution analysis, in-dicating that bulk tissue brain studies were limited in terms of non-neuronal signals, such as those coming from oligodendrocytes.
Newly identified szDEGs are enriched for variants for specific disorders or cognitive traits (Fig. 5e; see the
“Methods”section). Notably, NeuN+szDEGs are enriched
a
b
d
e
f
c
Fig. 5Gene expression associated with schizophrenia in NeuN+and OLIG2+.aHeatmap of szDEGs for each cell type with covariates indicated.b
The first principal component of the DEGs was associated with diagnosis. Red dotted line corresponds toP= 0.05.cVolcano plot showing szDEGs.X -axis indicates the log2(fold change), andY-axis indicates log10(FDR). szDEGs (FDR < 0.01) are colored.dComparisons of differentially expressed genes in
schizophrenia from the current study with the BrainSeq and CMC data. We used genes that are classified as differentially expressed in all three datasets (each dot represents a gene, 63 genes are common to NeuN+, CMC, and BrainSeq, and 49 to OLIG2+, CMC, and BrainSeq). TheX-axes represent the
fold change between control and schizophrenia in CMC or BrainSeq datasets, and theY-axes represent the log2(fold change) between control and
schizophrenia in the current datasets, for either NeuN+-specific or OLIG2+-specific genes. Regression line and confidence interval are shown for each
comparison.eBarplot highlighting the enrichment for trait-associated genetic variants. Bars correspond to NeuN+(cyan) and OLIG2+(magenta)
szDEGs. Red dashed line corresponds to the FDR threshold of 0.05.X-axis shows the acronyms for the GWAS data utilized for this analysis (ADHD, attention deficit hyperactivity disorder;ASD, autism spectrum disorders;BIP, bipolar disorder;ALZ, Alzheimer’s disease;MDD, major depressive disorder;
SZ, schizophrenia;CognFun, cognitive function;EduAtt, educational attainment;Intelligence, intelligence;BMI, body mass index;CAD, coronary artery disease;DIAB, diabetes;HGT, height;OSTEO, osteoporosis).fEnrichment map for szDEGs (up-/downregulated) and the top 1000 szDMPs (X-axis shows genic annotation). Enrichment analyses were performed using Fisher’s exact test. Reported odds ratios and FDRs within parentheses for NeuN+(top)
[image:9.595.58.540.88.530.2]disorder and autism spectrum disorders (Fig. 5e), indi-cating potential cell type-specific relationship between genetic variants and disease-associated variation of gene expression.
Finally, we investigated the relationship between schizophrenia-associated differential DNA methylation and differential gene expression. Remarkably, similar to what we have observed in DNA methylation, szDEGs are preferentially found in genes that are significantly
diffe-rentially expressed between cell types for both NeuN+
(OR = 7.7, FDR = 8 × 10⁻⁸) and OLIG2+ (OR = 13, FDR = 7 × 10⁻¹³), furthering the functional implication of cell type-specific regulation in schizophrenia. Due to the small number of szDMPs identified at FDR < 0.2, there was little direct overlap between szDMPs and szDEGs. However, when we examined the top 1000 szDMPs, we begin to ob-serve significant enrichments of szDMPs in szDEGs (Fig. 5f ). Notably, the top 1000 szDMPs are enriched in genic (3′UTR and exon) and intergenic CpGs in NeuN+,
while OLIG2+ show specific enrichment for intronic
and promoter CpGs (Fig. 5f ) (Fisher’s exact test, all comparisons FDR < 0.05). These results underscore the promise of cell type-specific approaches to elucidate the relationships between genetic variants, epigenetic modifications, and gene expression in a complex neuro-psychiatric disorder.
Discussion
The etiology of schizophrenia remains largely unresolved even though significant efforts have gone into under-standing the genetic and molecular mechanisms of the disease [1]. These efforts have been challenged by both the genetic heterogeneity of the disorder as well as the inherent cellular heterogeneity of the brain. To address these issues, we integrated whole-genome sequencing, transcriptome, and epigenetic profiles from two major cell types in the brain. Whole-genome patterns of DNA methylation and gene expression are highly distinct be-tween cell types, complementing other analyses of cell type-specific epigenetic variation [9, 33]. In particular, our data offer novel resource from oligodendrocytes, a major yet relatively underexplored cell type in the human brains. Indeed, we show evidence that previous analyses of bulk tissue gene expression were under-powered to detect oligodendrocyte-specific signals, underscoring the strength of a cell-specific approach and the fact that most bulk tissue brain studies tend to focus on or specifically isolate gray matter.
A caveat to our study is that methylome and expression studies using human brain tissue could be confounded by the multitude of environmental factors that can impact these measurements such as the use of medications or other drugs, smoking, alcohol use, and other lifestyle factors. We provide such information for the subjects used
in this study in Additional file1: Table S1; however, these data are rarely quantitative and are frequently unknown for many individuals. We therefore compared CpGs
pre-viously associated with tobacco smoking [34–36] and
did not find a significant overlap with our identified
szDMPs (see the “Methods” section). This result
sug-gests that our data are likely not confounded by at least tobacco smoking.
To our knowledge, this is the first study to identify the cell-specific correspondence between whole-genome methylation and expression in brain tissue from patients with schizophrenia. Compared to substantial cell type differences, methylation differences between control and schizophrenia are small. Considering 20% false positives and coverage, we identified 97 szDMPs, compared to over 4 million cell type-specific DMPs identified at a
more stringent cutoff of Bonferroni P< 0.05.
further investigations into the contributions of oligoden-drocytes to schizophrenia are warranted.
A large portion of differential DNA methylation be-tween control and schizophrenia occur in non-coding regions. This observation further highlights the role of regulatory variation in disease etiology, similar to the findings from GWAS studies, especially the distribution of schizophrenia genetic risk loci [4, 39, 40]. Notably, the majority of sites that show signals of differential DNA methylation are not accessed by most DNA methylation arrays. Our study demonstrates that schizo-phrenia pathophysiology is unlikely to be further delin-eated via the study of differential methylation or expression in the brain given currently used technolo-gies. What we have found is that non-neuronal cells such as oligodendrocytes are just as likely to play a role in disease as neurons. Therefore, the use of emerging technologies to profile individual cells might be able to assess the contribution of even more cell types such as astrocytes or microglia. Moreover, for human brain sue studies of schizophrenia, we are limited to adult tis-sues whereas the critical windows of altered methylation and/or expression might be occurring earlier in the de-velopment prior to the onset of symptoms and diagnosis. Finally, the heterogeneity of schizophrenia might chal-lenge the interpretation of data from this sample size. Future studies that compare individuals based on spe-cific aspects of disease (e.g., presence of psychosis) might yield greater differences. Nevertheless, what our study has uncovered are a number of cell type changes in ex-pression and methylation that correspond to disease sta-tus. In particular, the oligodendrocyte changes are compelling as previous studies were underpowered to detect these changes. With these identified genes in hand, the importance of these specific genes in brain development and function can now be studied in cel-lular and animal models. These gene lists can also be
integrated with future whole-genome sequencing
studies.
Conclusions
We provide the first detailed interrogation of DNA methylation differences between neurons and oligoden-drocytes and between brain tissues from patients with schizophrenia compared to controls. These data demon-strate an extensive epigenetic distinction between two major cell types in the brain and that cell type-specific methylation is dysregulated in a specific way in the brains from patients with schizophrenia. These data can be used for prioritizing targets for further experimental analyses. With rapidly decreasing sequencing costs, candidates and hypotheses generated from our study should lead to future analyses at the individual cell level from specific populations of patients (e.g., patients with
psychosis or not) to further elucidate the biological alterations associated with schizophrenia.
Methods Sampling strategy
Frozen brain specimens from Brodmann area 46 were
obtained from several brain banks (Additional file 1:
Tables S1–S2). Cases and controls were matched by age
group, and additional demographics such as gender were
matched when possible (Additional file 1: Table S1).
Information on comorbidities and cause of death when known are included in Additional file1: Table S1.
Nuclei isolation from human postmortem brain
Nuclei isolation was performed as described previously [18,41] with some modifications. Approximately 700 mg of frozen postmortem brain was homogenized with lysis
buffer (0.32 M sucrose, 5 mM CaCl2, 3 mM Mg(Ac)2,
0.1 mM EDTA, 10 mM Tris-HCl pH 8.0, 0.1 mM PMSF, 0.1% (w/o) Triton X-100, 0.1% (w/o) NP-40, protease inhibitors (1:100) (#P8340, Sigma, St. Louis, MO), RNase inhibitors (1:200) (#AM2696, ThermoFisher, Waltham, MA)) using a Dounce homogenizer. Brain lysate was placed on a sucrose solution (1.8 M sucrose, 3 mM
Mg(Ac)2, 10 mM Tris-HCl pH 8.0) to create a
concen-tration gradient. After ultracentrifuge at 24,400 rpm for 2.5 h at 4 °C, the upper layer of the supernatant was collected as the cytoplasmic fraction. The pellet, which included the nuclei, was resuspended with ice-cold PBS containing RNase inhibitors and incubated with mouse alexa488 conjugated anti-NeuN (1:200) (#MAB377X, Millipore, Billerica, MA) and rabbit alexa555-conjugated anti-OLIG2 (1:75) (#AB9610-AF555, Millipore) antibodies with 0.5% BSA for 45 min at 4 °C. Immuno-labeled nuclei were collected as NeuN-positive or OLIG2-positive popu-lations by fluorescence-activated nuclei sorting (FANS). After sorting, gDNA and total RNA were purified from each nuclei population using a ZR-Duet DNA/RNA MiniPrep (Plus) kit (#D7003, Zymo Research, Irvine, CA) according to the manufacturer’s instruction. Total RNA was treated with DNase I after separation from gDNA. Two hundred nanograms total RNA from each sample was treated for ribosomal RNA removal using the Low Input RiboMinus Eukaryote System v2 (#A15027, Ther-moFisher) according to the manufacturer’s instruction. After these purification steps, gDNA and total RNA were quantified by Qubit dsDNA HS (#Q32851, ThermoFisher) and RNA HS assay (#Q32852, ThermoFisher) kits, re-spectively. Immunostaining was visualized using a Zeiss LSM 880 with Airyscan confocal laser scanning micro-scope. One hundred microliters of sorted nuclei was placed onto microscope slides, and 300μl of ProLong
ThermoFisher) was added and covered with glass cover-slips before imaging.
Whole-genome bisulfite sequencing library generation and data processing
As a control for bisulfite conversion, 10 ng of unmethy-lated lambda phage DNA (#D1501, Promega) was added
to the 1μg of input DNA. Libraries were made with an
in-house Illumina sequencer-compatible protocol. The extracted DNA was fragmented by S-series
Focused-ultrasonicator (Covaris, Woburn, MA) using the“200-bp
target peak size protocol.” Fragmented DNA was then
size selected (200–600 bp) with an Agencourt AMPure
XP bead-based (#A63880, Beckman Coulter, Brea, CA) size selection protocol [42]. The DNA end repair step was performed with End-It DNA End-Repair Kit (#ER81050, Epicentre, Madison, WI). After the end-repair step, A-tailing (#M0202, New England Biolabs, Ipswich, MA) and ligation steps were performed to ligate the methylated adaptors.
Bisulfite treatment of gDNA was performed using the MethylCode Bisulfite Conversion Kit (#MECOV50, Ther-moFisher). Purified gDNA was treated with CT conversion reagent in a thermocycler for 10 min at 98 °C, followed by 2.5 h at 640 °C. Bisulfite-treated DNA fragments remain single-stranded as they are no longer complementary.
Low-cycle (4–8) PCR amplification was performed with
Kapa HiFi Uracil Hotstart polymerase enzyme (#KK2801, KAPA Biosystems, Wilmington, MA) which can tolerate uracil residues. The final library fragments contain thy-mines and cytosines in place of the original unmethylated cytosine and methylated cytosines, respectively.
The methylome libraries were diluted and loaded onto an Illumina HiSeq 2500 or HiSeqX system for sequen-cing using 150 bp paired-end reads. We generated over 900 million reads per sample and performed quality and adapter trimming using TrimGalore v.0.4.1 (Babraham Institute) with default parameters. Reads were mapped first to the PhiX genome to remove the spike-in control, and the remaining reads were mapped to the human GRCh37 (build 37.3) reference genome using Bismark v 0.14.5 [43] and bowtie v1.1.2 [44]. We removed reads with exact start and end positions using Bismkar dedu-plication script. After de-dudedu-plication, we calculated the fractional methylation levels at individual cytosines [32]. Overall, we generated a total of 72.6 billion reads (equivalent to 10.9 T base pairs of raw sequence data) and obtained per-sample average coverage depths > 25× covering 98% of the 28 million CpGs in the human
genome (Additional file 1: Table S12). Bisulfite
con-version rates were estimated by mapping the reads to the lambda phage genome (NC_001416.1), see Additional file3: Figure S13 for a general overview of the WGBS data quality and processing.
Whole-genome sequencing data processing
Quality and adapter trimming was performed using TrimGalore v.0.4.1 (Babraham Institute) with default pa-rameters. Reads were mapped to the human GRCh37 reference genome using BWA v0.7.4 [45], and duplicates were removed using picard v2.8.3 (https://broadinstitute. github.io/picard/index.html). We identified genetic poly-morphisms from re-sequencing data following GATK v3.7 best practices workflow [46]. Specifically, we used HapMap 3.3, Omni 2.5 M, 1000 Genomes Phase I, and dbSNP 138 as training datasets for variant recalibration. We filtered variant calls with high genotype quality (GQ≥20.0). Overall, we generated a total of 225 million reads and identified 15,331,100 SNPs with mean depth above > 16.5× (Additional file1: Table S13). We removed the polymorphic cytosines from downstream differential methylation analyses keeping a total of 24,942,405
autosomal CpGs (Additional file 1: Table S14), see
Additional file 3: Figure S13 for a general overview of the WGS data quality and processing.
For quality control of the SNP calling, we performed principal component analyses using an additional 210 sam-ples from 4 different populations from the HapMap Project (60 CEU, 90 CBH/JPT, and 60 YRI) to explore the genetic ancestry of the individuals. After LD pruning (r2> 0.2) with SNPRelate R package, we used 66,667 autosomal polymorphic SNPs in the analysis. The PC plot shows that the reported ancestry of the individuals was mostly concordant to that inferred from the SNPs (Additional file 3: Figure S14), validating the genotype calling. The first 10 genetic PCs were included in the dif-ferential methylation analyses to control for population structure (Additional file1: Table S14).
Hierarchical clustering of methylomes from diverse human cell types
We added WGBS data from additional tissues [12] (see
original references for the datasets therein) and Lister et al. [27], and the corresponding genome coordinates (hg38 and hg18) were converted to hg19 using UCSC Batch Co-ordinate Conversion tool (liftOver executable) [47]. The
sample indicated with the star in Fig. 2a was also
re-mapped to hg38 from raw data following the same proto-col as other non-brain tissues (from Mendizabal and Yi [12]) and lifted over to hg19. The clustering of the two
methylomes from the same individual “NeuN+_ind2”
Identification of differentially methylated positions and regions between OLIG2+and NeuN+
We identified DMPs between 25 NeuN+ and 20 OLIG2+
individuals by using DSS [29]. DSS handles variance
across biological replicates as well as model read counts from WGBS experiments. Importantly, DSS also con-siders other biological covariates that may affect DNA methylation patterns. Specifically, we considered age, gender, brain hemisphere, postmortem interval (PMI), conversion rates, brain bank, and genetic ancestry (using the first 10 genetic PCs obtained from WGS of the same individuals) as covariates (Additional file 1: Tables S1–S2
and S14; Additional file 3: Figure S15). Age and PMI
were converted to categorical variables (“AgeClass”
and “PMIClass” in Additional file 1: Table S2).
Since C>T and G>A polymorphisms at CpGs could generate spurious differentially methylated sites on bisul-fite conversion experiments, we excluded polymorphic CpGs (identified from re-sequencing the same panel of
individuals, Additional file 1: Table S15) from DMP
analyses. For DMP identification between OLIG2+ and
NeuN+samples, we used a Bonferroni cutoff onP< 0.05 and identified 4,058,898 DMPs out of 24,596,850 CpGs tested. For DMR identification, we considered a mini-mum region of 50 bp with at least 5 significant DMPs and identified 145,073 regions (Additional file2: Table S3). We explored the effect of coverage on cell type DMP iden-tification and found that low-coverage sites had a limited contribution to the significant DMPs; indeed, relatively more sites were detected at more stringent coverage thresholds. For example, removing sites < 5× in 80% of individuals within each cell type led to a total of 4,037,979 significant DMPs at Bonferroni 0.05 cutoff (out of 23,788, 847 CpGs, 16.97%), whereas the removal of sites < 10× lead to 3,903,652 DMPs (out of 21,399,153 CpGs tested, 18.2%), and < 20× lead to 2,509,489 DMPs (out of 10,960,268 CpGs considered, 23.8%). Enrichments between cell type DMPs and szDMP and between cell type DMPs and ChIP-seq peaks were similar when using the > 20× coverage datasets instead of using all sites.
Of note, as our differential methylation analyses are run under a multifactor design in DSS, the estimated coefficients in the regression are based on a genera-lized linear model framework using arcsine link func-tion to reduce the dependence of variance on the fractional methylation levels [29, 48]. Thus, whereas the direction of change is indicated by the sign of the test statistic, its values cannot be interpreted directly as fractional methylation level differences. The distri-bution of the statistic depends on the differences in methylation levels and biological variations, as well as technical factors such as coverage depth. For DMRs,
the method provides “areaStat” values which are
defined as the sum of the test statistic of all CpG
sites within the DMR. To obtain a more interpretable estimate of fractional methylation differences, we also provide results for a linear model using the same formula as for DSS.
Functional characterization of DMRs
For different enrichment analyses, we generated matched control regions. We generated 100 sets of regions with similar genomic properties as the DMRs: number of total regions, region length distribution, chromosome, and
matched GC content within 1%. EmpiricalP values were
computed by counting the number of matched control sets showing values as extreme as the observed one. Enrichments were computed as the ratio between the observed value and the mean of the matched control sets. We used ChIPSeeker [49] and bioconductor’s UCSC gene annotation library TxDb.Hsapiens.UCSC.hg19.knownGene to annotate DMRs to genes. We explored the 25 chro-matin state model maps based on ChIP-Seq experi-ments on 6 chromatin marks (H3K4me3, H3K4me1, H3K36me3, H3K27me3, H3K9me3, and H3K27ac) from the Roadmap Epigenomics Project [28]. We joined several categories related to enhancer states, including TxReg,
TxEnh5’, TxEnh3’, TxEnhW, EnhA1, EnhA2, EnhW1,
EnhW2, and EnhAc.
Overlap with neuronal and non-neuronal ChIP-seq datasets
We analyzed the overlap between our cell type-specific DMPs and DMRs with neuron and non-neuron histone mark data on H3K4me3 and H3k27ac ChIP-seq experi-ments [9]. We only considered peaks that were assigned as “neuronal” and “non-neuronal” and discarded “NS” peaks from Additional file1: Table S11 in the cited paper. To test directionality with our OLIG2+ vs. NeuN+ diffe-rentially methylated sites, we further discarded peaks that overlapped between cell types (i.e., neuronal H3K4me3 peaks overlapping with non-neuronal H3K27ac, and non-neuronal H3K4me3 peaks overlapping with neuronal H3K27ac peaks).
Non-CpG methylation patterns in brain cell types
We studied DNA methylation patterns of NeuN+ and
OLIG2+ outside CpG dinucleotides (CH context). Given
the low fractional patterns of DNA methylation outside CpG sites, and to minimize the influence of any add-itional covariates, only individuals with conversion rates
≥0.995 were considered (15 NeuN+ and 14 OLIG2+).
We filtered cytosines that showed less than 5× coverage in 90% of individuals per cell type, as well as removed the positions with genetic polymorphisms (C>T and T>C SNPs to account for SNPs at both strands). A total
and OLIG2+, respectively. Cytosines in gene bodies were filtered using BEDtools [50].
Identification of DMPs between schizophrenia and control individuals
We used DSS to identify DMPs between schizophrenia and control samples. Again, we considered biological covariates in the differential methylation analyses, namely age, gender, brain hemisphere, PMI, conversion rates, brain bank, and genetic ancestry (using the first 10 genetic PCs obtained from WGS of the same individuals, see File S3 for specific commands used). For an FDR cutoff of 0.2 for significance, we identified a total of 201
and 60 DMPs in OLIG2+ and NeuN+, respectively. We
further filtered sites with less than 20× in at < 80% of individuals per group. We identified 14 and 83
signi-ficant DMPs in NeuN+ and OLIG2+, respectively, when
applying a FDR < 0.2.
As a comparison, we also ran differential methylation analyses for disease using a linear model based on frac-tional methylation values for every CpGs site and con-sidered the same covariates as in the DSS analyses. We plotted quantile-quantile plots for the expected and
observed P values obtained from DSS and linear model
analyses between schizophrenia and control, as well as to evaluate how coverage affects these two methods. We observed that DSS provides correction for low-coverage sites, note the systematic depletion of good P values at low-coverage sites in DSS (Additional file 3: Figure S16), compared to high-coverage sites. In contrast, a linear model shows a similar genome-wide distribution of
P values at low- and high-coverage sites. We
identi-fied a total of 60 and 210 CpGs in NeuN+ and OLIG2+,
respectively, at FDR < 0.2. However, to obtain a more conservative set of hits, we additionally filter for high-coverage sites (20× in at least 80% of samples per disease-control group) and recalculated FDR, obtaining 14 and 83 significant sites at FDR < 0.2. In order to test the robust-ness of the results and the effect of covariates as well as the potential hidden structures in the data, we performed a permuting analysis by randomly assigning case/control labels and re-ran DSS 100 times.
Power analyses for DMP identification between schizophrenia and control individuals
In this first power analysis, we determined the range of
effect sizes that can be detected at different P value
thresholds in our genome-wide scan focused on detect-ing individual DMPs. The main aim of this analysis was to determine the power of our study to detect individual DMPs at different significance thresholds, using realistic parameters that mimic the fractional methylation values seen in cases and controls. Specifically, we simulated 10 million CpGs following these steps:
1- In the first step, for each simulated CpG, we sample the parametric mean of fractional methylation values in controls from a truncated normal distribution (mirroring the skew in genome-wide fractional methylation values): rtnorm(simula-tions,0.7,0.05, lower = 0.1,upper = 0.9)
2- We next obtain the parametric standard deviation (SD) of fractional methylation values for the CpG in controls (by sampling from a uniform distribution that mimics the genome-wide distribution of SD seen in our data): runif(simulations,0.0000001,0.2) 3- After having determined the parametric mean and
SD in controls, we used these to obtain the fractional methylation values in as many simulated control individuals as we used in our study (n= 25 as in the NeuN analysis).
rtnorm(control.sample.size, control.mean, control.sd, lower = 0,upper = 1)
4- We next select a case-control difference value (effect size, or parametricβ) at each simulated CpG by drawing values from a uniform distribution. runif(simulations,0,0.20).
5- After obtaining the effect size at each simulated CpG, the mean fractional methylation value in cases can be obtained by adding the case-control difference (from step 4) to the control mean methy-lation values (step 3). Then, we sample the number of cases from a truncated normal distribution using the mean of cases and the standard deviation for cases (same as for controls, as we do not observe differences in SD in the real data between the groups).
6- rtnorm(case.sample.size, case.mean, case.sd, lower = 0,upper = 1)
7- We perform a linear regression of case/control labels on methylation. lm(methylation~diagnosis)
Additional file3: Figure S7a shows the heatmap of the average power for the full grid of parameters used to simulate the 10 million DMPs (CpGs that present diffe-rential methylation between the simulated cases and controls). The population effect sizes (absolute
case-control differences) and the P value achieved at each
simulated DMP are shown in the X-axis and Y-axis,
respectively.
certainly possible given the polygenic nature of schizo-phrenia observed in most omics datasets [5, 39]. There-fore, an apparently low positive power (10 to 20%) may still imply that hundreds of genome-wide real effects achieve approximatelyP< 10−5in our study.
The second implication of this analysis carries a more positive message in regard to the power of a genome-wide with the sample size from our study. Specifically, starting from 5% differences in average, a large fraction (about a third) of simulated DMPs pass a significance threshold of
P< 10–5, and ~ 50% of those with effects > 8% achieve
P< 10−5 and deeper significance thresholds. Notably, these are precisely the range of effects that we report
at the P value cutoffs that correspond to the FDR
20% we use in our study (P values ranging from
3.6 × 10⁻⁷ to 8.54 × 10⁻⁹ in NeuN+ and 1.36 × 10⁻⁶ to 8.18 × 10⁻¹⁴ in OLIG2+), being the effect size around
6.4% in average (ranging from 3.3 to 12.8% in NeuN+
and from 1.12 to 22.4% in OLIG2+).
As mentioned above, the balance between true and false positives at differentPvalue thresholds depends on the underlying (and currently unknown) distribution of effect sizes of DMPs and the total number of them that are present genome-wide. For this reason, in our genome-wide scan, we favored a strict control of mul-tiple testing to avoid the detection of false effects. Still, akin to the first generation of GWAS and as shown by the robust departure from the random expectation shown by the quantile-quantile plots, we report in Fig. 2a a large fraction of our top signals are likely true positives.
We would like to note here that previously obtained effect sizes for schizophrenia-associated CpGs in brain samples were generally small, for instance, around 1.48% (ranging from 0.41 to 4.42%, in Jaffe et al. [7]). However, these estimates correspond to the analyses based on methylation profiling of bulk tissue and focusing on a more limited set of the CpGs available genome-wide (~ 0.4 million CpGs). If schizophrenia-associated CpG sites showed cell type-specific patterns and/or were located outside the targeted CpGs in methylation array chips, these effect sizes could be underestimates of the actual case/control differences. Thus, unbiased whole-genome scanning of 25 million CpGs in purified cell types could potentially identify bigger case/control differences, and the sample sizes we present in this study would be mod-erately empowered.
In summary, this first power simulation study suggests that even with our small sample sizes, we can detect CpGs with moderate-to-large effect sizes. Although less powered to detect the bulk of small effects (~ 0.01 diffe-rences), this should not offset the inherent interest of a first genome-wide study that spans millions of CpGs in purified cell types, since we are powered to detect effects that would not be detected in previous case-control
attempts for schizophrenia. Importantly, most of these sites appear in regions currently not included in widely used methylation arrays.
In the second power analysis, we explored realistic parameters in regard to the total number of differentially methylated DMPs and the true distribution of effect sizes between cases and controls, in order to make robust inferences into the lists of DMPs and effect sizes that would make it into the top 1000 list of most signi-ficant effects. To obtain estimates of the true- and false-positive rates in the top 1000 szDMPs, we first need to obtain plausible genetic architectures of methylation differences in schizophrenia (i.e., the total number of real DMPs, and their effect sizes). According to genome-wide association studies, schizophrenia is a polygenic disease in which each variant exerts a small effect on the
phenotype [39]. Thus, we assumed in our analyses that
the epigenetic architecture for schizophrenia follows a similar pattern.
Specifically, we modeled the real distribution of effect sizes in our simulations using a beta distribution that permits to assign values between 0 and 1. This proba-bility distribution is parameterized by two shape para-meters, denoted asαandβ(also referred to as parameters 1 and 2 here). Assuming 5000 DMPs (CpGs with differen-tial methylation between schizophrenia cases and healthy controls), we explored a range of effect size distributions obtained by the two parameters. Specifically, we explored [0.1,1.5] and [20,51] for each parameter, as these are the ranges that give long-tailed distributions of effect sizes with a peak at 0.01 to 0.1 and a maximum DMP effect of ~ 0.4 (40%).
In each simulation (n= 50,000), after obtaining the dis-tribution of effect sizes of the 5000 causal DMPs, we performed a genome-wide scan with all 10 million CpG
(P values of non-causal CpGs are obtained from a
uni-form distribution [0,1]). We then ranked the 10 million
sites per P value and checked how many of the causal
CpGs make it in the top 1000 values. As shown in
Additional file 3: Figure S7b, we found the area that
yielded 0.5 of FDR at the top 1000 szDMPs, as we ob-serve in our data.
Using the range of parameter 1 and parameter 2 values that give FDRs around 50% (the green band in
Additional file 3: Figure S7b), we then asked which
case-control differences and P values are observed at
the true szDMPs found at the top 1000 loci. As
shown in the histogram plot in Additional file 3:
Fig-ure S7c, we find that the effect sizes of true szDMPs
are indeed substantial. Of note, the best 1000 P
values in the szDMPs per cell type observed in our study show an average of 4.85% case/control
differ-ence at the following P value thresholds: 7.31 × 10⁻⁵
In summary, this second simulation study shows that even though the top 1000 CpGs certainly contain a frac-tion of false positives (~ 50% as measured by the FDR corresponding to the 1000th CpG in our study), the other ~ 50% of CpGs consist of true positives enriched for moderate-to-large effect sizes. This enrichment justi-fies using this relaxed set of loci to obtain some bio-logical insights given the restricted loci with FDR < 0.2.
szDMP gene annotation and functional enrichment
We used ChIPSeeker [49] and bioconductor’s UCSC gene annotation library TxDb.Hsapiens.UCSC.hg19.knownGene to annotate the top 1000 szDMPs to genes (ordered
by P values). We used genes associated with genic
szDMPs only (all annotation categories excluding dis-tal intergenic, defined as > 1.5 kb from the start or end of genes) for functional enrichment using Topp-Gene [52]. We also explored the potential of szDMPs to bind transcription factors by intersecting the top 1000 szDMPs (ordered byPvalue) from each cell type with the ENCODE transcription factor ChIP-Seq datasets. We
downloaded the “wgEncodeRegTfbsClusteredV3” table
from UCSC and counted the number of szDMPs showing TF binding. We compared these numbers to 100 sets of
random 1000 CpGs with largePvalues for
schizophrenia-control comparison (P> 0.1). We also calculated the enrichment of specific transcription factors by comparing the frequency of each of the 161 transcription factors be-tween szDMPs and non-szDMPs. The enrichments were obtained by dividing the observed number to the average
of 100 sets, and the P values show the number of times
the number for szDMPs was larger than the 100 sets.
szDMP enrichment at GWAS
Genome-wide P values and odds ratios for GWAS for
schizophrenia [4], smoking [53], clozapine-induced agran-ulocytosis [54], coronary artery disease, bipolar disorder [51], autism spectrum disorder, and anorexia nervosa were downloaded from the Psychiatric Genomics Consortium at https://www.med.unc.edu/pgc/results-and-downloads/. Data for rheumatoid arthritis [55] were downloaded from ftp://ftp.broadinstitute.org/pub/rheumatoid_arthritis/ Stahl_etal_2010NG/. In order to explore the potential contribution and/or mediation of DNA methylation to the genetic basis of schizophrenia, we explored the co-localization of the top 1000 szDMPs with GWAS results. Given that the majority of the schizophrenia heritability is found below the significance thresholds of GWAS, we ex-plored the patterns at genome-wide SNPs as follows. For each szDMP, we identified all SNPs reported by the GWAS study within a 1-kb window and counted the number of SNPs at different quantiles of odds ratio (OR). We used quantiles of OR so that we can compare the dif-ferent diseases and traits among them. We repeated this
step using the same number of random non-szDMPs 100
times. To obtain empirical P values, we calculated the
number of times non-szDMP sets showed more SNPs in each OR quantile than szDMPs. SNPs with moderate-to-high OR in schizophrenia GWAS consistently
showed low empiricalPvalues for both cell type DMPs,
implying that SNPs with large effect sizes in GWAS stud-ies are closer to szDMPs than expected. Interestingly, this pattern was not observed for other traits, implying the co-localization is exclusive to the disease.
Hydroxymethylation at szDMPs
We compared our results to a single-base resolution hydroxymethylome maps [56]. Specifically, TAB-seq data from an adult human brain sample was obtained from GEO (GSE46710). We used the sites presenting high hmC as defined in the original paper (hmC > mC; n= 5, 692,354). We plotted quantile-quantile plots of DSS
statistic P values at high hmC loci and random loci.
These analyses showed no significant presence of hmC in the szDMPs (Additional file3: Figure S17).
Smoking DMPs at szDMP
We explored the co-localization of szDMPs with CpGs
associated with tobacco smoking [34–36]. None of the
analyzed smoking DMPs (n= 206) was found among our
szDMPs at FDR < 0.2 nor at the top 1000 CpGs with best P values per cell type. These analyses suggest that szDMPs might not be confounded by smoking.
Targeted validation experiments
We designed high-coverage bisulfite experiments to sequence 18 regions (Additional file 1: Table S16) from 44 samples (including 24 new individuals not included in the WGBS experiments, Additional file 1: Table S17). We conducted bisulfite conversions of gDNA from
OLIG2+ and NeuN+ cells using EZ DNA
The libraries were barcoded with a unique pair of Nextera XT primers. The libraries were sequenced with Illumina MiSeq using the 500-cycle kit (250 paired-end sequen-cing). We sequenced the samples at high coverage using a MiSeq machine and 250 bp paired-end reads at the Georgia Institute of Technology High Throughput DNA Sequencing Core. We mapped the reads to the human GRCh37 (build 37.3) reference genome using Bismark v0.20.2 and Bowtie v2.3.4. We trimmed the reads for low quality and adapters using TrimGalore v.0.5.0 (Babraham Institute) with default parameters. Only the sites with at least 200× coverage were considered (mean = 14,580, median = 10,810). One region showed low read counts and was excluded (Additional file1: Table S16). A total of 16 DMPs and an additional 50 adjacent CpGs were con-sidered in the validation analyses. Fractional methylation values were adjusted for covariates using the following linear model: lm (methylation ~ diagnosis + sex + age_ class + PMI_class).
Concordance with previous methylation studies on schizophrenia
We evaluated the concordance between our disease DMP signals with Jaffe et al. [7] which used bulk brain tissue and Illumina 450 K chips. We binned Jaffe et al. study’s
whole-genome P values and calculated the fraction of
CpGs in our study showing the same directionality in both studies (i.e., hypomethylated or hypermethylated in dis-ease vs. control). For each cell type, we tested the sig-nificance at each P value bin using a Binomial test with
P= 0.5 expectation. We additionally compared the
dis-tribution of concordance rates from the 100 control datasets obtained using case/control permuted labels and re-running DSS on them.
RNA sequencing
RNA-seq was performed as described previously [57].
Total RNA from the cytoplasmic fraction was extracted with the miRNeasy Mini kit (#217004, Qiagen, Hilden,
Germany) according to the manufacturer’s instruction.
The RNA integrity number (RIN) of total RNA was quantified by Agilent 2100 Bioanalyzer using Agilent RNA 6000 Nano Kit (#5067-1511, Agilent, Santa Clara, CA). Total RNAs with an average RIN value of 7.5 ± 0.16 were used for RNA-seq library preparation. Fifty nanograms of total RNA after rRNA removal was sub-jected to fragmentation, first and second strand synthe-ses, and clean up by EpiNext beads (#P1063, EpiGentek, Farmingdale, NY). Second-strand cDNA was adenylated, ligated, and cleaned up twice by EpiNext beads. cDNA libraries were amplified by PCR and cleaned up twice by EpiNext beads. cDNA library quality was quantified by a 2100 Bioanalyzer using an Agilent High Sensitivity DNA Kit (#5067-4626, Agilent). Barcoded libraries were
pooled and underwent 75 bp single-end sequencing on an Illumina NextSeq 500.
RNA-seq mapping, QC, and expression quantification
Reads were aligned to the human hg19 (GRCh37) reference genome using STAR 2.5.2b [58] with the following
parame-ters: --outFilterMultimapNmax 10 --alignSJoverhangMin
10 --alignSJDBoverhangMin 1 --outFilterMismatchNmax 3 --twopassMode Basic. Ensemble annotation for hg19 (version GRCh37.87) was used as a reference to build STAR indexes and alignment annotation. For each sample, a BAM file including mapped and unmapped reads with spanning splice junctions was produced. Secondary align-ment and multi-mapped reads were further removed using in-house scripts. Only uniquely mapped reads were retained for further analyses. Quality control metrics were performed using RseqQC using the hg19 gene model pro-vided [59]. These steps include: number of reads after multiple-step filtering, ribosomal RNA reads depletion, and defining reads mapped to exons, UTRs, and intronic regions. Picard tool was implemented to refine the QC metrics (http://broadinstitute.github.io/picard/). Gene-level expression was calculated using HTseq version 0.9.1 using
intersection-strict mode by exons [60]. Counts were
calculated based on protein-coding gene annotation from the Ensemble GRCh37.87 annotation file, see
quality control metrics in Additional file 3: Figures
S18–S19 and Additional file 1: Table S18.
Covariate adjustment and differential expression
Counts were normalized using counts per million reads (CPM). Genes with no reads in either schizophrenia (SZ) or control (CTL) samples were removed. Normalized data were assessed for effects from known biological co-variates (diagnosis, age, gender, hemisphere), technical variables related to sample processing (RIN, brain bank, PMI), and technical variables related to surrogate vari-ation (SV) (Additional file3: Figure S20). SVs were cal-culated using SVA [61] based on “be” method with 100 iterations. The data were adjusted for technical covari-ates using a linear model:
lmðgene expressionageclassþgenderþhemisphere þPMIClassþRINþBrainBankþnSVsÞ
Adjusted CPM values were used for co-expression analysis and visualization. For differential expression, we used the lmTest (“robust”) and ebayes functions in the limma [62] fitting all of the statistical models to estimate log2fold changes,P values, and FDR/Bonferroni
correc-tion. This method was used for (1) cell type differences (|log2(fold change)| > 0.5 and Bonferroni FDR < 0.05), (2)
FDR < 0.01), and (3) OLIG2+SZ-CTL analysis (|log2(fold
change)| > 0.3 and FDR < 0.01). Bonferroni was used in 1 to provide higher stringency on the data analysis.
Cross-validation
Cross-validation analyses were applied to ensure the ro-bustness of the DEG analysis:
1) Permutation method based on gene expression randomization (nPerm = 200).
2) Leave-one-out method based on subsampling the data (nLOO = 200).
Functional gene annotation
The functional annotation of differentially expressed and co-expressed genes was performed using ToppGene [52]. A Benjamini-Hochberg FDR (P< 0.05) was applied as a multiple comparisons adjustment.
GWAS data and enrichment
We manually compiled a set of GWAS studies for several neuropsychiatric disorders, cognitive traits, and non-brain disorders/traits. Summary statistics from the genetic data were downloaded from Psychiatric Genomics Consortium (http://www.med.unc.edu/pgc/results-and-downloads)
and GIANT consortium (https://portals.broadinstitute.
org/collaboration/giant/). Gene-level analysis was
per-formed using MAGMA [63] v1.04, which considers
linkage disequilibrium between SNPs. 1000 Genomes (EU) dataset was used as a reference for linkage dis-equilibrium. SNP annotation was based on the hg19 gen-ome annotation (gencode.v19.annotation.gtf). MAGMA statistics and–log10(FDR) are reported in Additional file1: Table S19 for each of the GWAS data analyzed. Brain
GWAS: ADHD, attention deficit hyperactivity disorder
[64]; ASD, autism spectrum disorders ( https://www.bior-xiv.org/content/early/2017/11/27/224774); BIP, bipolar disorder [65];ALZ, Alzheimer’s disease [66];MDD, major depressive disorder [67]; SZ, schizophrenia [4, 65]. Cognitive traits GWAS: CognFun = cognitive function [64], EduAtt = educational attainment [68], Intelligence =
intelligence [69]. Non-brain GWAS: BMI, body mass
index [70]; CAD, coronary artery disease [71]; DIAB, diabetes [72]; HGT, height ( https://www.biorxiv.org/con-tent/early/2018/07/09/355057);OSTEO, osteoporosis [73].
Cell type enrichment and deconvolution analyses
MTG single-nuclei RNA-seq was downloaded from Allen
Brain Institute web portal [74]. Normalized data and
cluster annotation were used to define cell markers using FindAllMarkers in Seurat [75] with the following parame-ters: logfc.threshold = 0.25, test.use =“wilcox”, min.pct = 0.25, only.pos = TRUE, return.thresh = 0.01, min.cells.-gene = 3, and min.cells.group = 3. Enrichment analyses
were performed using Fisher’s exact test. Cell type
de-convolution was performed using MuSiC [76] with
the following parameters: iter.max = 1000, nu = 1e-10, eps = 0.01, and normalize = F.
Public data analyses
GTEx tissue expression was downloaded from the GTEx
web portal. Raw data was normalized using log2(CPM +
1) [77]. Gene expression data from SZ and healthy CTL
brain tissue was downloaded from the Common Mind
Consortium [5]. Gene expression data from SZ and
healthy CTL developmental brain tissue was
down-loaded from Brain Phase1 [6]. We applied differential
expression analysis using the lmTest (“robust”) and
ebayes functions in the limma [62] fitting all of the
technical/biological covariates and surrogate variables
to estimate log2 fold changes, P values, and FDR/
Bonferroni correction. Surrogate variables were calculated with SVA package [61].
Additional files
Additional file 1:Supplementary Tables S1, S2, S4–S19. (XLSX 3715 kb)
Additional file 2:Supplementary Table S3. (XLSX 18753 kb)
Additional file 3:Supplementary Figures S1–S20. (PDF 1643 kb)
Acknowledgements
We thank the donors and their families for the tissue samples used in these studies. We also thank Angela Mobley of the Flow Cytometry Facility, Vanessa Schmid of the Next Generation Sequencing Core of UT Southwestern Medical Center, and Anton Bryksin and Naima Djeddar of the Molecular Evolution Core and Dalia Arafat of the Genome Analysis Core at Georgia Tech for the technical support.
Authors’contributions
IM, SB, GK, and SVY analyzed the data and wrote the paper. NU and KT designed, optimized, and performed the nuclei isolations, nuclei sorting, gDNA and RNA preparations, and RNA-seq. CD performed the additional cell sorting and gDNA extraction. PC performed the WGS and WGBS. TL performed the validation experiments. IM analyzed the WGBS and WGS data. SB analyzed the RNA-seq data. IH constructed the linear mixed effect models and provided statistical guidance. HJ analyzed the validation and hydroxymethylation datasets. CT provided human postmortem brain tissue. TMP, GK, and SVY designed and supervised the study and provided intellectual guidance. All authors discussed the results and commented on the manuscript. All authors read and approved the final manuscript.
Funding