M E T H O D
Open Access
CIDANE: comprehensive isoform
discovery and abundance estimation
Stefan Canzar
1,4†*, Sandro Andreotti
2†, David Weese
2, Knut Reinert
2and Gunnar W. Klau
3Abstract
We present CIDANE, a novel framework for genome-based transcript reconstruction and quantification from RNA-seq reads. CIDANE assembles transcripts efficiently with significantly higher sensitivity and precision than existing tools. Its algorithmic core not only reconstructs transcripts ab initio, but also allows the use of the growing annotation of known splice sites, transcription start and end sites, or full-length transcripts, which are available for most model organisms. CIDANE supports the integrated analysis of RNA-seq and additional gene-boundary data and recovers splice junctions that are invisible to other methods. CIDANE is available at http://ccb.jhu.edu/software/cidane/.
Background
High-throughput sequencing of cellular RNA (RNA-seq) aims at identifying and quantifying the set of all RNA molecules, the transcriptome, produced by a cell. Despite having largely identical genomes, the RNA content of cells differs among tissues, developmental stages, and between disease and normal condition. For eukaryotes, differences are determined by the set of genes being expressed, but also by the different mRNA isoforms each gene may pro-duce; alternative splicing, alternative transcription and polyadenylation define and combine exons in distinct ways.
RNA-seq technology can generate hundreds of millions of short (50–250 bp) strings of bases, called reads, from expressed transcripts at a fraction of the time and cost required by conventional Sanger sequencing. The wealth of RNA-seq data produced recently has revealed novel isoforms [1–3] and new classes of RNA [4], allowed a better characterization of cancer transcriptomes [5, 6], and led to the discovery of splicing aberrations in disease [7, 8].
*Correspondence: canzar@ttic.edu
Knut Reinert and Gunnar W. Klau are shared last authors. †Equal contributors
1Center for Computational Biology, McKusick-Nathans Institute of Genetic Medicine, Johns Hopkins University School of Medicine, Baltimore, MD 21205, USA
4Toyota Technological Institute at Chicago, 6045 S. Kennwood Avenue, IL 60637, Chicago, USA
Full list of author information is available at the end of the article
However, the step from sequencing to profiling the cel-lular transcriptome involves solving a high-dimensional complex puzzle, which poses major challenges to bioin-formatics tools as every single short read carries little information by itself. In particular, repeat and paralogous sequences, as well as low-expressed regions and minor isoforms, are difficult to assemble. Notice that transcripts that are moderately expressed only in a subpopulation of cells manifest an overall low expression level, as might be the case for long noncoding RNAs (lncRNAs) [4].
Unlike de novo transcript assembly approaches, which assemble reads solely based on the overlap of their sequences, genome-based methods employ a high-quality reference genome to resolve better ambiguities imposed by highly similar regions of the genome and to recover lower expressed transcripts. Genome-based methods first align reads to the genome to determine where each of the reads originated and then assemble the alignments into transcript models. This in turn introduces a critical dependence on the accuracy of the read alignment, which is affected by sequencing errors, polymorphisms, splic-ing, and ambiguous reads that belong to repeats. Reads spanning splice junctions between exons are particularly informative since they provide an explicit signal for the detection of splice donor and acceptor sites. At the same time, the spliced alignment of such reads is computation-ally challenging and error prone.
For an unbalanced split, the prefix or suffix of a read that spans one of the two consecutive exons may be short and thus aligns equally well to a large number of
genomic positions. Guessing the true origin can be fur-ther hampered by polymorphisms near the splice site. Besidesincorrectspliced alignments, this can also lead to missedsplice junctions, i.e., exon–exon junctions that are not supported (covered) by any spliced alignment. Missed junctions can also result from read coverage fluctuations (biases) or a generally low transcript abundance. While some of the existing methods do take into account incor-rect alignments by applying ad hoc filters (Scripture [9] and CLIIQ [10]) or by not requiring the isoform selection model to explain all input alignments (MITIE [11]), none of the existing approaches is able to deal with missed junc-tions. In this work we present a novel framework CIDANE (comprehensive isoform discovery and abundance esti-mation), which, for the first time, allows us to recover isoforms with uncovered splice junctions that are invisible to all existing approaches.
On a high level, existing methods for genome-based transcript assembly adhere to the following scheme: First, a set of candidate isoforms is defined as paths in a graph representing the base or exon connectivity as indicated by the aligned reads. Then, asmallsubset of isoforms is selected that explains the read alignmentswell. Since only a small number of transcripts is typically expressed in a given cell type (compared to the number of candidates), the restriction to few isoforms prevents fitting noise in the data.
Current methods mostly differ in the trade-offs they apply between the complexity of the model and the tractability of the resulting optimization problem, which largely determines the quality of the prediction:
1. Since the number of potential isoforms grows exponentially with the number of exons of the locus, all existing methods restrict either implicitly or explicitly the number of candidates they consider. Methods that do not enumerate isoforms explicitly either employ a simplified model with transcript-independent coefficients (e.g., MITIE and Traph [12]) or separate the intrinsically interdependent minimality and accuracy objectives (Cufflinks [2]). 2. A second crucial algorithmic design decision is how
tobalance the two concurrent objectives. In an extreme case, the two objectives are treated independently (e.g., Cufflinks, CLASS [13], CLIIQ, Traph, and IsoInfer [14]). More recent
state-of-the-art methods (e.g., MITIE, iReckon [15], SLIDE [16], IsoLasso [17], and StringTie [18]) have recognized the importance of optimizing both objectives simultaneously and balance minimality and accuracy heuristically.
3. Among methods that simultaneously optimize for both objectives, the measure of minimality has an enormous impact on the tractability of the resulting
problem. The most immediate measure, the number of predicted transcripts (L0norm), leads to
non-convex objectives and a computationally intractable optimization problem. Methods like MITIE, StringTie, Montebello [19], and iReckon, which employs a novel non-convex minimality measure, therefore resort to a forward stepwise regression strategy, a Monte Carlo simulation, or numerical optimization combined with random restarts, that generally do not find the best solution in this model. Methods like SLIDE and IsoLasso thus replace theL0norm by the convexL1norm, i.e., the sum of transcript abundances.
4. Concerning the measure of accuracy, methods apply a least-squares loss function (e.g., IsoLasso, SLIDE, or TRAPH), least absolute deviation (not explicitly modeled in StringTie), or compute more generally a maximum likelihood assignment of reads to candidate isoforms. The latter typically requires a preselection of transcripts (Cufflinks) or leads to the intractability of the resulting problem (iReckon and Montebello).
demand, i.e., if they help to strictly improve the overall prediction.
[image:3.595.58.542.588.650.2]CIDANE implements a design that separates the assem-bly of full-length transcripts from the identification of ele-mentary components, i.e., exons or retained introns. This separation facilitates the incorporation of novel methods for splice site detection as well as additional sources of information to yield transcript assemblies that are more accurate. Not only a growing annotation of known splice sites, exon junctions, transcription start and end sites (TSSs and TESs) or even full-length isoforms can guide the assembly for most model organisms, but also addi-tional gene boundary data can aid the interpretation of RNA-seq data. Our experiments demonstrate the superior performance of CIDANE in all these different scenarios of optionally available levels of annotation as well as in the interpretation of additionally available gene boundary data. The general work flow of CIDANE is illustrated in Fig. 1.
Results and discussion
We compared the performance of CIDANE in recon-structing transcripts from RNA-seq data to existing state-of-the-art methods. We evaluated the prediction quality on the transcript level based on both simulated and real data. While simulated data capture the characteristics of real data only to the extent that we understand the specifics of the experimental protocol, the performance analysis based on real RNA-seq data today still lacks a gold standard RNA-seq library along with annotated expressed transcripts. Therefore, the results of both types of experi-ments together provide a more meaningful picture of the true performance of a transcript assembly method.
Using simulated data, we investigated the impact of transcript abundance on the prediction quality and con-sidered the scenario where a partial annotation of the (human) transcriptome is available to guide the recon-struction. We assessed both the mere absence or presence of a (true) transcript in the prediction as well as the accu-racy of the estimation of their abundances. Generating
perfect mapping files, we make an attempt to quantify the dependence of current genome-based transcript assem-bly tools on the accuracy of the read mapping (Additional file 1: Figures S1 and S2). We demonstrate the superiority of CIDANE in the ab initio analysis of two human RNA-seq data sets from the ENCODE project [21], and through an integrated analysis of modENCODE RNA data, includ-ing RNA-seq, cap analysis of gene expression (CAGE), and poly(A) site sequencing (PAS-seq), obtained from the heads of 20-day-old adult Drosophila melanogaster. CAGE and PAS-seq data facilitate the mapping of TSSs and TESs, which are very difficult to infer from RNA-seq data alone. Furthermore, we illustrate CIDANE’s ability to (i) incorporate prior knowledge to improve substan-tially the prediction in various realistic scenarios and (ii) recover (invisible) transcripts with uncovered splice junctions.
We compared the prediction to a reference transcrip-tome, referred to as ground truth, containing the true transcripts. Where not specified otherwise, we consider a true transcript as recovered by a predicted transcript if their sequences of introns (intron chains) are identi-cal. A true single-exon transcript is scored as recovered if it overlaps a predicted single-exon transcript. Every pre-dicted transcript is matched to at most one true transcript and vice versa. If rec, true, and pred denote the number of recovered, true, and predicted transcripts, respectively, we applied recall (rec/true), precision (rec/pred), and F score, the harmonic mean of recall and precision ((2× precision×recall)/(precision+recall)), as a measure of prediction quality. Not to penalize potential novel dis-coveries, the calculation of precision ignores predicted transcripts that do not overlap any of the true transcripts. The version number of each tool and the parameters used in our experiments are specified in Additional file 1.
Isoform reconstruction from simulated data
To obtain data as realistic as possible, we used FluxSim-ulator [22] to generate RNA-seq data sets based on
∼78, 000 UCSC-known (February, GRCh37/hg19) human
transcripts [23]. After assigning randomized expression levels to all annotated transcripts following a distribu-tion observed in real data, FluxSimulator simulates the individual steps of an RNA-seq experiment, including reverse transcription, fragmentation, size selection, and sequencing. For all simulated data sets used in this section, the parameter files specifying the model of the RNA-seq experiment and the alignments are available from [24].
Ab initio transcript assembly
Mimicking the characteristics of real RNA-seq data, we generated four data sets comprising 40 and 80 million read pairs (i.e., 80 and 160 million reads) of length 75 and 100 bp, respectively. The fragment lengths observed after gel electrophoresis are modeled by a normal distribution N(250, 25)for the 75-bp reads andN(300, 30)for the 100-bp reads. We mapped each set of paired-end reads to the set of known transcripts using TopHat2 [25]. We defined the ground truth as the set of all annotated transcripts (UCSC) for which at least one paired-end read has been produced.
We compared the performance of CIDANE to the tran-scriptome reconstruction quality of StringTie [18], Cuf-flinks [2], CLASS [13], IsoLasso [17], SLIDE [16], and MITIE [11]. All recall and precision values achieved by CIDANE include transcripts with uncovered splice junc-tions predicted in phase II. We did not include iReckon and GRIT [26] in this first benchmark as both methods require TSSs and TESs to be provided, which, as shown by the experiments in Sections “Annotation-guided assembly” and “Integrating real RNA-seq, CAGE, and PAS-seq”, provides valuable guidance in transcript recon-struction. While IsoLasso, SLIDE, and CIDANE employ known exon–intron boundaries, Cufflinks, CLASS, and StringTie do not allow for the incorporation of pre-computed or annotated splice sites. Cufflinks and StringTie do accept annotated full-length transcripts [27], a scenario that we will investigate in Section “Transcript assembly with partial annotation”. In this experiment, we disable the ability of CIDANE to recombine acceptor and donor sites to form novel exons. Since exon boundary information could be used to infer the originating strand, in the following we apply strand-unspecific evaluation cri-teria. To eliminate a potential source of inaccuracy prior to the reconstruction algorithm, we provided IsoLasso and SLIDE with the fragment length distribution parameters as estimated by Cufflinks.
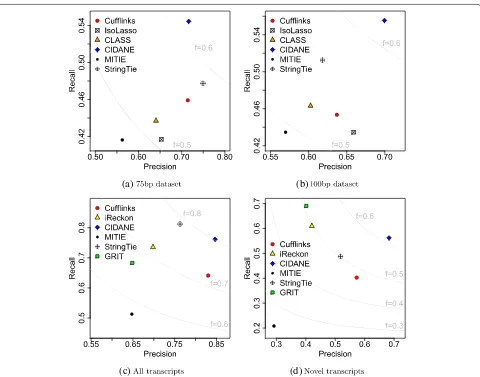
For the data set comprising 40 million 75-bp read pairs (Fig. 2a), CIDANE reconstructed transcripts with a recall value of 54.4 %, a more than 14 % increase over the recall achieved by StringTie (47.7 %), Cufflinks (45.9 %), or CLASS (43.7 %), and a∼30 % improvement over IsoLasso (41.7 %). At the same time, CIDANE predicts transcripts with a precision like that of Cufflinks (71.6 %), and only
4 % lower than StringTie (74.9 %). When the same num-ber of 100-bp reads is generated (Fig. 2b), the precision of StringTie and Cufflinks decreases significantly and is then lower than CIDANE’s precision by 13.6 % and 9.9 %, respectively.
IsoLasso seems to suffer from a heuristic determination of the regularization penalty. SLIDE showed the low-est F score on all four data sets and was not included in the plots. Note that Cufflinks and CLASS model the transcript reconstruction problem as acoveringproblem minimizing the number of transcripts required to explain the input read alignments qualitatively. Neglecting quan-titative information at this stage, it is not surprising that the two methods yield rather conservative predictions. Sections “Transcript assembly with partial annotation”, “Ab initio prediction”, and “Integrating real RNA-seq, CAGE, and PAS-seq” show that the superior performance of CIDANE compared to StringTie and Cufflinks can-not be attributed (only) to the additional exon boundary information. When provided with the exact same partial annotation of transcripts (Section “Transcript assembly with partial annotation”) or when exon boundaries are inferred from the read data alone (Sections “Integrating real RNA-seq, CAGE, and PAS-seq” and “Ab initio predic-tion”), CIDANE still outperforms all existing methods.
The relative performance of the tools is similar on the larger data sets (Additional file 1: Figure S3). Cufflinks, however, seems to have difficulties assembling the 80 mil-lion 100-bp read pairs. Recall and precision achieved by the tools for the four different experimental designs are listed in Additional file 1: Tables S1, S2, S3, and S4.
Dependence on transcript abundance Further, we
analyzed the influence of transcript abundance on the reconstruction capability of the different methods. We removed all transcripts that have many of their bases uncovered (<0.1 fragments per kilobase of transcript per million fragments sequenced or FPKM) from the ground truth and split the remaining isoforms into three groups: lowcomprises the 20 % fraction of transcripts with lowest simulated expression, highthe highest 5 % fraction, and medcontains the remaining 75 % of true transcripts. This subdivision corresponds to cutoffs in relative expression of∼1.5×10⁻⁶and∼2.5×10⁻⁴molecules, respectively. As expected, a higher abundance facilitates the reconstruc-tion of isoforms (Fig. 3). From the 75-bp reads, however, CIDANE and SLIDE recover almost twice as many lowly expressed isoforms (recall∼31 % and∼30 %, respectively) as Cufflinks (recall∼6.1 %), the next best method, where-as StringTie, CLASS, and IsoLwhere-asso recover only
(a) (b)
(d) (c)
Fig. 2Each toolX∈ {Cufflinks, IsoLasso, CLASS, CIDANE, MITIE, StringTie}is represented by a point with coordinates (precision ofX, recall ofX). Fscore isolines are shown inlight gray. Simulated data sets comprise 40 million 75-bp (a) and 100-bp read pairs (b).canddPrecision and recall achieved by each tool when provided with a partial annotation
0 0.2 0.4 0.6 0.8 1
Total High Med Low
Recall
Cufflinks IsoLasso CLASS SLIDE
MITIE StringTie CIDANE
0 0.2 0.4 0.6 0.8 1
Total High Med Low
Recall
Cufflinks IsoLasso CLASS SLIDE
MITIE StringTie CIDANE
[image:5.595.59.539.86.463.2] [image:5.595.59.543.532.690.2]The ability of CIDANE to reconstruct, to some extent, even lowly expressed isoforms is likely due to its two core algorithmic improvements: First, CIDANE computes the entire regularization path in phase I (see Section “Model fitting”) to find the right balance between prediction accuracy and sparsity. An objective that is skewed towards sparsity typically yields predictions that miss low-expressed transcripts. Second, our approach considers a wider range of candidate transcripts than existing meth-ods in phase II (Fig. 1). These include isoforms whose low abundance might cause splice junctions to be uncovered by reads rendering them invisible to other approaches. We investigate this effect in Sections “Delayed recovery of transcripts” and “Recovering invisible transcripts”. Note that for the two 40-million read-pair data sets, SLIDE achieves a similar recall on low-expressed isoforms only at the cost of a significantly lower precision and incurs a several orders of magnitude higher computational cost than CIDANE (see Section “Running times”). From the two 80-million read-pair data sets, CIDANE reconstructs low-expressed transcripts with a ∼13 % to 17 % higher recall compared to SLIDE. All expression-level dependent recall values can be found in Additional file 1: Tables S1, S2, S3, and S4.
Transcript assembly with partial annotation
We investigated the ability of Cufflinks, using the RABT approach presented in [27], iReckon [15], MITIE, StringTie, GRIT [26], and CIDANE to exploit an exist-ing but incomplete annotation of transcripts. No other assembly tool allowed us to provide annotated transcripts. Such a partial annotation, available for the human tran-scriptome and many other studied organisms, can pro-vide valuable guidance for the reconstruction of known isoforms, but algorithms must properly balance the pref-erential prediction of known transcripts and the detection of novel unknown isoforms.
Our algorithmic scheme allows the incorporation of annotated TSSs and TESs during the isoform inference (see Sections “Candidate isoforms” and “Transcription start and end sites”). CIDANE accounts for a higher confidence in annotated vs novel transcripts by adjust-ing model parameters (see Sections “Model fittadjust-ing” and “Phase III: fine-tuning and post-processing”).
From 1440 genes on chromosomes 1 and 2 for which between two and eight isoforms have been annotated, we randomly removed, while preserving all exons, at least one and at most 50 % of the known isoforms and provided each tool with the remaining∼65 % (Annot) of the originally ∼6300 known transcripts. The hidden
∼35 % of annotated transcripts (Novel) constitutes the reference set (ground truth) in evaluating the ability of each method to infer novel isoforms in the presence of an incomplete annotation. Among the original ∼6300
transcripts, FluxSimulator generated 4 million read pairs (75 bp) from a randomly selected subset of 70 % expressed transcripts, which were mapped back by TopHat2. All recall and precision values are listed in Additional file 1: Table S5.
Overall, CIDANE achieves the best trade-off between recognizing known and predicting novel transcripts. With respect to the complete set of expressed transcripts (Fig. 2c), CIDANE correctly assembles 20 % more tran-scripts than Cufflinks (77.2 % vs 64.1 %), combined with a 12 % higher precision than StringTie (85.4 % vs 76.3 %). StringTie’s slightly higher recall (5 %) is entirely based on set Annot of transcripts known to each tool. StringTie assigns non-zero expression levels to the vast majority of provided transcripts and therefore, not sur-prisingly achieves a recall of 99 % with respect to known transcripts, but only 49 % with respect to novel tran-scripts (Fig. 2d). CIDANE discovers more than 14 % and 39 % more novel transcripts than StringTie and Cufflinks, respectively, combined with a 34.6 % higher precision than StringTie. Only GRIT and iReckon find a greater number of novel transcripts than CIDANE, but at the cost of a very low precision of 40–42 % (vs 70 % for CIDANE) and a low sensitivity with respect to known transcripts (68 % GRIT vs 89 % CIDANE).
Abundance estimation accuracy
In addition to evaluating the absence and presence of true transcripts in the prediction, we compared the accuracy of the abundance estimation of CIDANE to existing meth-ods. We restrict this analysis to setAnnot (see previous section) to reduce the impact of the performance of iso-form inference on the measure of abundance estimation quality. For every transcript in set Annot, we compared the predicted FPKM to the true FPKM calculated from the number of simulated paired-end reads. True transcripts that were not predicted by a method were considered as reconstructed with zero abundance. To reduce side effects on the abundance estimation due to very short transcripts, we limit the analysis to transcripts of length at least 500 bp (∼98.5 %).
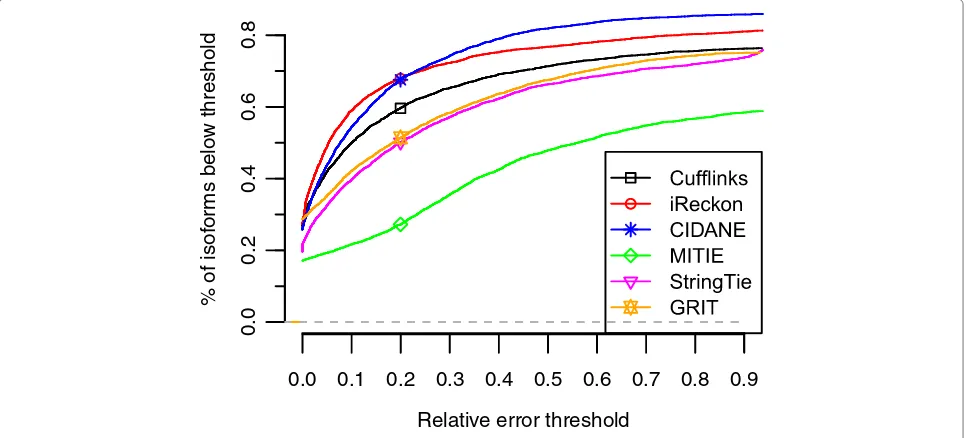
Figure 4 displays the fraction of annotated transcripts (Annot) for which the predicted abundance has a rel-ative error below a certain threshold. Besides iReckon with its very small error rates, CIDANE computes the most accurate estimates of expression levels. By running a tool developed specifically for the statistical estima-tion of abundances on the set of transcripts assembled by CIDANE, we expect a further improvement in accu-racy. A known (or reconstructed) set of expressed tran-scripts allows for more involved statistical models that often operate, like iReckon’s expectation-maximization algorithm, at single-read resolution.
Delayed recovery of transcripts
In this benchmark, we demonstrate the capability of CIDANE to recover in phase II (see Fig. 1) isoforms con-taining splice junctions that are not supported by any read. Note that a junction between neighboring exons can also be supported (“covered”) by a read pair that maps to the two exons, even if none of the reads span the junc-tion. From the∼6300 transcripts expressed by the genes selected in the previous benchmark set, we simulated 2 million 75-bp read pairs. In all, 118 transcripts had at least one splice junction uncovered and are, therefore, invisible to any method that derives candidate transcripts from a splicing graph representation of the read alignments (see Section “Candidate isoforms”). We note that this simula-tion neglects sequencing errors and any sequence-specific or positional fragment biases. Furthermore, the mapping of reads to known transcripts is less error-prone than the spliced mapping to a reference genome and, thus, the number of such invisible isoforms is expected to be larger in practice. As before, CIDANE is given only the
known exon boundaries and the mapped reads as input. For performance reasons, the delayed generation of tran-scripts was applied only to genes containing at most 50 exons, covering more than 99 % of the genes. For larger genes, CIDANE outputs the initial solution returned by our regularized linear regression approach (phase I in Fig. 1).
CIDANE successfully recovered∼24.6 % of the invisible transcripts expressed in our simulated cellular transcrip-tome. StringTie, Cufflinks, MITIE, and IsoLasso (provided with exon boundaries) did not predict a single invisible isoform (as expected), while SLIDE recovered ∼5 %. In rare cases, SLIDE in fact considers candidates with uncov-ered junctions if otherwise only short candidates with at most two exons exist [29]. We suspect that this strategy is one of the main causes for the very slow running time of SLIDE (see the next section).
When provided with a partial annotation (Annot) as in the previous benchmark, iReckon and Cufflinks recovered only one and two isoforms, respectively, whereas CIDANE recovered 17 (∼40 %) out of 42 invisible transcripts not contained in set Annot. StringTie and MITIE again did not predict any invisible transcripts. For each of the three invisible isoforms recovered by iReckon and Cufflinks, the provided annotation (Annot) reveals the uncovered splice junction within an alternative isoform. Neither of the methods was able to reconstruct any uncovered novel splice junction.
Running times
CIDANE in basic mode (omitting phase II) took 29 min to assemble 80 million read pairs (75 bp), compared to 23 min and 42 min required by StringTie and IsoLasso,
Relative error threshold
% of isof
or
ms belo
w threshold
0.0 0.1 0.2 0.3 0.4 0.5 0.6 0.7 0.8 0.9
0.0
0.2
0.4
0.6
0.8
[image:7.595.58.541.495.714.2]respectively. Considering the 2.5 hours TopHat2 took to align the reads, these methods do not constitute the bottleneck of this analysis pipeline. The remaining tools required between 1 hour (Cufflinks) and slightly more than 2 hours (CLASS and MITIE), except for SLIDE, which took more than 62 hours. CIDANE’s optional search for invisible transcripts in phase II requires an additional 42 min of computation. In contrast to methods like StringTie and Cufflinks, the current implementation of CIDANE’s optimization algorithm applied in phase I uses only one thread and can be further enhanced by multi-threading support. The running times of all tools on all five simulated data sets are shown in Additional file 1: Table S6.
Real human RNA-seq
We illustrate key features of CIDANE on two human RNA-seq data sets from the ENCODE project [21]. Besides the overall performance in terms of recall and pre-cision, we demonstrate CIDANE’s capability to recover transcripts invisible to existing methods and its ability to exploit different levels of annotation to improve the assembly.
The two strand-specific samples obtained from whole B cells in blood (GEO accession GSM981256) and CD14-positive monocytes (GSM984609) comprise 90 million and 120 million 76-bp paired-end reads, respectively, and were aligned using TopHat2. The same data sets were used in [18] to assess StringTie’s performance and we apply, consistently with our other benchmarks, the same evaluation criteria as [18]. We compared transcript pre-dictions to a collection Hof well-curated 171,904 tran-scripts in 41,409 protein-coding and noncoding genes that was created by the authors in [18] by merging all annotated genes from databases RefSeq [30], Ensembl [31], and the UCSC Browser [32]. Consistent with [18], we included in the reference set (ground truth) all tran-scripts in H that had all internal exons and introns covered by (spliced) alignments. As in our other exper-iments, we considered a (presumably) expressed tran-script in the reference set as successfully recovered if the sequence of introns matches perfectly. The preci-sion is defined with respect to all annotated transcripts inH.
Ab initio prediction
In our ab initio experiment, only the TopHat2 alignments were provided to CIDANE, StringTie, Cufflinks, IsoLasso, MITIE, and CLASS. SLIDE’s excessive running time did not allow us to include it in the results below. CIDANE’s assembly algorithm was preceded by the algorithm devel-oped in [26] to detect exon boundaries from (spliced) alignments (for more details see Section “Integrating real RNA-seq, CAGE, and PAS-seq”). GRIT and iReckon were
not included in this benchmark since they both require TSSs and TESs to be provided.
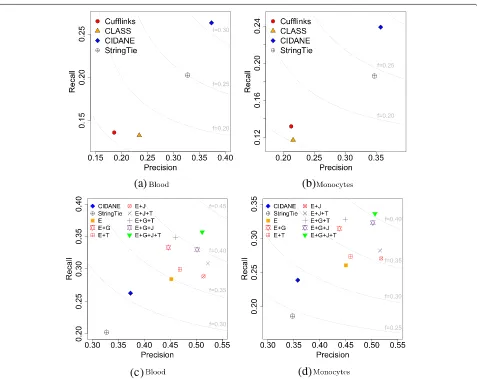
On both data sets, CIDANE reconstructed transcripts with significantly higher sensitivity than all competing methods, while at the same time producing the low-est number of false positive predictions (Fig. 5a, b) and Additional file 1: Table S7). Compared to StringTie and Cufflinks, the two next most sensitive assemblers, CIDANE recovered 28.2 % and 81.1 % more transcripts expressed in the monocyte sample, and 29.7 % and 92.9 % more transcripts expressed in the blood sample. CIDANE’s improvement in recall over StringTie trans-lates into an increase of 3412 (14,885 vs 11,473) and 3137 (14,254 vs 11,117) correctly predicted transcripts in the blood and monocyte samples, respectively. The generally low values in sensitivity and precision are due to alignments contributing to the coverage of multiple alternatively spliced isoforms in the definition of our ref-erence set and an incomplete annotation of human tran-scripts. CIDANE (single-threaded) took 2 and 3.5 hours to assemble the blood and monocyte reads (Additional file 1: Table S6). Only StringTie (using up to 16 threads) was considerably faster. Again, following the analysis pipeline in [18], the preceding alignment of 180 million (blood) and 240 million (monocyte) reads by TopHat2 required 14 and 20 hours, respectively, and constitutes the (computational) bottleneck in this analysis. Neverthe-less, multi-threading support will further scale CIDANE’s performance since its core algorithms operate on each locus independently. Cufflinks, for example, achieved a tenfold speedup by using up to 16 threads. Experiments (not shown) on a more sparse formulation of our opti-mization model (“Methods”, Eq. 1) did improve the run-ning time, but only at the cost of accuracy.
Annotation-guided assembly
(a)
(b)
(d)
(c)
Fig. 5Recall and precision on real human data.a,bAb initio transcript predictions. Isolasso and MITIE with recall values of 5–8 % are omitted (see Additional file 1: Table S7).c,dRecall and precision of annotation-guided assemblies by CIDANE. Ab initio predictions of CIDANE and StringTie shown as reference. In addition to read alignments, CIDANE employs information on exon boundary (E), gene boundary (G), TSS/TES (T), and exon junction (J). Same color of symbols indicates same number of augmentary information types
reduce the number of false positive transcript predictions considerably.
However, not only an annotation can provide such valuable guidance. Native elongating transcript sequenc-ing (NET-seq), for example, contains an explicit sig-nal on the location of exon boundaries [33]. Strong RNA polymerase II pausing at exon borders manifests in sharp peaks in NET-seq read coverage. Similarly, CAGE and PAS-seq can help to identify TSSs and TESs (see Section “Integrating real RNA-seq, CAGE, and PAS-seq”). Consistent with our observations in Section “Integrating real RNA-seq, CAGE, and PAS-seq”, information available on TSSs and TESs also significantly enhances CIDANE’s assembly of transcripts. If the biological question involves a known set of genes, for example, then gene bound-ary information prevents fragmentation and fusion of genes caused by missing and ambiguous read alignments,
[image:9.595.62.539.86.465.2]Recovering invisible transcripts
In a real data set, it is impossible to distinguish invisi-ble transcripts from transcripts in the curated setHthat are simply not expressed. On the other hand, expressed transcripts that can be correctly identified in a given RNA-seq data set might be invisible in a lower coverage experiment. We, thus, design the experimental evalua-tion in this secevalua-tion in the reverse way. Starting from a set of (correctly) assembled transcriptsT, we uniformly subsample the set of all concordant read-pair alignments (genome-wide) usingsamtools, which renders a subset of transcripts inT invisible. Additional file 1: Tables S9 and S10 show the number of invisible transcripts for differ-ent fractions of sampled reads when the four initial sets of transcriptsT contain all transcripts that were correctly assembled by one of the four most accurate methods based on the full set of 180 million (blood) and 240 million (monocyte) read alignments, respectively. The numbers shown are conservative estimates of the true numbers of invisible transcripts. They do not include transcripts invisible in the full set of alignments and most methods fil-ter the lowest-expressed transcripts for each gene, which would become invisible even if large fractions are sampled. Furthermore, invisible transcripts among false negative predictions are not taken into account either. Neverthe-less, even in real RNA-seq data sets containing 54 mil-lion (blood) and 72 milmil-lion (monocyte) reads, between 656 and 949 transcripts that were correctly assembled by StringTie or CIDANE from the full set of reads are invis-ible (Additional file 1: Tables S9 and S10). More sensitive methods provide a more comprehensive set of transcripts
T, yielding a higher number of invisible transcriptsIas reads are removed.
To investigate the utility of CIDANE’s delayed recovery of invisible transcripts, we do not rely on the prediction of any single method, but start from a high-confidence set of transcripts T that contains all transcripts in the curated setHthat were predicted by both StringTie and CIDANE, the two best-performing methods. As CIDANE and StringTie will agree mostly on highly expressed transcripts, we have to sample randomly fewer read align-ments to obtain a reasonable number of invisible tran-scripts (last columns in Additional file 1: Tables S9 and S10). Among loci that express transcripts with at least one splice junction uncovered by the 54 million (blood) and 72 million (monocyte) read alignments, CIDANE success-fully recovers 21.4 % and 21.1 % of invisible transcripts, at a precision of 34.1 % and 31.6 %, respectively. CIDANE’s recall is just slightly lower than the one it achieves on the simulated data (see Section “Delayed recovery of tran-scripts”), despite additional error sources in the real data sets. CIDANE recovers invisible transcripts (phase II) in the blood sample with a precision that is less than 3 percentage points lower than its precision in predicting
visible transcripts (phase I) but even higher than the precision achieved by all competing methods on this less-challenging set of transcripts (Additional file 1: Table S7). Transcripts in the monocyte sample generally seem to be more difficult to reconstruct than in the blood sample. Invisible transcripts in the monocyte data set have a lower read coverage than in the blood data set (Additional file 1: Figure S6).
In Additional file 1: Tables S11 and S12, we show the results for the recovery of invisible transcripts for samples of size 20 %, 30 %,. . ., 90 %. Overall, CIDANE performs better on larger samples. The smaller the frac-tion of sampled alignments, the lower the read cover-age of invisible transcripts (Additional file 1: Figure S6), which makes their recovery even harder. Similarly, relative expression has an impact on CIDANE’s ability to detect invisible transcripts. Among the 5 % highest expressed invisible transcripts in the monocyte sample, CIDANE recovered 39 %, while it reconstructed 10 % among the 20 % lowest expressed invisible transcripts (Fig. 6a). A similar pattern can be observed for different sampling fractions, except for large samples (≥70 %) of the mono-cyte fragments. There, the left tail of the distribution of their expression levels drops less sharply towards tran-scripts with extremely low read coverage (Additional file 1: Figure S6b), and the small number of invisible transcripts (Additional file 1: Table S10) with estimated reference expression is prone to a higher variance.
Finally, we demonstrate the effect an adjusted regu-larization penalty in phase II (“Methods”, threshold λin Eq. 4) has on the recall/precision trade-off of CIDANE’s invisible transcript recovery (Fig. 6b). When increasing (in steps of 5 units) the multiplicative factor that con-trols the cost of transcripts generated in phase II (option -rl), the precision increases to up to 39 % (blood) and 36 % (monocyte), combined with a decrease in recall by less than 2 percentage points. Again, similar behavior can be observed for other sample sizes (Additional file 1: Tables S11 and S12).
Integrating real RNA-seq, CAGE, and PAS-seq
RNA-seq data provide an explicit signal for the detection of introns that is more informative than mere read cov-erage. Spliced alignments span splice junctions between exons and can be leveraged to infer splice donor and splice acceptor sites and thus, the boundary of internal exons. In contrast, the reconstruction of transcript boundaries, i.e., the TSS at the 5end and the TES at the 3end, relies on a read coverage drop that is blurred by biases in the RNA-seq assay and is thus error-prone.
(a) (b)
Fig. 6Performance of CIDANE’s delayed detection of invisible transcripts (phase II).aFraction of invisible transcripts recovered among highest expressed 5 % (high), lowest expressed 20 % (low), and all remaining transcripts (med).bRecall/precision trade-off. The precision increases significantly for larger regularization penalties (option-rl), at the cost of a small decrease in recall
annotation available for most model organisms can guide tasks (i) and (ii) (see Sections “Transcript assembly with partial annotation” and “Annotation-guided assembly”), but additional gene boundary data can aid the interpreta-tion of RNA-seq data [26].
By integrating Drosophila melanogaster RNA-seq, CAGE, and PAS-seq data, GRIT [26] assembled tran-scripts with a considerably higher recall and precision than Cufflinks. CAGE and PAS-seq produce reads from the 5ends and polyadenylation sites of mRNAs, respec-tively, and thus facilitate the mapping of TSSs and TESs. Since reconstructing transcripts from RNA-seq data alone is intrinsically underdetermined [34], a mapped TSS/TES can reduce the search space significantly, particularly for complex loci, and this is, thus, expected to yield more accurate transcriptome predictions. In fact, exper-iments on simulated data performed in [14] suggest the importance of TSS/TES information in transcript assembly.
In this section, we demonstrate the superiority of our comprehensive transcript assembly approach on the integrated analysis of modENCODE RNA data, com-prising stranded RNA-seq, CAGE, and PAS-seq data obtained from 20-day-old adult D. melanogaster heads [26]. We reconstruct transcripts ab initio without relying on any elements of the annotation of theD. melanogaster genome. Instead, we compute exon and transcript bound-aries using the boundary discovery procedure of GRIT. Exons and introns are identified by read coverage and spliced alignments, respectively. Gene regions then con-tain exons that are connected by introns. In addition to splice donor and splice acceptor sites, the TSS and TES are identified from read coverage peaks in the CAGE and PAS-seq data. For details, we refer the interested reader to the original description of the procedure in [26].
Candidate transcripts considered by CIDANE corre-spond to paths in the splicing graph (see Section “Candi-date isoforms”). Only paths from exons whose 5boundary coincides with an identified TSS (and ends with a splice donor site) to exons whose 3 boundary coincides with an identified TES (and begins with a splice acceptor site) are considered. Single-exon transcripts are bounded by an identified TSS and TES on the 5and 3ends, respectively. We compared the performance of CIDANE, GRIT (lat-est version 1.1.2c), StringTie, and Cufflinks on four repli-cates, two male and two female (see [26] or Additional file 1: Table S13). In the experiments performed in [26] on the same data sets, GRIT drastically outperformed anno-tation tools Scripture [9] and Trinity+Rsem [35] in terms of recall and precision. Here we apply the same evaluation criteria as in [26] and thus, refrain from benchmark-ing CIDANE against tools Scripture and Trinity+Rsem. Like [26], we assumed a FlyBase 5.45 [36] transcript to be expressed in our sample if it is composed of a single exon or if otherwise every splice junction is supported by at least one read. Since transcripts contained in the resulting ground truth by definition had no uncovered splice junctions, we disabled the delayed transcript recov-ery mode (phase II in Fig. 1) of CIDANE. Applying the above criteria, between ∼8200 and ∼10,000 transcripts were expressed in each of the fourD. melanogasterhead samples.
[image:11.595.60.541.88.257.2]Figure 7 depicts recall, precision, andFscore achieved by Cufflinks, StringTie, GRIT, and CIDANE on the identi-cally colored four replicates. Their precise coordinates are listed in Additional file 1: Tables S14, S15, and S16. As was done in [26], we filtered transcripts predicted by GRIT with expression score lower bounds less than 1×10⁻⁶ estimated FPKM at a marginal 99 % significance level.
Figure 7a, b takes into account the accuracy of transcript boundaries with different tolerances. If the predicted and annotated TSS/TES are required to lie within 50 bp of each other (Fig. 7a), the lack of read data on the 5ends and polyadenylation sites of mRNAs results in a significantly poorer performance of StringTie and Cufflinks compared to GRIT. Employing the same amount of data as GRIT, however, CIDANE achieves a recall of∼29–31 %, com-pared to ∼15–21 % for GRIT, combined with a slightly higher precision. Utilizing the additional CAGE and PAS-seq data, CIDANE reconstructs transcripts with around threefold to eightfold higher precision than StringTie and fourfold to 12-fold higher precision than Cufflinks. If we relax the TSS/TES tolerance to 200 bp (Fig. 7b), GRIT’s prediction profits from the additional CAGE and PAS-seq data mostly in terms of precision. Again, CIDANE manages to reconstruct substantially more transcripts than GRIT, combined with a slightly higher precision. CIDANE’s gain in precision over StringTie and Cufflinks ranges from about twofold to sixfold.
Figure 7c neglects the accuracy of transcript boundaries. CIDANE (f ≥ 0.51) combines the superior precision of GRIT (f ≥ 0.33) with the superior recall of Cufflinks (f ≥0.27) and StringTie (f ≥0.29) and achieves overall the highestFscore. Note that the recall values of StringTie and Cufflinks shown in Fig. 7c count annotated tran-scripts as true positive hits even if there is no evidence for their expression in the CAGE and PAS-seq data. In each analysis, the transcriptome predictions of GRIT and CIDANE are based on the exact same mapping of exons, introns, TSS, and TES. The superiority of our approach results entirely from a more coherent assembly of exons into transcripts.
Concerning the efficiency, CIDANE and StringTie ran for less than 12 and 6 minutes per sample, respectively, while GRIT (allowing up to 16 threads) took∼3 h of com-putation, including the discovery of exon and transcript boundaries. Cufflinks required slightly more than 1 h of computation per sample.
Conclusion
We present CIDANE, which provides major improve-ments in cellular transcriptome reconstruction from RNA-seq over existing assembly tools. Through a carefully chosen trade-off between model complexity and tractability of the resulting optimization problem, and by applying state-of-the-art algorithmic techniques, CIDANE builds full-length transcript models from short sequencing reads with higher recall and precision than was possible before. CIDANE is engineered not only to assemble RNA-seq reads ab initio, but also to make use of the growing annotation of known splice sites, TSSs and TESs, or even full-length transcripts, available for most model organisms. Our experiments show that CIDANE’s core algorithmic engine yields more accurate transcrip-tome reconstructions than competing tools, in all these different scenarios and under various realistic experimen-tal designs. Along the same lines, CIDANE can employ additional gene boundary data to guide the assembly, thereby improving the precision of the reconstruction significantly.
To some extent, phase II of CIDANE allows us to recover splice junctions that are invisible to all existing approaches. Such junctions are not supported by any read alignment and can be observed predominantly among low-expressed transcripts. While CIDANE in basic mode (phase II omitted) reconstructs a human cellular tran-scriptome from 80 million aligned read pairs in 29 min, the recovery of invisible junctions is a more com-plex task. For genes larger than 50 exons, the iterative determination of invisible transcripts might become too expensive in practice and is disabled by default in our cur-rent implementation. Future work on the fixed-parameter
(a)
(b)
(c)
[image:12.595.60.540.580.701.2]tractability of the heaviest isoform problem might allow us to push the limits even further.
We expect that CIDANE will provide biologists with accurate transcript predictions from the very large, complex data sets that currently emerge from RNA-seq experiments. Such a high-resolution RNA-seq data inter-pretation is essential for any type of downstream analysis and will help to expand the catalog of genes and their splice variants.
CIDANE is free open-source software released under the GNU GPL license, and has been developed and tested on a Linux x86_64 system. CIDANE’s source is available from https://bitbucket.org/canzar/cidane.
Methods
In this work, we assume mRNA fragments to be sequenced from both ends, yielding paired-end reads. Nonetheless, all results trivially apply to single-end reads. For each locus, identified as connected com-ponents of read mappings, CIDANE reconstructs iso-forms from RNA-seq data in three phases (Fig. 8). First (Section “Phase I: regularized linear regression”), a lin-ear model is fitted (Fig. 8c) to a compact representation of the observed read mappings (Fig. 8a) using a set of fully supported candidate transcripts (Fig. 8b). Here, our approach differs from existing methods mainly in (i) care-fully designed regression coefficients that model (like SLIDE) the distribution of reads along a transcript and in (ii) applying a state-of-the-art machine-learning algo-rithm to balance the accuracy of the prediction and the number of isoforms assigned a non-zero expression level.
In a second phase (Section “Phase II: delayed genera-tion of improving isoforms”), CIDANE explores the space of transcripts that is neglected by existing methods due to computational challenges. To identify iteratively such a transcript that can help to improve the current predic-tion, we have to solve a problem (Fig. 8d) that we formalize
as the heaviest isoform problem. If the heaviest isoform does not improve the current prediction, CIDANE is guar-anteed to have found the best possible set of isoforms without having explicitly enumerated all potential iso-forms in the exponentially large space. Otherwise, the newly constructed isoform (Fig. 8e) can be used to adjust our fitting.
Although we show that heaviest isoform problem is NP-complete, we propose an integer linear program-ming (ILP) formulation that exploits certain properties of RNA-seq data and (optionally) known splicing character-istics that allow for the efficient solution of the ILP. For example, only a few combinations of exons enclosed by two mapped read mates are typically consistent with an estimated fragment length distribution, yielding a small number of variables in our formulation. Furthermore, we (optionally) disregard transcripts whose alternative pro-moter and polyadenylation sites coincide with acceptor and donor sites of internal exons, since signals read by the transcription and splicing mechanism to identify start (end) sites and acceptor (donor) sites differ significantly. Note that this restriction is conceptually equivalent to considering onlymaximal paths in the splicing graph as candidates, as is done by current methods. CIDANE, how-ever, tries to restore maximal paths that are broken due to uncovered splice junctions. At the same time, the flexibil-ity of an ILP formulation allows CIDANE to incorporate additional data or knowledge concerning, for instance, exon boundaries, intron retentions, TSSs, and TESs.
The prediction is tuned (Section “Phase III: fine-tuning and post-processing”) by refitting the linear model using the initial set of candidate transcripts augmented by all improving transcripts identified in the second phase of CIDANE. Finally, the expression levels of the recon-structed transcripts are re-estimated and converted into FPKM in a post-processing phase (Section “Phase III: fine-tuning and post-processing”).
(a)
(b)
(c)
(d)
(e)
[image:13.595.61.541.556.683.2]Phase I: regularized linear regression
Like count-based methods such as SLIDE and IsoLasso, we summarize the observed read mappings intosegment covers(Fig. 8a). Instead of trying to explain each read map-ping with its precise genomic coordinates, we count the number of reads that fall into non-ambiguously connected segments of the genome.SegmentsinSrepresent minimal exon fragments that are covered by reads and bounded by splice sites, TSSs, or TESs (see Additional file 1: Figure S7), derived from spliced alignments, extracted from a set of gene annotations, or supported by additional data. For sequences of segments ¯si and ¯si, a segment cover ci =
(¯si,¯si,bi) then counts the number bi of read pairs r =
(r1,r2) where r1 andr2 map with a signatureconsistent
with¯siands¯i, respectively; i.e., the mapping ofr1(r2) spans
precisely the set of segment boundaries that are implied by
¯
si(¯si) (see Additional file 1: Figure S8).Faux segment covers
(¯sj,s¯j, 0)indicate that the corresponding combination of
segments wasnotobserved in the read data and can help to identify false positive predictions. We denote the set of segment covers, including faux covers (see Additional file 2: Section 1), byC.
Candidate isoforms
We derive the initial set of candidate isoformsT(Fig. 8b) used to explain the observations (segment covers) as paths in asplicing graph[37]. Nodes in a splicing graph corre-spond to segmentsS and edges connect exon fragments whose consecutivity is indicated by (spliced) alignments. Under the assumption that every splice junction of every expressed isoform is covered by at least one mapped read, every expressed (true) transcript is among the paths in the splicing graph. For a formal specification of a splic-ing graph as employed in CIDANE, see Additional file 2: Section 2.
We further define setsT SS andPAS, which contain potential TSSs and TESs, respectively. These sets can be compiled from annotated TSSs and polyadenylation sites, additional read data from the 5ends and polyadenylation sites of mRNAs (see Section “Integrating real RNA-seq, CAGE, and PAS-seq”), or purely from read mapping data. The latter is based on an exclusion principle. We do not allow for transcripts whose alternative promoter or polyadenylation sites coincide with acceptor and donor sites of internal exons and thus, exclude all segments with spliced alignments supporting their 5or 3end fromT SS andPAS, respectively. This exclusion strategy is equiv-alent to considering onlymaximalpaths in the graph, as is done by current methods, and can easily be relaxed in CIDANE by settingT SS:=SandPAS:=S.
The set of candidate isoforms among which we select our initial prediction is then obtained by enumerating all (or a preselected set of ) paths in the splicing graph that start at a segment inT SSand end at a segment inPAS.
Model fitting
We apply a linear model (Fig. 8c) to estimate the num-ber of reads originating from segments of the genome. Assuming that every position of an expressed tran-script is equally likely chosen as a starting position of a sequenced RNA fragment, we model the expected num-ber of fragments mapping to segment coverc = (s,s,b) ast∈Tt,cθt, wheret,cis the expected number of
start-ing positions of fragments obtained from transcripttthat show a mapping signature consistent withc. The expres-sion levelθtof transcripttcounts the expected number of
mapped fragments per transcript base, which is converted to FPKM at a later stage (Section “Phase III: fine-tuning and post-processing”).t,cdepends on the length of
seg-ments in¯sand¯s, the length of segments intenclosed by sands, the read length, and the cDNA fragment length distribution. Equations definingt,cas used in our model
are given in Additional file 2: Section 3. In contrast, meth-ods like TRAPH [12], MITIE, and IsoInfer/IsoLasso define coefficientscthat neglect the dependence on transcripts
t. Note that the distribution of reads along a transcript is generally not uniform, but typically unknown. The same applies to all the experimental data used in this study. Any prior knowledge concerning the likelihood of start-ing positions can be incorporated into our model through adjustedt,ccoefficients.
We employ the sum of squared errors (i.e., differences between estimated and observed number of reads) as a measure of accuracy of our prediction, weighted by an estimator for the variance of observationsb[14]. Fitting our model using all candidate transcripts would allow us to fit noise in the data by predicting a large number of isoforms with low but non-zero expression levels. Since in a given cell type really only a small subset of candi-date transcripts is expressed, our approach seeks a sparse set of expressed isoforms by augmenting, like SLIDE and IsoLasso, the objective by the L1 norm of the isoform abundances. Our (initial) predictionθ ≥ 0 comprises all transcripts with non-zero expression level in the optimal solution to
min θ≥0
c=(¯s,s¯,b): c∈C
b−t∈Tt,cθt
max{,b} 2
+λ
t∈T
θt (1)
For faux covers, we replaceb = 0 by (default = 1). This so-calledLassoregressionselectsisoforms by setting the expression levels of all other transcripts to zero one at a time with increasing penalty termsλ.
the coefficient path is piecewise linear, the entire regu-larization path can be computed at the cost of a single least-squares fit [38]. We apply a coordinate descent algo-rithm implemented in theglmnetFortran code [39], that cyclically optimizes, for a givenλ, each isoform abundance separately, holding all other abundances fixed. Update operations (inner products) directly profit from our sparse matrix oft,cvalues (see Additional file 2: Section 3).
Fur-thermore, considering a sequence of decreasing values for λexploits estimates at previousλ’s as a warm start. After having computed the entire path of values forλ, our ini-tial prediction is obtained from the optimal solution to Eq. 1 for the value of λthat yields the bestadjusted R2 score. The adjustedR2adjusts the goodness of fit (R2) for
the number of isoforms used. If CIDANE is provided with a partial annotation of the transcriptome of an organism, the higher confidence in annotated transcripts is mod-eled by scaling the regularization penaltiesλassigned to unknown transcripts by a factor ofγ (defaultγ =2).
Phase II: delayed generation of improving isoforms The aim of the second phase of CIDANE is to recover isoforms with uncovered splice junctions (invisible tran-scripts) that are not included in the candidate set of the regularized least-squares regression due to their pos-sibly very large number. We employ a delayed column generation technique [20] to identify new candidate iso-forms that improve the optimal solution of the regularized least-squares regression without exhaustive enumeration of all possible candidates. Particularly suited for large-scale linear programs, we formulate a piecewise-linear approximation (Additional file 2: Section 4) of the follow-ing quadratic program that is equivalent to the regularized least-squares objective function, Eq. 1:
min
ci∈C
ei
max{,bi}
2
+λ
t∈T
θt (2)
s.t.
t∈T
t,ciθt+ei=bi, ∀ci∈C (3)
θ ∈ R|T|
+ is the vector of transcript abundances, and e ∈ R|C| denotes the vector of errors, i.e., differences between estimated and observed read counts per segment cover. The generation of columns (i.e., variablesθt) is then
accomplished by means of an ILP formulation presented below. In the following, we letm := |C|be the number of segment covers falling into the considered locus and we letAbe the corresponding coefficient matrix of con-straints, Eq. 3. Since the number of transcripts a gene can potentially encode grows exponentially with the number of its exons, constructing matrixAin full is impractical, even for comparatively small genes. Rather, we consider a restricted problem that contains only a small subset of all
possible transcripts, represented by theθ variables, and generate novel isoforms, i.e., columns ofA, as needed to improve the overall prediction.
To identify an isoform that can help to improve the prediction in terms of objective Eq. 2, Dantzig’s sim-plex method [20] requires the determination of a variable (transcript)θtjwith negative reduced cost¯cj=λ−pTAj,
wherepis the vector of simplex multipliers andAjis the
column ofArepresenting transcripttj.
Instead of computing the reduced cost associated with every possible transcripttj, we consider the problem of
minimizing(λ−pTAj)over alltj, or equivalently, the
prob-lem of maximizingpTAjover all transcriptstj. According
to constraint Eq. 3, for every 1≤i≤m, entryiof column Ajhas valuetj,ci. The task is, therefore, to find a transcript
tjsuch that
ci∈C
(pitj,ci) > λ. (4)
If no such transcript exists, all reduced costs are non-negative and the current solution is optimal. Next, we model this optimization problem as a variant of the heav-iest induced subgraph problem [40] and propose an ILP formulation. For ease of notation, here we only consider the case where reads span single exons. For the general case of reads spanning an arbitrary number of exons, we refer the reader to Additional file 2: Section 5. Consider graphG = (V,E)that contains one vertex for each exon of a locus. We assume that the exons are numbered from left to right from 1 tonand identify each vertex by the cor-responding exon number. We identify each segment cover (s¯,s¯,b)with single-exon sequences s¯ = i, ¯s = jby (i,j,b)and include an edgee = (i,j)inE. For each edge e∈Ewe denote byV¯(e)the set of vertices whose associ-ated exons lie between the exons given by segmentsiand j, i.e.,V¯(e):= {k∈V :i<k<j}. We assign to each edge e ∈ Ea weight functionwe : P(V¯(e)) →R. Then,
find-ing an improvfind-ing transcript is equivalent to the followfind-ing variant of the heaviest induced subgraph problem:
Definition 1(Heaviest isoform problem).Given graph G=(V,E)and edge weight functions we, find T⊆V such
that the induced subgraph has maximal total edge weight, where each induced edge e contributes weight we(T∩ ¯V(e)).
Edge weights we model the corresponding summands
This problem can be captured by the following integer linear program. For each vertexiinG, a binary variablexi
indicates whether vertexiis contained in the solution. For every edgee∈Eand every setV¯j⊆ ¯V(e), we have a binary
variableye,j, which is 1 if and only if vertices selected by the
xvariables are consistent withV¯jand inducee, enforced
by the constraints below. In the objective function, we let we,j:=we(V¯j):
max
e∈E
¯
Vj⊆ ¯V(e) we,jye,j
s.t. ye,j≥
vi∈e∪ ¯Vj
xi+
vi∈ ¯V(e)\ ¯Vj
(1−xi) − | ¯V(e)| −1,
e∈E,Vj¯ ⊆ ¯V(e)
ye,j≤xi, e∈E,Vj¯ ⊆ ¯V(e),vi∈e∪ ¯Vj
ye,j≤1−xi, e∈E,Vj¯ ⊆ ¯V(e),vi∈ ¯V(e)\ ¯Vj
Depending on the quality of the data (determined by, e.g., sequence-specific or positional biases and read map-ping accuracy), an isoform that is built by our ILP for-mulation might improve the prediction with respect to objective Eq. 1 by balancing, for instance, read cover-age fluctuations. To prevent fitting noise in the data, we require novel isoforms to explain segment coversc that are not supported by any transcript in the initial solution T∗ returned by the regularized least-squares regression Eq. 1; i.e.,∀t ∈ T∗ : t,c = 0. We refer to this set of
ini-tially unsupported segment covers asC˜ ⊆ C. To reduce the impact of spurious read mappings, we require a cer-tain numberkcof read counts to be observed on the set of
newly supported segment covers:
ci∈ ˜C
bi
¯
Vj⊆ ¯V(ei)
yei,j≥kc (5)
Intuitively, variables ye,l associated with an edgee =
(i,j)guess the selection of exons between exons iandj. Since for largej−itheir exponential number would ren-der our ILP approach infeasible, we neglect setsV¯j that
would imply fragments of very unlikely length. More pre-cisely, we apply lower and upper bounds ˇandˆin the computation oft,c(see Eq. (1) in Additional file 2) that
limit the lower and upper 5 % quantiles, respectively, of the estimated fragment length distribution. In Additional file 2: Section 7, we translate this fragment length restric-tion into lower and upper limits on the total length of exons in V¯j, which allow us to enumerate feasible exon
combinations in V¯j by an efficient splicing-graph-based
backtracking scheme.
The construction of improving transcripts can be fur-ther guided by additional information such as exon– intron boundaries, TSSs, TESs, or exon connectivity. In
the following, we introduce constraints that we optionally add to our ILP formulation, depending on the type of data available, to ensure that thexvariables encode a transcript that exhibits the desired structure.
Exon compatibility
Splice acceptor and splice donor sites can be derived from spliced alignments or extracted from a set of gene annota-tions. Here we consider the case of a set of known exons
E. The more general case where the pairing of alterna-tive acceptor and donor sites is unknown can be reduced to this case by simply including all possible combinations of acceptor and donor sites of an exon in E. Alterna-tively, the structure of a splicing graph along with the individual mapping of acceptor and donor sites can be enforced through exon connectivity constraints as shown in the next section.
To ensure that the segments inSselected by thex vari-ables form only valid exons inE, we link the segments of each exonEj∈Eby an indicator variablezj:
xi=
Ejsi
zj, 1≤i≤ |S| (6)
This constraint implies that (i) every selected segmentsi
(i.e., xi = 1) must be part of exactly one selected exon
Ej(i.e.,zj = 1), (ii) all segments of a selected exon must
be included, and (iii) no pair of overlapping, and hence incompatible, exons can be selected simultaneously.
Exon connectivity
For some complex genes, it is computationally infeasible to enumerate all paths in the splicing graph to obtain the set of candidate isoforms. For such genes, our delayed isoform generation approach allows the exploration of all candidate isoforms without explicitly enumerating them. Constraint Eq. 7 with ui,j := 0, therefore, captures the
splicing graph structure in a way that the path induced by the selected set of segments agrees with the set of edges E in the splicing graph. A simultaneous selection of two segments si andsj, i < j, without selecting any
segmentsk with i < k < j is not feasible if the
splic-ing graph does not contain edge (vi,vj). Notice that this
scheme allows us to assemble novel exons by selecting acceptor sites (incoming edge) and donor sites (outgoing edge) independently.
Alternatively, we can allow up tok(defaultk =2) new edges to be selected from a set of “valuable” edgesE miss-ing in the splicmiss-ing graph. At mostkbinary variablesui,j,
1≤i<j≤ |S|, can be set to 1 for(vi,vj) /∈Eto relax the
edges inE. In general, however, any novel intron can be simply modeled by a corresponding edge inE:
1+ui,j≥xi+xj−
i<k<j
xk, 1≤i<j≤ |S|, (vi,vj) /∈E
(7)
(i,j)∈E
ui,j≤k (8)
ui,j=0, 1≤i<j≤ |S|, (vi,vj) /∈E∪E
(9)
Transcription start and end sites
We also have to ensure that improving transcripts built by our ILP start at segments in T SS and end at seg-ments in PAS. Our model captures both the exclusion of potential TSSs and TESs from spliced alignments (see Section “Candidate isoforms”), and theinclusionof tran-script boundaries, from, e.g., a RNA-seq read coverage drop or from additional reads from the 5 ends and polyadenylation sites of mRNAs (see Section “Integrating real RNA-seq, CAGE, and PAS-seq”).
Variablesssiandesiindicate the start and terminal
seg-ment of the generated isoform, respectively. We must select precisely one TSS and one TES (constraints Eqs. 10 and 11) from sets T SS and PAS, respectively (con-straints Eqs. 12 and 13). Designated start and end sites must be part of the predicted transcript (constraints Eqs. 14 and 15). Finally, no segment upstream of the start segment Eq. 16 and no segment downstream of the end segment Eq. 17 can be part of the predicted isoform:
vi∈V
ssi=1 (10)
vi∈V
esi=1 (11)
ssi=0, vi∈/T SS (12)
esi=0, vi∈/PAS (13)
xi≥ssi, vi∈V (14)
xi≥esi, vi∈V (15)
xi≤1−
|V|
j=i+1
ssj, vi∈V (16)
xi≤1− i−1
j=1
esj, vi∈V (17)
Intron retentions
The explicit exon model described in Section “Exon com-patibility” captures intron retentions by simply merging the flanking exons and the retained intron into one vir-tual exon that is added to setE. Similarly, the more general exon connectivity formulation that is based on individual splice sites rather than assembled exons trivially includes the connectivity of intron retentions.
Phase III: fine-tuning and post-processing
To adjust the regularization penalty λ to the increased set of candidate transcripts implicitly considered by the delayed isoform generation approach and to reduce the effect of the piecewise-linear approximation of the loss function, CIDANE re-solves Eq. 1 with the candidate setT containing additionally all transcripts generated in the course of the delayed isoform generation phase. We express a higher confidence in fully supported isoforms by selectively increasingλ = α·λ(defaultα = 1.3) for delayed generated transcripts.
Let transcriptsT∗ = {t1,. . .,tm} with non-zero
abun-danceθt∗1,. . .,θt∗m be returned by the regularized regres-sion Eq. 1 solved in phase I, optionally including the additional isoforms provided by our delayed isoform gen-eration approach (phase II). CIDANE determines the final prediction by post-processingT∗as follows. First, to avoid biases introduced by the regularization penaltiesλ, we re-solve Eqs. 2 and 3 for λ := 0 using set T∗ instead of T to obtain expression levelsθti. Second, we re-estimate the expression levels by computing a final assignment of mapped reads to isoforms that is guided by the relative abundancesθti:
r(tj)=
ci∈C:tj,ci>0
bi·
tj,ciθtj
tk∈T∗
tk,ciθtk
,
wherer(tj)is the number of reads assigned to isoformtj.
This assignment of reads to isoforms corrects overesti-mation or underestioveresti-mation of the total number of reads within a gene due to non-uniform read mapping coverage. For all isoformstj∈T∗withr(tj)≥α(defaultα=10), we
compute transcript expression levels in FPKM and finally return all isoforms whose predicted expression in FPKM is at leastβ percent (default β = 10) of the expression of the most abundant transcript for the same gene. When run with a partial annotation of the transcriptome of an organism, we increase the expression thresholdβto 20 % for novel transcripts.
Ethics approval Not applicable.
Additional files
Additional file 1: Additional figures and tables.(PDF 578 kb) Additional file 2: Algorithmic details.(PDF 238 kb)
Competing interests
The authors declare that they have no competing interests.
Authors’ contributions